Abstract
Objectives
MicroRNAs (miRNAs) contribute to control of cell cycle progression and are frequently deregulated in cancer. The focus of this study was to determine effects of miR‐142‐3p on the cell cycle progression and cancer cell proliferation.
Materials and methods
RT‐qPCR was performed to determine expression of miR‐142‐3p in a range of cancer cell lines and in clinical cancer specimens. To further understand its role, we restored its expression in cancer cell lines by transfection with miR‐142‐3p mimics or inhibitors. Effects of miR‐142‐3p on cell cycle progression and cell proliferation were also determined.
Results
miR‐142‐3p was down‐regulated in both cancer cell lines and cancer specimens. Its overexpression suppressed proliferation, whereas its depletion promoted it. In addition, miR‐142‐3p lead to cell cycle arrest in G2/M. Moreover, CDC25C was identified as being a target of miR‐142‐3p, ectopic expression of which reversed suppression of cell proliferation.
Conclusions
Our observations suggest that miR‐142‐3p functioned as a tumor suppressor by targeting CDC25C.
Introduction
Deregulated cell cycles and aberrant cell proliferation are critically implicated in cancer initiation and development, by disturbance of multiple signaling pathways. Although exact reasons for much tumourigenesis remain unkown, it is believed that one of its hallmarks is disordering of cell proliferation, and is thus strongly suggested to be connected with disorders of cell cycle 1.
Cell division cycle 25 (CDC25) family proteins are highly conserved dual‐specificity phosphatases, believed to be critical regulators of cell cycle progression, that dominate mitotic entry and exit by regulating activation of CDK1/Cyclin B 2. In mammalian cells, three isoforms, CDC25A, CDC25B and CDC25C, have been implicated in control of G1/S and G2/M transitions by regulating CDK1 and CDK2 activities 3. The CDC25s have been implied to be involved in malignant transformation 4. Abnormal expression of CDC25s have been reported in several cancers and their overexpression contribute to tumourigenesis 2. Activity of CDC25C is strictly regulated throughout the whole cell cycle. During cell division it dephosphorylates CDK1 to activate the CDK1‐Cyclin B complex, whereas CDK1‐Cyclin B complex phosphorylates CDC25C to enhance its phosphatase activity, resulting in an irreversible auto‐amplification loop that drives cells into mitosis 5. Thus deregulation of the CDK1‐Cyclin B‐CDC25C feedback loop could lead to unrestrained cell proliferation.
MicroRNAs (miRNA) are evolutionarily conserved, 20–24 nucleotide non‐coding RNAs. They exert their functions by binding to 3′‐untranslated regions (3′UTR) of target mRNAs, and thus modulate their cellular abundance or expression 6. More than 2, 500 human mature miRNA sequences are listed in the miRNA registry (miR Base release 21) and each of them is able to regulate a large number of different mRNAs (encoded by 250–500 target genes). Thus, there is a strong likelihood that approximately 20–80% of transcribed human genes are regulated by miRNAs 7. Since miRNAs play critical roles in a wide range of cell functions such as differentiation, division, proliferation and apoptosis 8, deregulated miRNAs are involved in pathogenesis of many human diseases, including cancers 9, 10, 11. miR‐142‐3p was first identified in haematopoietic cells 12, where it plays various roles in differentiation and functions during haemopoiesis 13, 14, 15. miR‐142‐3p is highly conserved among vertebrates16 and has been implicated in osteoblast differentiation, cardiac cell fate determination, and vascular development 17, 18. It has been reported to function with tumour suppressive effects in pancreatic cancer 19, osteosarcoma 20, cervical cancer 21, colon cancer22 and hepatocellulcar carcinoma 23, while it serves as an oncogenic biomarker for T cell acute lymphoblastic leukemia24 and oesophageal squamous cell carcinoma 25. However, mechanism of miR‐142‐3p in regulating cancer cell proliferation are still not well clarified.
In this study, we demonstrated miR‐142‐3p was downregulated in malignant tissues. It inhibited cancer cell proliferation by leading to cell cycle arrest in G2/M. Furthermore, CDC25C is a target of miR‐142‐3p and miR‐142‐3p inhibited cancer cell proliferation by down‐regulation of CDC25C expression.
Materials and methods
Cell culture and synchronization
Human breast cancer cell lines MCF‐7, MDA‐MB‐231, lung cancer cell lines A549, H1299, cervical cancer cell lines HeLa, Caski, liver cancer cell lines HepG2 and Hep3B, embryonic kidney cell line 293FT and breast epithelial cell line MCF10A were obtained from the Cell Bank of the Chinese Academy of Sciences (Shanghai, China). MCF10A was cultured in DMEM/F12 supplemented with 5% horse serum (Life Technologies, Grand Island, NY, USA), 10 μg/mL insulin (Sigma‐Aldrich, St Louis, MO, USA), 0.5 μg/mL hydrocortisone (Sigma‐Aldrich), 20 ng/mL EGF (R&D Systems), and 100 ng/mL cholera toxin (Sigma‐Aldrich). The 293FT cell line was cultured in DMEM supplemented with 10% FBS. MDA‐MB‐231, A549, H1299, HeLa, Caski, HepG2 and HepG3B cells were cultured in RPMI‐1640 medium supplemented with 10% FBS. All cells were cultured with 100 μg/ml streptomycin and 100 units/ml penicillin. Cells were expanded immediately and multiple aliquots were cryo‐preserved. Cells were then used within 6 months of resuscitation. Cell synchronization was performed as previously described 3.
Tissue specimens
The study was approved by the Institutional Review Board of the Tianjin Medical University Cancer Institute and Hospital and written consent was obtained from all participants. Cancer specimens were obtained from the Tianjin Medical University Cancer Institute and Hospital. 30 cases of primary breast cancer tissue, 20 cases of lung cancer tissue, 20 cases of cervical cancers and paired adjacent normal breast tissue specimens were included in this study. After radical prostatectomy, primary cancer tissues and the adjacent normal tissues were flash‐frozen in liquid nitrogen and stored at −80 °C. What about normal lung and cervical tissues? All tumours were from patients with newly diagnosed cancers who had received no therapy before sample collection.
Plasmids, miRNAs, antibodies and transfection
pcDNA3.1‐CDC25C was a gift from Toren Finkel (Addgene plasmid # 10964) miR‐142‐3p mimic and inhibitor were purchased from RiboBio (Shanghai, China). The CDC25C 3′‐UTR containing miR‐142‐3p binding site or miR‐142‐3p binding site mutated fragments were cloned into pGL3‐Control vector (Promega, Madison, WI, USA; pGL3‐25C‐3′UTR‐wt and pGL3‐25C‐3′UTR‐mu). Antibodies against CDC25C, CDK1, phospho‐CDK1Y15, Cyclin B1, α‐tubin and β‐actin were purchased from Cell Signaling Technology (Beverly, MA, USA).
miR‐142‐3p mimic (miR‐142‐mimic), miR‐142‐3p inhibitor (anti‐miR‐142), or the appropriate scrambled controls (mimic‐control and anti‐control) were transfected into different cell lines using lipofectamine RNAiMAX reagent (Life Technologies) according to the manufacturer's recommendations. The mammalian expression plasmids were transfected into different cells using lipofectamine 3000 reagent (Life Technologies) according to the manufacturer's recommendations. After transfection, the RNA and protein were extracted after 24 and 48 h, respectively.
RNA extraction and real‐time quanitative PCR
For mRNA detection, total RNA was isolated using mirVana PARIS kit (Life Technologies) and reverse transcription was performed using a First Strand cDNA Synthesis kit (TakaRa, Dalian, China), according to the manufacturer's instructions. Real‐time quantitative PCR was performed using GoTaq qPCR Master Mix (Promega) on a Bio‐Rad iQ5 Optical System (Bio‐Rad, Hercules, CA, USA); β‐actin was the internal mRNA quantity control. For miRNA detection, total RNA was isolated as described previously and was reverse transcribed with TaqMan MicroRNA Reverse Transcription kit and real‐time quantitative PCR was performed using TaqMan miR‐142‐3p and u6 RNA (used as a normalizer) assays (Life Technologies) following the manufacturer's instructions.
Immunoblotting
Cells were lysed in 1% Triton‐X 100 lysis buffer containing 1% Triton‐X 100, 150 mm NaCl, 50 mm Tris‐HCl with protease and phosphatase inhibitors (10 μg/ml aprotinin, 10 μg/ml leupeptin, 1 μg/ml pepstatin, 5 mm sodium orthovanadate, 50 mm NaF, 50 mm Na‐pyrophosphate, 150 μm phenylmethylsulfonyl fluoride). Cell lysates were separated by sodium dodecyl sulphate‐polyacrylamide gel electrophoresis and then transferred to a polyvinyldifluoride membrane Millipore, Bedford, MA, USA) which was was blocked with 5% (w/v) skimmed milk‐TBST (10 mm Tris, 150 mm NaCl, 0.05% Tween 20, pH 8.3) solution, followed by incubation with the primary antibodies diluted in skimmed milk‐TBST solution overnight at 4 °C. Then membranes were incubated with the corresponding horseradish peroxidase‐conjugated secondary antibodies (Sigma‐Aldrich) and immunoreactive protein bands were visualized by enhanced chemiluminescence reage‐nts (Millipore).
Immunofluorescence
Cell were seeded on glass coverslips in 24‐well plates, washed with PBS, fixed in 4% formaldehyde solution for 30 min and then permeabilized with 0.2% Triton X‐100/PBS for 15 min. They were then blocked with 2% BSA in PBS for 30 min. Samples were incubated with primary antibodies overnight at 4 °C, followed by incubation with FITC‐/TRITC‐conjugated secondary antibodies for 1 h at room temperature, and then stained with DAPI. Finally, they were observed using a fluorescence microscope.
Luciferase reporter assay
The luciferase assay was carried out on extracts from the different cancer cells co‐transfected for 24/48 h with corresponding plasmids and/or miRNAs, using a dual luciferase assay kit (Promega) according to the manufacturer's recommendations. Results were normalized against Renilla luciferase activity. All transfections were performed in triplicate.
Flow cytometric analysis
After transfection for 48 h, cells were fixed in 70% ethanol at 4 °C overnight and washed in PBS. Then, they were resuspended in 0.1% Triton‐X100/phosphate‐buffered saline and concomitantly treated with RNaseA (Sigma‐Aldrich) and stained with 50 μg/ml propidium iodide for 30 min. Cell cycles were analyzed using a Beckman Coulter EPICS flow cytometer (Krefeld, Germany).
Cell viability assay
Cell viability was examined using the MTT assay. Briefly, 24 h after transfection, cells were plated in 96‐well plates at 1 × 10³ cells/well and incubated for the appropriate time period. Then, 10 μl of 5 mg/ml MTT solution was added to each well and incubated for 4 h, medium being replaced by 100 μl dimethyl sulphoxide. Absorbance was measured at 570 nm using a spectrophotometer and cell growth curves were made according to the optical density values.
Cell proliferation assays
Plate colony formation and EdU assays were used to evaluate cell proliferation.
To perform plate colony formation assay, 24 h after transfection, 500–1000 cells were seeded per well in 6‐well plates. After about 2 weeks, colonies obtained were washed in PBS and fixed in 10% formalin for 10 min at room temperature, then washed in PBS followed by staining with haematoxylin. Colonies were counted and compared to controls.
The EdU assay (detected by EdU labeling/detection kit (Ribobio, Guangzhou, China)) was used according to the manufacturer's protocol. Briefly, after transfection for 48 h, cells were incubated with 25 μm EdU for 12 h. They were then fixed in 4% formaldehyde for 30 min at room temperature and treated with 0.5% Triton X‐100 for 15 min at room temerature for permeabilization. After washing in PBS, cells were reacted with Apollo reaction cocktail for 30 min. Subsequently, cell nuclei were stained with Hoechst 33342 at 5 μg/ml for 30 min. Pecentage of EdU‐positive cells was examined using fluorescence microscopy.
Statistical analysis
Data from all experiments was expressed as mean ± SD. All statistical analyses were performed using SPSS18.0 software system for Windows (SPSS Inc., Chicago, IL, USA). Each experiment was perfor‐med in triplicate. Differences between groups were compared using Student's t test. P < 0.05 were considered significant.
Results
miR‐142‐3p down‐regulated in cancer tissues
To investigate the potential significance of miR‐142‐3p in cancer development and progression, we first examined its expression in breast cancer, lung cancer, cervical cancer and hepatocellular carcinoma cell lines and tissues. RT‐qPCR analysis revealed that miR‐142‐3p was ubiquitously expressed at lower levels in cancer cells than in the breast epithelial cell line MCF10A and embryonic kidney cell line 293FT (Fig. 1a). In parallel, miR‐142‐3p expression was found to be low in breast cancer (Fig. 1b), lung cancer (Fig. 1c) and cervical cancer (Fig. 1d) tissues compared to that in paired adjacent non‐malignant areas. These data strongly suggested that miR‐142‐3p exression was significantly down‐regulated in the cancers.
Figure 1.
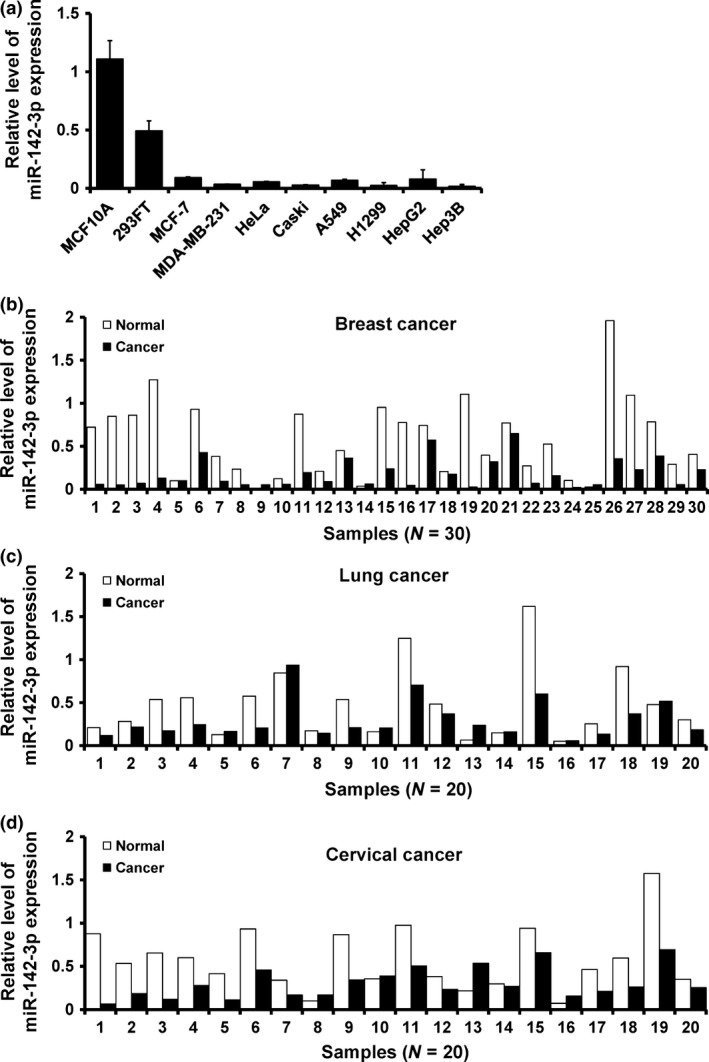
miR‐142‐3p down‐regulated in cancer tissues. (a) RT‐qPCR analysis of miR‐142‐3p expression in human embryonic kidney cell line 293FT, breast epithelial cell line MCF10A and indicated cancer cell lines. (b–d) relative expression of miR‐142‐3p in breast cancer (b), lung cancer (c), cervical cancer (d) and their corresponding adjacent non‐malignant tissues.
miR‐142‐3p inhibited cancer cell proliferation
In the attempt to understand biological function of miR‐142‐3p, we depleted or over‐expressed it in MCF10A or HeLa cells, by transfection of miR‐142‐3p inhibitor or mimic, respectively. miR‐142‐3p expression in miR‐142‐3p‐inhibitor‐transfected MCF10A cells or miR‐142‐3p‐mimic‐transfected HeLa cells was confirmed by RT‐qPCR (Fig. 2a). We next assessed effect of miR‐142‐3p expression on cell proliferation and results showed that miR‐142‐3p inhibitor significantly increased MCF10A cell viability (Fig. 2b; left) and miR‐142‐3p over‐expression strongly inhibited cell viability in HeLa cells (Fig. 2b; right). In addition, colony formation assay showed that numbers of colonies were higher in miR‐142‐3p‐depleted MCF10A cells (Fig. 2c; left), whereas they were lower in miR‐142‐3p‐overexpressed HeLa cells (Fig. 2c; right). Furthermore, the EdU assay showed 50% increase in EdU‐positive cells detected in response to miR‐142‐3p depletion in MCF10A cells (Fig. 2d; upper and Fig. 2e; left), whereas miR‐142‐3p mimic caused 30% reduction (Fig. 2d; lower and Fig. 2e; right). Similar results were also observed in MCF7 (Fig. S1) and A549 (Fig. S2) cells. Together, these results indicated that miR‐142‐3p inhibited the cancer cell proliferation.
Figure 2.
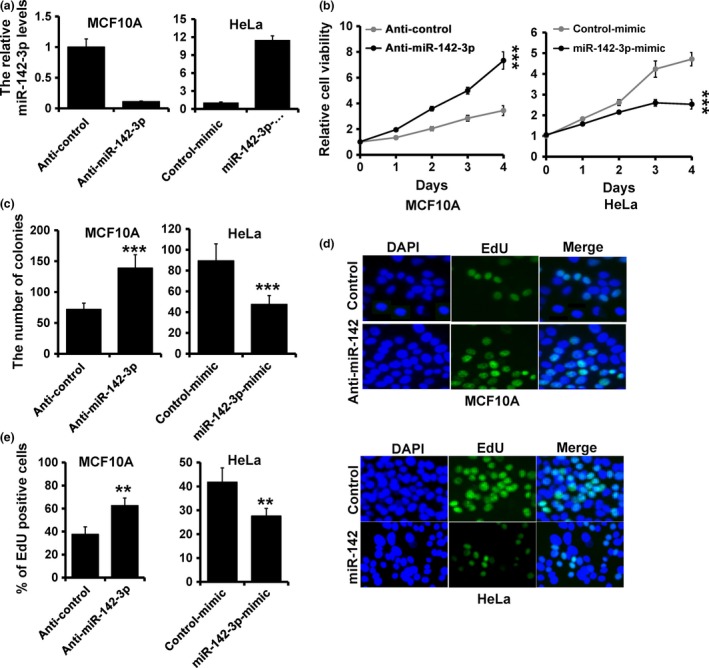
miR‐142‐3p inhibited cancer cell proliferation. (a) RT‐qPCR analysis of miR‐142‐3p expression in MCF10A (left) and HeLa (right) cells transfected with miR‐142‐3p inhibitor, miR‐142‐3p mimic, or appropriate controls (anti‐control or mimic‐control). (b) MTT analysis of cell growth in MCF10A and HeLa cells treated as in (a). (c) Colony formation of MCF10A and HeLa cells treated as in (a). (d and e) EdU analysis of MCF10A and HeLa cells treated as in (a). ***P < 0.001, **P < 0.01.
CDC25C was a direct target of miR‐142‐3p
To elucidate biological mechanisms underlying the role of miR‐142‐3p in promoting cancer cell proliferation, we investigated potential targets of miR‐142‐3p. Target prediction programs, miRanda and TargetScan, were applied and identified CDC25C asa putative miR‐142‐3p target (Fig. 3a). Functional regulation of CDC25C expression by miR‐142‐3p was analyzed by modulating its levels via depletion in MCF10A, and over‐expression in HeLa cells. CDC25C mRNA level was elevated in miR‐142‐3p‐depleted MCF10A cells compared to that in control cells (Fig. 3b; left). Meanwhile, protein level of CDC25C was also increased in miR‐142‐3p‐depleted MCF10A cells (Fig. 3c). On the other hand, over‐expression of miR‐142‐3p in HeLa cells resulted in reduced CDC25C mRNA and protein levels (Fig. 3b; right, and Fig. 3c).
Figure 3.
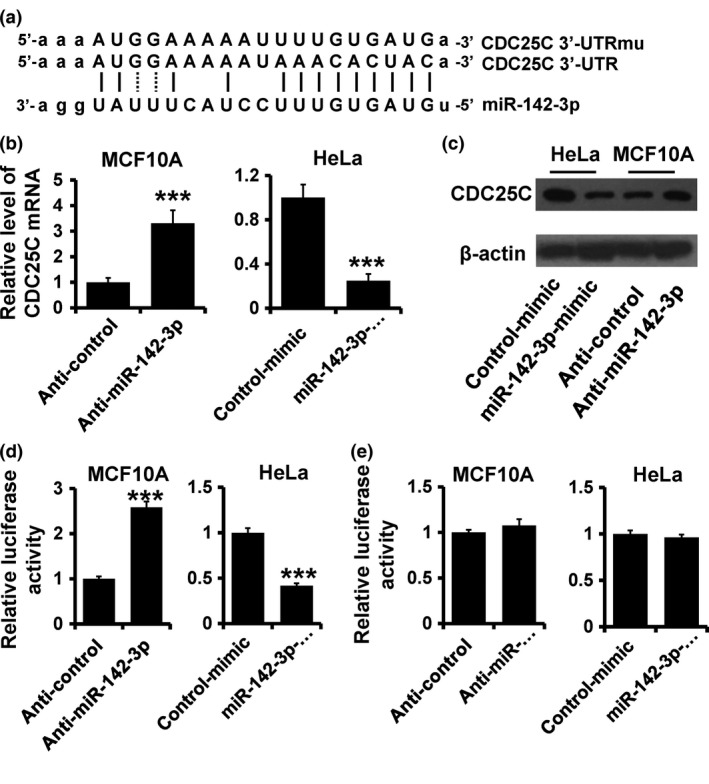
CDC 25C a target of miR‐142‐3p. (a) Predicted and mutated binding of miR‐142‐3p to CDC25C 3′UTR. (b and c) Immunoblot of CDC25C mRNA (b) and protein (c) expression in indicated cells. (d and e) Luciferase activity of pGL3‐25C‐3′UTR‐wt (d) and pGL3‐25C‐3′UTR‐mu (e) reporters in indicated cells co‐transfected with indicated oligonucleotides. ***P < 0.001.
To further confirm this regulation, CDC25C 3′‐UTR and its mutant containing the putative miR‐142‐3p binding sites were cloned downstream of the luciferase ORF (Fig. 3a). These reporter constructs were co‐transfected into MCF10A cells with miR‐142‐3p inhibitor or HeLa cells with miR‐142‐3p mimic. Depletion of miR‐142‐3p produced 2.5‐fold increase in luciferase activity derived from reporter constructs containing wild type CDC25C 3′‐UTR compared to that in control MCF10A cells (Fig. 3d; left). Meanwhile, over‐expression of miR‐142‐3p significantly suppressed luciferase activity with inhibition levels 40% compared to that of control HeLa cells (Fig. 3d; right). These effects were abolished by mutated CDC25C 3′‐UTR, in which binding sites for miR‐142‐3p were inactivated by site‐directed mutagenesis (Fig. 3e).
Collectively, these data support the bioinformatic prediction of CDC25C as a direct target of miR‐142‐3p.
miR‐142‐3p lead to cell cycle arrest in G2/M
To further clarify the mechanism of miR‐142‐3p in regulating cell proliferation, cell cycle distribution was analyzed using FACS. Ectopic expression of miR‐142‐3p induced accumulation of cells in G2/M compared to control HeLa cells (Fig. 4a; upper). However, depletion of miR‐142‐3p also induced accumulation of cells in G2/M in MCF10A cells (Fig. 4a; lower). This phenomenon was perhaps caused by up‐regulation of CDC25C. Immunoblotting analysis showed that cell cycle regulatory protein Cyclin B1 was elevated in miR‐142‐3p‐depleted MCF10A cells, whereas it was reduced in miR‐142‐3p‐overexpressing HeLa cells, compared to those of controls (Fig. 4b). Furthermore, CDK1 activity was higher (lower CDK1‐Y15 expression) in miR‐142‐3p‐depleted MCF10A cells, but lower (higher CDK1‐Y15 expression) in miR‐142‐3p‐overexpressing HeLa cells (Fig. 4b). To further assess the role of miR‐142‐3p in cell cycle progression, we performed double‐thymidine blocking to arrest HeLa cells at the G1/S transition; we noted an increased accumulation of G2/M cells in miR‐142‐3p‐overexpressing HeLa cells compared to contols (Fig. 4c). Moreover, we observed reduced exp‐ression of CDC25C and Cyclin B1 and CDK1 activity in miR‐142‐3p‐overexpressing HeLa cells compared to controls (Fig. 4d). Immunofluorescence staining indicated that numbers of mitotic cells decreased in miR‐142‐3p‐overexpressing HeLa cells (Fig. 4e, f). Together, these results indicate that miR‐142‐3p leads to cell cycle arrest in G2/M.
Figure 4.
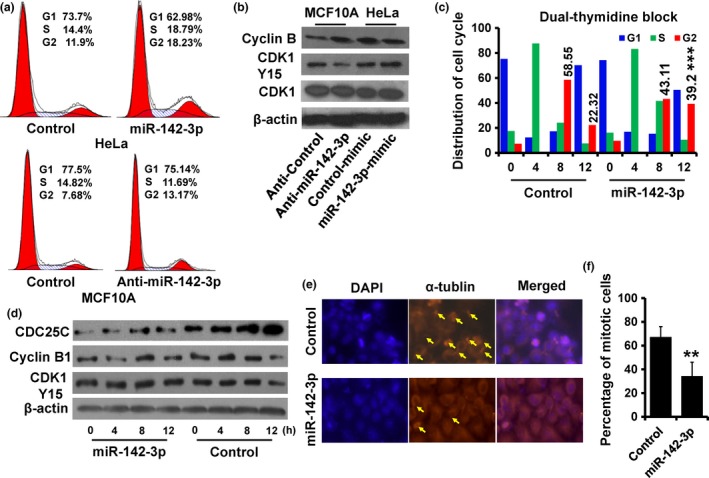
Over‐expression of miR‐142‐3p lead to cell arrest at G2/M. (a) Cell cycle distribution of indicated cells was analyzed by flow cytometry analysis. (b) Expression of Cyclin B1, CDK1 and CDK1‐pY15 as detected by immunoblotting. (c) Cell cycle distribution of miR‐142‐3p‐overexpressed and control HeLa cells analyzed by flow cytometry. These cells were synchronized at the G1/S transition by a double‐thymidine block and released for the indicated times. (d) Expression of Cyclin B1, CDC25C and CDK1‐pY15 in cells as treated in (c) was detected by immunoblotting. (e), Immunofluorescence staining of DAPI (blue) and α‐tublin (orange) in cells sychronized as in (c) after 12 h release; arrow, mitotic cells. (f) Abundance of mitotic cells as in (e) was analyzed. **P < 0.01.
miR‐142‐3p regulated cancer cell proliferation by downregulation of CDC25C expression
To further confirm miR‐142‐3p‐CDC25C regulation in cancer cell progression, we co‐transfected pcDNA3.1‐CDC25C expression plasmid and/or miR‐142‐3p mimic, as well as their controls in HeLa cells. Expression of miR‐142‐3p and CDC25C were confirmed by RT‐qPCR (Fig. 5a) and immunoblotting (Fig. 5b). Furthermore, Cyc‐lin B expression and CDK1 activity were rescued after transfection of pcDNA3.1‐CDC25C (Fig. 5b). We next assessed effects of CDC25C expression on proliferation in miR‐142‐3p‐overexpressing HeLa cells. Results showed that CDC25C overexpression rescued viability in miR‐142‐3p‐overexpressing HeLa cells (Fig. 5c). Colony formation assay showed that numbers of colonies was much higher in both CDC25C‐ and miR‐142‐3p‐overexpressing HeLa cells (Fig. 5d). EdU assay showed 100% increase in EdU‐positive cells, detected in response to CDC25C over‐expression in miR‐142‐3p‐overexpressing HeLa cells (Fig. 5e, f). Furthermore, depletion of CDC25C reversed the malignant phenotype induced by anti‐miR‐142‐3p in MCF10A cells (Fig. S3).
Figure 5.
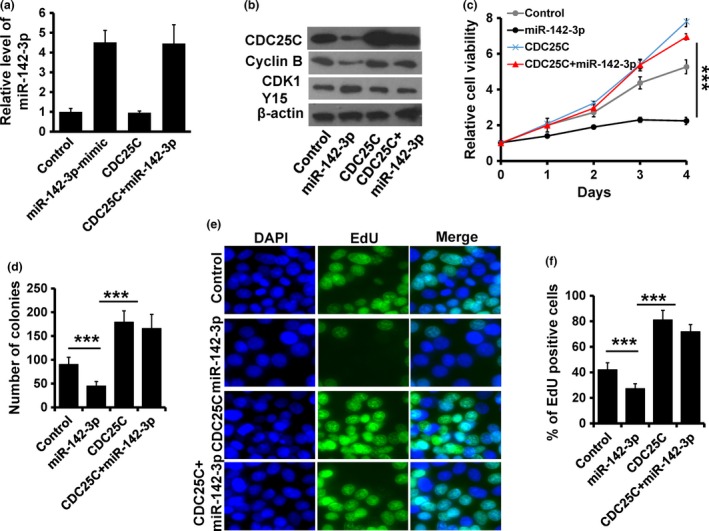
miR‐142‐3p regulated cancer cell proliferation in a CDC 25C‐dependent manner. (a) RT‐qPCR analysis of miR‐142‐3p expression in indicated HeLa cells. (b) Expression of Cyclin B1, CDC25C and CDK1‐pY15 detected by immunoblotting. (c) MTT analysis of cell growth in HeLa cells treated as in (a). (d) Colony formation of HeLa cells treated as in (a). (e and f) EdU analysis of HeLa cells treated as in (a). ***P < 0.001.
Taken together, our findings established a tumour suppressive role for miR‐142‐3p in cancer progression of these samples.To address whether expression of miR‐142‐3p was associated with its target, CDC25C in patients, CDC25C mRNA expression was examined, by RT‐qPCR, in the malignant tissues and paired normal oness. Results revealed that CDC25C expression was elevated in breast (Fig. 6a), lung (Fig. 6b) and cervical cancers (Fig. 6c) compared to the paired adjacent non‐malignant tissues. Furthermore, there was significant inverse correlation between miR‐142‐3p and CDC25C expression levels (Fig. 6d). Together, these results indicated that miR‐142‐3p inhibited cell proliferation in these cancers, through targeting CDC25C.
Figure 6.
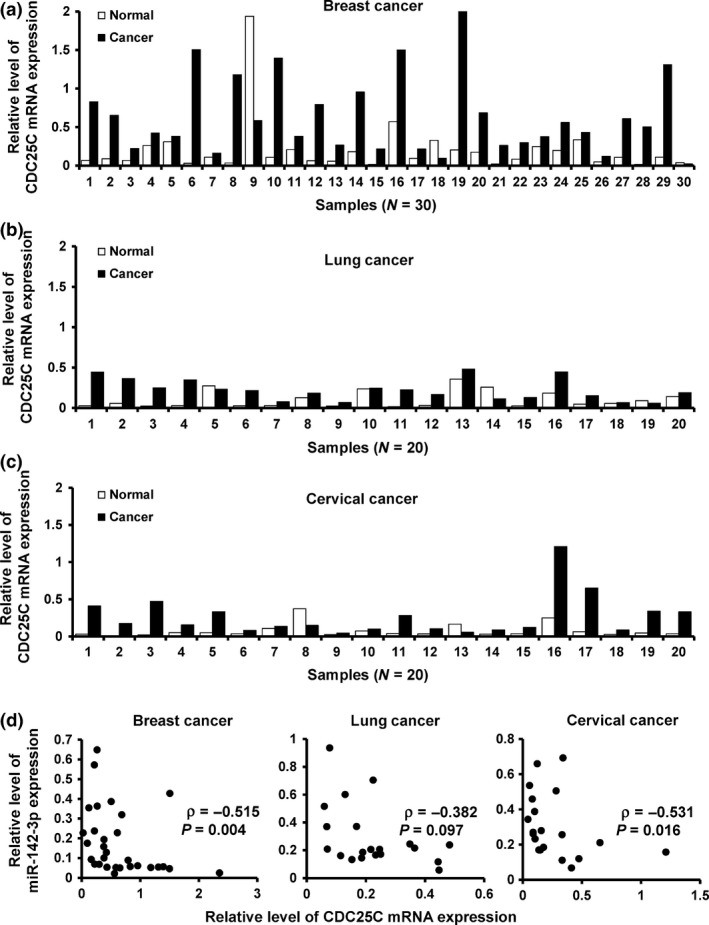
miR‐142‐3p expression inversely correlated with CDC 25C expression. (a–c), Relative expression of CDC25C in breast cancer (a), lung cancer (b), cervical cancer (c) and their corresponding adjacent non‐malignant tissues by RT‐qPCR. (d) Relationship between miR‐142‐3p and CDC25C mRNA expression in cancer samples by RT‐qPCR.
Discussion
In this study, we demonstrated that miR‐142‐3p was lower in malignant tissues compared to their adjacent normal tissues. Furthermore, we found that over‐expression of miR‐142‐3p in HeLa cells lead to suppression of Cyclin B1 and CDK1 activity, cell cycle arrest at the G2/M chechpoint, and disrupted cancer cell proliferation, whereas depletion of miR‐142‐3p up‐regulated Cyclin B1 and CDK1 activity and promoted cell proliferation. Molecularly, we found CDC25C to be a target of miR‐142‐3p.
miR‐142‐3p has previously been reported to be involved in malignant cell proliferation and metastasis, in many cancer types. For example, over‐expression of miR‐142‐3p inhibits cell proliferation in pancreatic cancer 19, osteosarcoma cells 20, cervical cancer 21 and colon cancer 22. Its over‐expression inhibits migratroy and invasive abilities of cervical cancer 21 and hepatocellular carcinoma cells 23. Consistent with these findings, we found that miR‐142‐3p functions as a tumour suppressor. Over‐expression of miR‐142‐3p inhibited cancer cell proliferation, whereas depletion of miR‐142‐3p resulted in increased cell proliferation in the cells and tissues we tested. Moreover, we observed that miR‐142‐3p lead to cell cycle arrest at G2/M, as indicated by down‐regulation of Cyclin B1 expression and CDK1 activity. These results indicate that miR‐142‐3p acted as a tumour suppressor in these cancer cells.
CDC25C belongs to a family of three conserved dual specificity phosphatases, which regulate cyclin‐dependent kinases. CDC25C is over‐expressed in several types of carcinoma 1, 26, 27. Cell cycle progression is dependent on activity of CDK complexes with their corresponding cyclin partners 28 and activation or inactivation of the CDK1‐CyclinB complex is the key hub in the mitotic entrance and exit. Both entry and exit from mitosis are driven by alternation in CDK1 activity 2 which is controlled by CDC25C phosphatase, turned on at the G2/M transition to catalyze CDK1 activation 29. Our results show that miR‐142‐3p over‐expression leads to suppression of mitotic entry by targeting CDC25C expression, resulting in inhibition of cell proliferation. Furthermore, the rescue experiments revealed that CDC25C down‐regulation was necessary in miR‐142‐3p‐induced cell cycle arrest. Taken together, our data indicate that miR‐142‐3p functions as a tumour suppressor, partially at least, through targeting CDC25C.
In summary, our data indicate that miR‐142‐3p inhibits cancer cell proliferation by directly regulating CDC25C expression. miR‐142‐3p seems to be a potential therapeutic target for cancer therapy.
Conflict of interest
The authors have no conflict of interest.
Supporting information
Fig. S1 miR‐142‐3p inhibits cell proliferation in MCF7 cells. (a) RT‐qPCR analysis of miR‐142‐3p expression in MCF7 cells transfected with the miR‐142‐3p mimic or mimic‐Control. (b) MTT analysis of cell growth in MCF7 cells treated as in (a). (c) Colony formation of MCF7 cells treated as in (a). (d and e) EdU analysis of MCF7 cells treated as in A. ***P < 0.001, **P < 0.01.
Fig. S2 miR‐142‐3p inhibits cell proliferation in A549 cells. (a) RT‐qPCR analysis of miR‐142‐3p expression in A549 cells transfected with the miR‐142‐3p mimic or mimic‐Control. (b) MTT analysis of cell growth in A549 cells treated as in (a). (c) Colony formation of A549 cells treated as in (a). (d and e) EdU analysis of A549 cells treated as in (a). ***P < 0.001, **P < 0.01.
Fig. S3 miR‐142‐3p regulates cancer proliferation in a CDC25C‐dependent manner. (a) RT‐qPCR analysis of miR‐142‐3p expression in indicated MCF10A cells. (b) The expression of Cyclin B1, CDC25C and CDK1‐pY15 was detected by immunoblot. (c) MTT analysis of cell growth in MCF10A cells treated as in (a). (d) Colony formation of MCF10A cells treated as in (a). (e and f) EdU analysis of MCF10A cells treated as in (a). ***P < 0.001.
Acknowledgements
This study was supported by the National Natural Science Foundation of China (no. 81372843, 81472472 and 81502518), the National Science and Technology Support Program (no. 2015BAI12B15), the Tianjin Municipal Natural Science Foundation (no. 13JCYBJC21800), the Tianjin Higher Education Science and Technology Development Foundation (no. 20130120), and the Natural Science Foundation of Tianjin Medical University (no. 2014KYM05).
References
- 1. Wang Z, Trope CG, Florenes VA, Suo Z, Nesland JM, Holm R (2010) Overexpression of CDC25B, CDC25C and phospho‐CDC25C (Ser216) in vulvar squamous cell carcinomas are associated with malignant features and aggressive cancer phenotypes. BMC Cancer 10, 233. [DOI] [PMC free article] [PubMed] [Google Scholar]
- 2. Boutros R, Lobjois V, Ducommun B (2007) CDC25 phosphatases in cancer cells: key players? Good targets? Nat. Rev. Cancer 7, 495–507. [DOI] [PubMed] [Google Scholar]
- 3. Yu Y, Wang XY, Sun L, Wang YL, Wan YF, Li XQ et al (2014) Inhibition of KIF22 suppresses cancer cell proliferation by delaying mitotic exit through upregulating CDC25C expression. Carcinogenesis 35, 1416–1425. [DOI] [PubMed] [Google Scholar]
- 4. Kristjansdottir K, Rudolph J (2004) Cdc25 phosphatases and cancer. Chem. Biol. 11, 1043–1051. [DOI] [PubMed] [Google Scholar]
- 5. Nilsson I, Hoffmann I (2000) Cell cycle regulation by the Cdc25 phosphatase family. Progress Cell Cycle Res. 4, 107–114. [DOI] [PubMed] [Google Scholar]
- 6. Garzon R, Calin GA, Croce CM (2009) MicroRNAs in Cancer. Annu. Rev. Med. 60, 167–179. [DOI] [PubMed] [Google Scholar]
- 7. Bartel DP (2009) MicroRNAs: target recognition and regulatory functions. Cell 136, 215–233. [DOI] [PMC free article] [PubMed] [Google Scholar]
- 8. Stefani G, Slack FJ (2008) Small non‐coding RNAs in animal development. Nat. Rev. Mol. Cell Biol. 9, 219–230. [DOI] [PubMed] [Google Scholar]
- 9. Garofalo M, Condorelli G, Croce CM (2008) MicroRNAs in diseases and drug response. Curr. Opin. Pharmacol. 8, 661–667. [DOI] [PubMed] [Google Scholar]
- 10. Xu J, Zhao J, Evan G, Xiao C, Cheng Y, Xiao J (2012) Circulating microRNAs: novel biomarkers for cardiovascular diseases. J. Mol. Med. 90, 865–875. [DOI] [PubMed] [Google Scholar]
- 11. Tili E, Michaille JJ, Croce CM (2013) MicroRNAs play a central role in molecular dysfunctions linking inflammation with cancer. Immunol. Rev. 253, 167–184. [DOI] [PubMed] [Google Scholar]
- 12. Abdul Razak SR, Baba Y, Nakauchi H, Otsu M, Watanabe S (2014) DNA Methylation is involved in the expression of miR‐142‐3p in fibroblasts and induced pluripotent stem cells. Stem Cells Int. 2014, 101349. [DOI] [PMC free article] [PubMed] [Google Scholar]
- 13. Sun Y, Varambally S, Maher CA, Cao Q, Chockley P, Toubai T et al (2011) Targeting of microRNA‐142‐3p in dendritic cells regulates endotoxin‐induced mortality. Blood 117, 6172–6183. [DOI] [PMC free article] [PubMed] [Google Scholar]
- 14. Wang XS, Gong JN, Yu J et al (2012) MicroRNA‐29a and microRNA‐142‐3p are regulators of myeloid differentiation and acute myeloid leukemia. Blood 119, 4992–5004. [DOI] [PubMed] [Google Scholar]
- 15. Nimmo R, Ciau‐Uitz A, Ruiz‐Herguido C, Soneji S, Bigas A, Patient R et al (2013) MiR‐142‐3p controls the specification of definitive hemangioblasts during ontogeny. Dev. Cell 26, 237–249. [DOI] [PubMed] [Google Scholar]
- 16. Skarn M, Baroy T, Stratford EW, Myklebost O (2013) Epigenetic regulation and functional characterization of microRNA‐142 in mesenchymal cells. PLoS ONE 8, e79231. [DOI] [PMC free article] [PubMed] [Google Scholar]
- 17. Nishiyama T, Kaneda R, Ono T, Tohyama S, Hashimoto H, Endo J et al (2012) miR‐142‐3p is essential for hematopoiesis and affects cardiac cell fate in zebrafish. Biochem. Biophys. Res. Commun. 425, 755–761. [DOI] [PubMed] [Google Scholar]
- 18. Lalwani MK, Sharma M, Singh AR et al (2012) Reverse genetics screen in zebrafish identifies a role of miR‐142a‐3p in vascular development and integrity. PLoS ONE 7, e52588. [DOI] [PMC free article] [PubMed] [Google Scholar]
- 19. MacKenzie TN, Mujumdar N, Banerjee S, Sangwan V, Sarver A, Vickers S et al (2013) Triptolide induces the expression of miR‐142‐3p: a negative regulator of heat shock protein 70 and pancreatic cancer cell proliferation. Mol. Cancer Ther. 12, 1266–1275. [DOI] [PMC free article] [PubMed] [Google Scholar]
- 20. Yang YQ, Qi J, Xu JQ, Hao P (2014) MicroRNA‐142‐3p, a novel target of tumor suppressor menin, inhibits osteosarcoma cell proliferation by down‐regulation of FASN. Tumour Biol. 35, 10287–10293. [DOI] [PubMed] [Google Scholar]
- 21. Deng B, Zhang Y, Zhang S, Wen F, Miao Y, Guo K (2015) MicroRNA‐142‐3p inhibits cell proliferation and invasion of cervical cancer cells by targeting FZD7. Tumour Biol. 36, 8065–8073. [DOI] [PubMed] [Google Scholar]
- 22. Shen WW, Zeng Z, Zhu WX, Fu GH (2013) MiR‐142‐3p functions as a tumor suppressor by targeting CD133, ABCG2, and Lgr5 in colon cancer cells. J. Mol. Med. 91, 989–1000. [DOI] [PubMed] [Google Scholar]
- 23. Wu L, Cai C, Wang X, Liu M, Li X, Tang H (2011) MicroRNA‐142‐3p, a new regulator of RAC1, suppresses the migration and invasion of hepatocellular carcinoma cells. FEBS Lett. 585, 1322–1330. [DOI] [PubMed] [Google Scholar]
- 24. Lv M, Zhang X, Jia H, Li D, Zhang B, Zhang H et al (2012) An oncogenic role of miR‐142‐3p in human T‐cell acute lymphoblastic leukemia (T‐ALL) by targeting glucocorticoid receptor‐alpha and cAMP/PKA pathways. Leukemia 26, 769–777. [DOI] [PubMed] [Google Scholar]
- 25. Lin RJ, Xiao DW, Liao LD et al (2012) MiR‐142‐3p as a potential prognostic biomarker for esophageal squamous cell carcinoma. J. Surg. Oncol. 105, 175–182. [DOI] [PubMed] [Google Scholar]
- 26. Li BZ, Chen ZL, Shi SS, Feng XL, Tan XG, Zhou F et al (2013) Overexpression of Cdc25C predicts response to radiotherapy and survival in esophageal squamous cell carcinoma patients treated with radiotherapy followed by surgery. Chin. J. Cancer 32, 403–409. [DOI] [PMC free article] [PubMed] [Google Scholar]
- 27. Ozen M, Ittmann M (2005) Increased expression and activity of CDC25C phosphatase and an alternatively spliced variant in prostate cancer. Clin. Cancer Res. 11, 4701–4706. [DOI] [PubMed] [Google Scholar]
- 28. Malumbres M, Barbacid M (2009) Cell cycle, CDKs and cancer: a changing paradigm. Nat. Rev. Cancer 9, 153–166. [DOI] [PubMed] [Google Scholar]
- 29. Forester CM, Maddox J, Louis JV, Goris J, Virshup DM (2007) Control of mitotic exit by PP2A regulation of Cdc25C and Cdk1. Proc. Natl Acad. Sci. USA 104, 19867–19872. [DOI] [PMC free article] [PubMed] [Google Scholar]
Associated Data
This section collects any data citations, data availability statements, or supplementary materials included in this article.
Supplementary Materials
Fig. S1 miR‐142‐3p inhibits cell proliferation in MCF7 cells. (a) RT‐qPCR analysis of miR‐142‐3p expression in MCF7 cells transfected with the miR‐142‐3p mimic or mimic‐Control. (b) MTT analysis of cell growth in MCF7 cells treated as in (a). (c) Colony formation of MCF7 cells treated as in (a). (d and e) EdU analysis of MCF7 cells treated as in A. ***P < 0.001, **P < 0.01.
Fig. S2 miR‐142‐3p inhibits cell proliferation in A549 cells. (a) RT‐qPCR analysis of miR‐142‐3p expression in A549 cells transfected with the miR‐142‐3p mimic or mimic‐Control. (b) MTT analysis of cell growth in A549 cells treated as in (a). (c) Colony formation of A549 cells treated as in (a). (d and e) EdU analysis of A549 cells treated as in (a). ***P < 0.001, **P < 0.01.
Fig. S3 miR‐142‐3p regulates cancer proliferation in a CDC25C‐dependent manner. (a) RT‐qPCR analysis of miR‐142‐3p expression in indicated MCF10A cells. (b) The expression of Cyclin B1, CDC25C and CDK1‐pY15 was detected by immunoblot. (c) MTT analysis of cell growth in MCF10A cells treated as in (a). (d) Colony formation of MCF10A cells treated as in (a). (e and f) EdU analysis of MCF10A cells treated as in (a). ***P < 0.001.


