Abstract
Optogenetic techniques use light-responsive proteins to study dynamic processes in living cells and organisms. These techniques typically rely on repurposed naturally occurring light-sensitive proteins to control sub-cellular localization and activity. We previously engineered two optogenetic systems, the Light Activated Nuclear Shuttle (LANS) and the Light-Inducible Nuclear eXporter (LINX), by embedding nuclear import or export sequence motifs into the C-terminal helix of the light-responsive LOV2 domain of Avena sativa phototropin 1, thus enabling light-dependent trafficking of a target protein into and out of the nucleus. While LANS and LINX are effective tools, we posited that mutations within the LOV2 hinge-loop, which connects the core PAS domain and the C-terminal helix, would further improve the functionality of these switches. Here, we identify hinge-loop mutations that favourably shift the dynamic range (the ratio of the on- to off-target subcellular accumulation) of the LANS and LINX photoswitches. We demonstrate the utility of these new optogenetic tools to control gene transcription and epigenetic modifications, thereby expanding the optogenetic ‘tool kit’ for the research community.
Keywords: Optogenetics, nucleocytoplasmic shuttle, LANS, LINX, LOV2, dynamic range
GRAPHICAL ABSTRACT
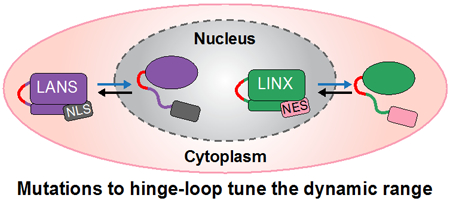
Cells regulate dynamic biological processes through precise spatiotemporal control of protein localization and activity. To better study and mimic these processes, there has been considerable effort in developing engineered proteins that can be readily switched on and off in living systems. Of particular interest are light-sensitive proteins that can be activated with exquisite control using lasers. This field of study, often referred to as optogenetics, has enabled researchers to regulate a variety of processes including neuronal activity, GTPase signalling and transcription1,2.
Shuttling proteins into and out of the nucleus is a major mode of regulation of signalling events in eukaryotic cells, and light-inducible systems have been developed for controlling these pathways, providing exquisite control of protein function3. Some achieve control of nuclear localization by dimerization4–6 while others sensitize nuclear localization signal (NLS) or nuclear export signal (NES) motifs to light by integrating them within light-responsive, or photoactivatable, proteins7–10. The latter approach has proven particularly powerful, as it only requires the fusion of a target to a small protein domain that functions independently of exogenous chromophores, thereby conferring both rapid and reversible switching upon light illumination. Light-inducible nucleocytoplasmic shuttles have been used to control transcriptional activity, measure cell cycle progression, determine the dynamics of histone modifications, and define key aspects of multicellular development4–9. The broad biological utility of the technique is evident in its application in mammalian tissue culture as well as diverse organisms, including yeast, zebrafish, and C. elegans.
We and others have used the photosensitive LOV2 domain from Avena sativa phototropin 1 to create light-conditioned NLS and NES for the control of nucleocytoplasmic shuttling7–10. This photocaging is based on the reduced affinity of peptides for their binding partners in the dark, and enhanced affinity in the light. LOV2 conformational change is the basis for photocaging, wherein blue light irradiation induces unfolding of the LOV2 N-terminal (A’α) and C-terminal (Jα) helices from the core LOV2 fold, exposing previously occluded peptides embedded in the Jα helix to their binding partners in blue light11–13. Shuttling photoswitches make use of NLS and NES sequences that are bound by endogenous transport molecules, which traffic proteins in and out of the nucleus14. In particular, importins bind NLS sequences and trigger nuclear import, whereas exportin binds NES sequences and facilitates nuclear export14,15. These binding and shuttling interactions form the basis for photoactivatable protein tags capable of both nuclear import and export.
These import and export optogenetic switches use intracellular trafficking to achieve control of protein localization. For example, we recently created LANS (Light Activated Nuclear Shuttle) with two critical elements carefully selected to balance their binding affinities and hence strength: an NLS embedded into the LOV2 C-terminal Jα helix such that the sequence is occluded in the dark and exposed to binding in the light, and an NES fused to the LOV2 N-terminus such that it is exposed to binding in both the dark and the light8. In the dark, exportin binds the NES and sequesters LANS to the cytoplasm since the NES is constitutively exposed and the NLS is blocked. Upon blue light irradiation, the Jα helix un-docks from the core LOV2 domain, unfolding from the hinge-loop region and exposing the NLS to importin binding. The NLS binds to importin more tightly than the NES binds exportin, so that nuclear import is preferred upon light activation. Once irradiation ceases, the Jα helix refolds and cages the NLS, reducing affinity for importin and allowing the exposed NES to direct the protein to the cytoplasm. Hence, LANS is a reversible system that enables translocation of a protein into the nucleus upon light exposure and out of the nucleus when shifted to the dark. In addition, we created LINX (Light-Inducible Nuclear eXporter) in a similar manner, this time inverting the locations of the signal sequences by engineering the NES into the LOV2 C-terminal Jα helix and fusing the NLS to the LOV2 N-terminus10. For LINX, the balance between the two signals is tuned to achieve import to the nucleus in the dark and export to the cytoplasm in blue light. LANS and LINX represent complementary strategies to control protein localization with light.
Photoactivatable proteins often suffer from either incomplete caging that leads to dark state leakiness or incomplete activation in the light – both of which hinder the dynamic range and thus their utility. We have previously sought to expand the LANS dynamic range by sequestering it to a location in the cytoplasm using a protein engineered to interact with LANS only in the dark16. Using a more general approach to improve the dynamic range of switches based on the LOV2 domain, a number of laboratories, including ours, have sought stabilizing mutations that successfully reduce transient unfolding of the Jα helix in the dark17–20. Independent directed evolution-based experiments have identified stabilizing mutations throughout the LOV2 domain, including mutations within the LOV2 hinge-loop region19,20. However, the mutations in the hinge-loop region have not been studied outside the context of other mutations to assess their impact on the photoswitch. In this report, we determined how mutations in the hinge-loop region, residues 519–522 (HVRD), affect the dynamic range of LANS and LINX. We identify mutations that improve dark state caging, characterize their switching behaviour, and demonstrate their utility in several cell-based assays to control transcriptional regulation and the presence of histone post-translational modifications.
RESULTS AND DISCUSSION
Design and in vitro characterization of LOV2 loop hinge mutants.
In this study, we sought to broaden the utility of light-activated nucleocytoplasmic shuttles by improving their dynamic range. Light-inducible systems often exhibit residual activity in the dark or activate incompletely in the light. Previously, we designed and characterized photoswitches for the LANS and LINX systems (Figure 1a), making them well suited for testing mutations in the LOV2 hinge-loop region (residues 519–522).
Figure 1.
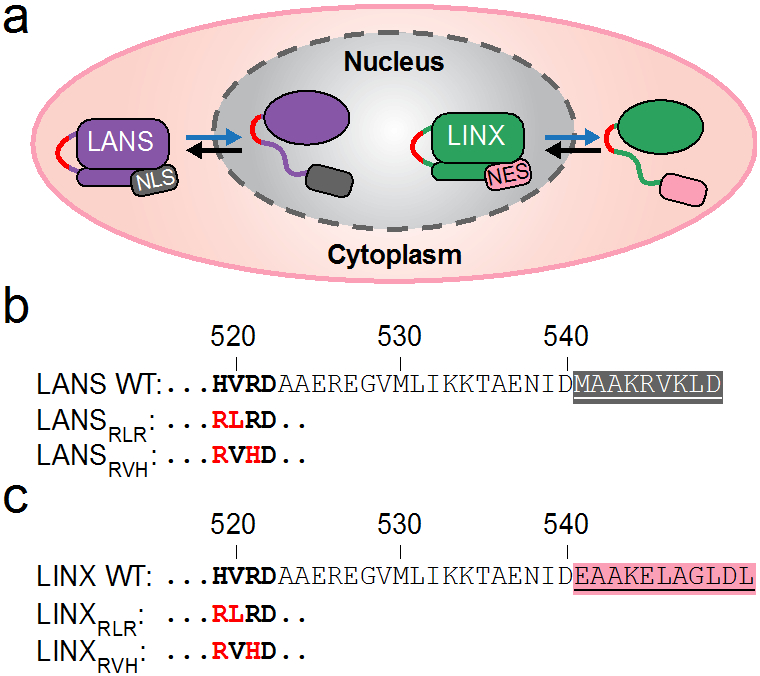
Designs and amino acid sequences of the nuclear import and export photoswitches and the mutations tested herein. (a) Schematic showing light-induced unfolding of the Jα helix and subsequent nuclear import of the Light Activated Nuclear Shuttle (LANS) in purple and nuclear export of the Light Induced Nuclear Exporter (LINX) in green (blue arrows) as well as dark-induced refolding of the Jα helix and subsequent export of LANS and import of LINX (black arrows). Mutations in the hinge-loop region (red). (b) Sequence alignment of wild type LANS depicting the NLS (highlighted gray), the hinge-loop region (bold), and mutations to the hinge-loop (red). (c) Sequence alignment of wild type LINX depicting the NES (highlighted pink) as well as the hinge-loop region and mutations as in (b).
First, we introduced an H519R mutation as a key convergent mutation identified in two previous directed-evolution studies aimed at stabilizing the closed state of the LOV2 domain (Supplementary Figure 1a)19,20. These studies resulted in the development of an improved light inducible dimer (iLID) and the Fast Light- and Activity-Regulated Expression (FLARE) system. A comparison of the dark state crystal structures for the wild type LOV2 domain (pdb code: 2v0u) and for iLID (pdb code: 4wf0) shows that replacing histidine 519 with arginine increases contacts between the hinge-loop and tryptophan 491, which is located on the LOV2 β-sheet. Arginine 519 interacts with tryptophan 491 via its three aliphatic carbons as well as forms π stacking interactions with its guanidino group. We then generated all combinations of H519R with wild type and mutant hinge-loop residues derived from the directed evolution screen for iLID. We selected mutations found in the four sequences with the highest dynamic ranges, namely V520L, V520R, R521H, and D522G (Supplementary Figure 1b)19. This resulted in twelve variants with mutations to the wild type HVRD hinge-loop (R519V520R521D522, RLRD, RVHD, RRRD, RRHD, RLHD, RVRG, RLRG, RVHG, RRRG, RRHG, RLHG; Supplementary Figure 1c). Position 520 is of particular interest because it packs against residue leucine 493 from the LOV2 β-sheet, forming interactions that are likely to stabilize the closed/dark state of the LOV2 domain. Using competitive fluorescence polarization binding assays, we measured the binding affinity of each of these twelve LANS variants to importin α7 in the lit and dark states (Supplementary Figures 2 and 5; Supplementary Table 1). We selected two variants, RLRD and RVHD (designated RLR and RVH, respectively), based on their weaker dark state affinities and high fold-changes in affinities compared to other variants, for further testing in LANS and LINX (Figure 1).
We measured the binding affinity of the original (wild type) LANS to importin α7 in the lit and dark states and compared it to that of the LANS mutants RLR and RVH (Figure 2 and Table 1). The wild type LANS binding affinity switched from 1.3 ± 0.6 μM under blue light to 30.4 ± 18.0 μM in the dark, LANSRLR binding affinity switched from 5.1 ± 1.7 μM to 132.5 ± 74.9 μM, and LANSRVH binding affinity switched from 2.3 ± 1.2 μM to 19.3 ± 4.9 μM (Table 1). Thus, RLR binds weaker than wild type LANS in both dark and lit states, leading to a dynamic range that is right-shifted along a linear representation of binding, and RVH binds with similar affinities to wild type. The shift in the dynamic range for RLR toward weaker binding suggests that this variant may result in diminished nuclear import in the dark when used in cells, and therefore lower background activity for nuclear target proteins in the off state of the switch.
Figure 2.
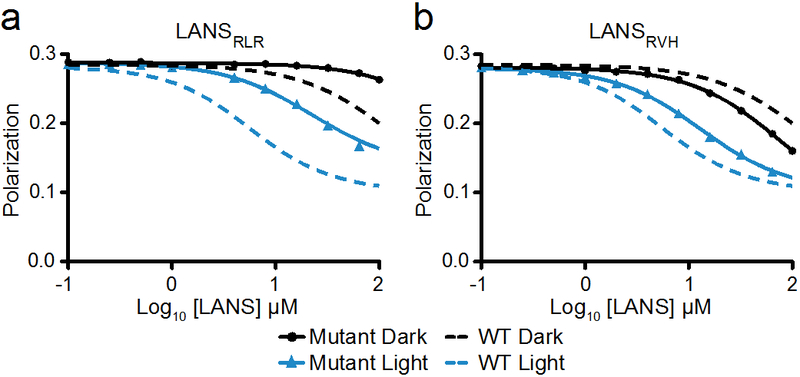
Binding of LANS proteins in the light and dark. Fluorescence polarization competitive binding assay of importin α7 bound to TAMRA-labelled NLS against titrated LANSRLR (a) or LANSRVH (b) at 25°C. For comparison, the dotted lines show the titration against wild type LANS.
Table 1.
Binding affinities of LANS for importin α7 in the dark and light as well as light to dark fold-changes.
| Affinity (μM) |
|||
|---|---|---|---|
| LANS | Dark | Light | Fold-change |
| WT | 30.4 ± 18.0 | 1.3 ± 0.6 | 23.7 |
| RLR | 132.5 ± 74.9 | 5.1 ± 1.7 | 25.7 |
| RVH | 19.3 ± 4.9 | 2.3 ± 1.2 | 8.5 |
Interestingly, we observed an increased fold-change for WT LANS (~24-fold) compared to the 6-fold change we previously reported8. Most of the discrepancy appears to be due to a change in temperature regulation during the titration. All of the titrations performed for this current study were temperature controlled with a 25°C water jacket around the cuvette holder, while the previous study was performed at room temperature without explicit temperature control of the cuvette. We replicated the previous experimental conditions without temperature control and found that the temperature in the cuvette reached 30°C or higher because of heat generated by the fluorimeter. We therefore repeated the WT titration with the cuvette maintained at 30°C and observed that the change in binding affinity between the lit and dark state was similar to what we previously reported (Supplementary Figure 3). Serendipitously, this reveals a previously underappreciated factor that contributes to the observed dynamic range of LOV2-based photoswitches. This observation is consistent with biophysical studies demonstrating temperature dependence of light-induced adduct formation and changes in LOV2 secondary structure21,22. This finding may have implications in both identifying mutations that improve dynamic range of photoswitches as well as experimental design using these photoswitches. In the following studies in mammalian tissue culture and yeast, we controlled temperature and environmental conditions as appropriate for each biological system.
RLR and RVH mutations in LANS and LINX improve control over localization.
To measure the nucleocytoplasmic distribution of the photoswitches in living HeLa cells, we fused them with fluorescent proteins and used confocal microscopy to monitor localization under steady-state conditions and during photoactivation. We tested our mutations in LANS4, a LANS variant with robust switching capabilities between the dark and light states8, and LINXa3, a LINX variant with good switching capabilities and a relatively strong NLS enabling high nuclear localization in the dark state10.
For still images collected under steady-state conditions, cells expressing LANS4 and LINXa3 variants were imaged in the dark either with a previously-characterized LOV2 point mutant (I539E) that mimics the LOV2 lit state conformation23 or without this lit mimetic point mutation. By using the lit mimetic, we were able to image a large number of cells to better characterize the performance of each variant without requiring blue light activation (Figure 3). For LANS4, both mutants exhibited lower nuclear localization in the dark than wild type (dark state nuclear/cytoplasmic fluorescence for WT = 0.47 ± 0.02, RLR = 0.27 ± 0.02, RVH = 0.34 ± 0.02, n = 25, 14, and 28, respectively; Figure 3a). These alterations in nucleocytoplasmic distributions in the dark state with respect to wild type lead to increased dark to light fold-changes: the wild type fold-change was 4.8 whereas fold-changes for RLR and RVH were 7.6 and 7.2, respectively. For LINXa3, both mutants exhibited higher nuclear localization in the dark than the wild type LINXa3 (dark state nuclear/cytoplasmic fluorescence for WT = 2.78 ± 0.16, RLR = 5.83 ± 0.38, RVH = 4.94 ± 0.44, n = 11, 16, and 14, respectively; Figure 3b). Both mutants also exhibited lower nuclear localization than wild type for the lit mimetic (lit mimetic nuclear/cytoplasmic fluorescence for WT = 0.55 ± 0.03, RLR = 0.43 ± 0.02, RVH = 0.38 ± 0.02, n = 16, 14, and 14, respectively; Figure 3b). Similar to LANS4, the changes in nucleocytoplasmic distributions for LINXa3 variants in the two states result in increased light to dark fold-changes with respect to wild type: the wild type fold-change was 5.0 whereas the fold-changes for RLR and RVH were 13.6 and 12.9, respectively. Thus, both mutants demonstrated better caging in the dark for both LANS4 and LINXa3. In particular, both LINXa3 mutants also demonstrated better unfolding in the light, leading to increased dynamic ranges for both mutants in either LANS4 or LINXa3.
Figure 3.
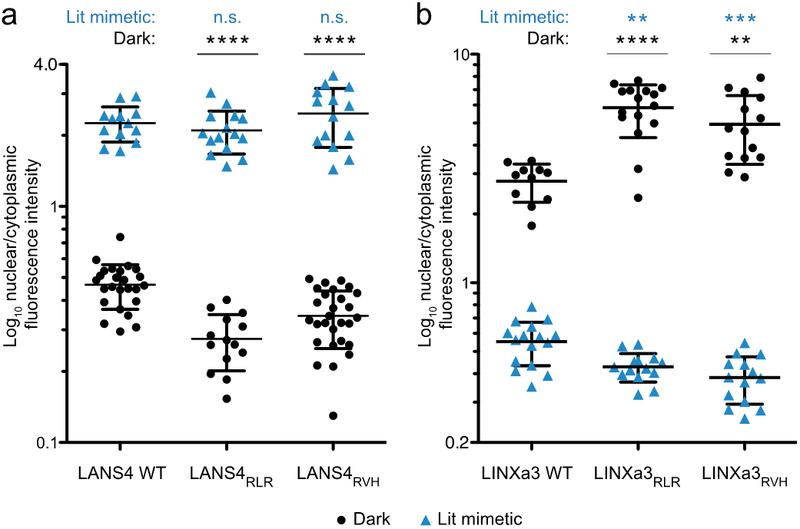
Control of protein localization in the dark and with a lit mimetic using LANS4 and LINXa3. Quantification of nuclear/cytoplasmic distribution from still images of HeLa cells expressing wild type, RLR, or RVH variants of LANS4 (a) and LINXa3 (b) either in the dark (black circles) or in the dark but expressing a lit mimetic (I539E) variant of the photoswitch (blue triangles). Mean ± s.d. were calculated from images of multiple cells (n ≥ 11). **P < 0.01, ***P < 0.001, and ****P < 0.0001 by unpaired two-tailed t-test relative to the wild type dark or lit mimetic; n.s. – not significant.
We next used blue light to activate the LANS4 and LINXa3 variants with the RLR or RVH mutations to reversibly direct proteins into and out of the nucleus (Figures 4a and 5a, Supplementary Videos 1-6). For LANS4, both mutants exhibited increased dark to light fold-change differences in nucleocytoplasmic distribution with respect to wild type: the wild type fold-change was 3.1 whereas the fold-changes for RLR and RVH were 4.6 and 5.7, respectively (Figures 4a and 4b, Supplementary Videos 1-3, Supplementary Table 2).
Figure 4.
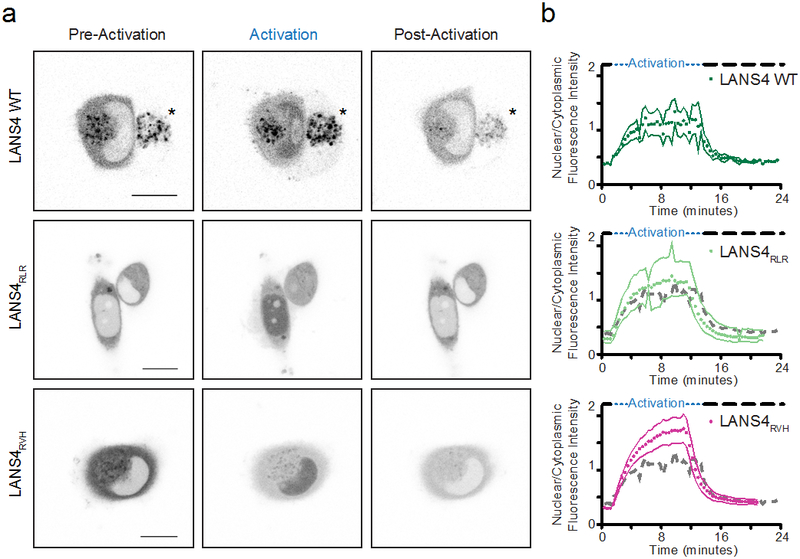
Control of protein localization with LANS4. (a) Photoactivation of wild type LANS4, LANS4RLR, or LANS4RVH fused to fluorescent proteins in HeLa cells. Snapshots from before blue light exposure (pre-activation), after 10 minutes of blue light exposure (activation), and after 10 minutes of dark (post-activation) from activation of a field of cells over time (Supplementary Videos 1-3; scale bars are 15 μm). Asterisks indicate an adjacent cell out of plane and not used for quantification. (b) Quantification of nuclear/cytoplasmic fluorescence intensity change upon blue light activation (activations, n = 3). The dotted gray line is the LANS4 WT mean for comparison. Mean ± s.e.m. was calculated from images of multiple cells (wild type LANS4, n = 3; LANS4RLR, n = 4; LANS4RVH, n = 4).
Figure 5.
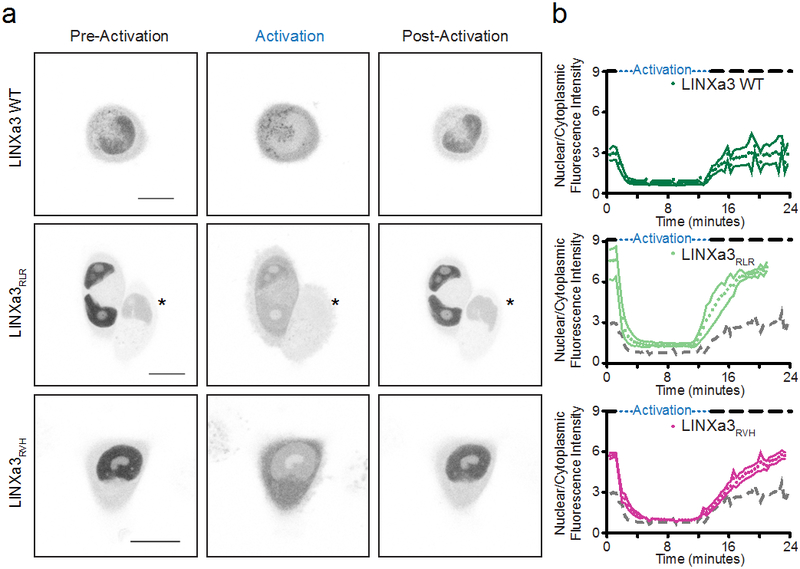
Control of protein localization with LINXa3. (a) Photoactivation of wild type LINXa, LINXa3RLR, or LINXa3RVH fused to fluorescent proteins in HeLa cells. Snapshots from before blue light exposure (pre-activation), after 10 minutes of blue light exposure (activation), and after 10 minutes of dark (post-activation) from activation of a field of cells over time (Supplementary Videos 4-6; scale bars are 15 μm). Asterisks indicate an adjacent cell out of plane and not used for quantification. (b) Quantification of nuclear/cytoplasmic fluorescence intensity change upon blue light activation (activations, n = 3). The dotted gray line is the LINXa3 WT mean for comparison. Mean ± s.e.m. was calculated from images of multiple cells (wild type LINXa3, n = 3; LINXa3RLR, n = 4; LINXa3RVH, n = 6).
For LINXa3, both mutants exhibited increased light to dark fold-change differences in nucleocytoplasmic distribution with respect to wild type: the wild type fold-change was 3.4 whereas the fold changes for RLR and RVH were 5.8 and 6.1, respectively (Figures 5a and 5b, Supplementary Videos 4-6, Supplementary Table 2). Both the RLR and the RVH mutants had higher nuclear localization pre- and post-activation (pre-activation nuclear/cytoplasmic fluorescence for WT = 2.9 ± 0.4, RLR = 7.6 ± 0.5, RVH = 5.7 ± 0.2; post-activation nuclear/cytoplasmic fluorescence for WT = 2.9 ± 0.8, RLR = 7.1 ± 0.1, RVH = 5.5 ± 0.4; WT n = 3, RLR n = 4, RVH n = 6; Figures 5b and 6b). However, neither LINXa3 mutant exhibited lower nuclear localization in the light than wild type, so the increased dynamic range for LINXa3 is due to better dark state caging.
Figure 6.
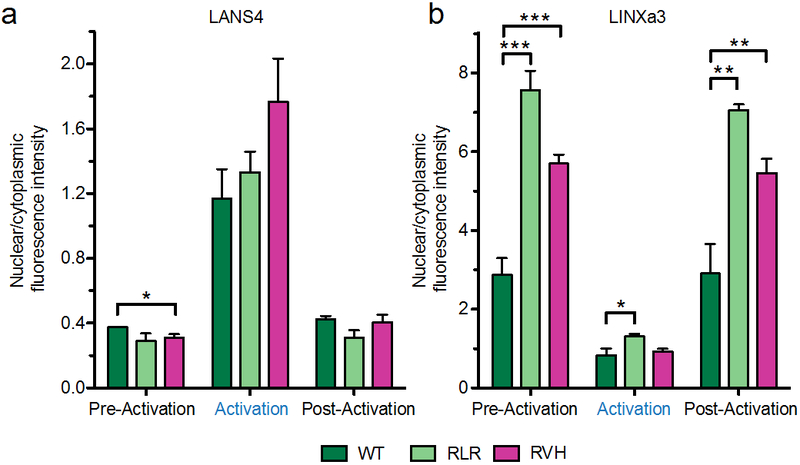
Quantification of protein localization using still images from LANS4 and LINXa3 activations. Comparison of nuclear/cytoplasmic distribution of wild type, RLR, and RVH variants in LANS4 (a) and LINXa3 (b) from pre-activation, activation, and post-activation frames quantified in Figures 4b and 5b. Mean ± s.e.m. was calculated from images of multiple activations and multiple cells as in Figures 4b and 5b. *P < 0.05, **P < 0.01, and ***P < 0.001 by unpaired two-tailed t-test.
For LANS4 and LINXa3 RLR and RVH mutants, images from both steady-state conditions and photoactivations indicate that dynamic ranges are significantly improved, though to varying degrees for each photoswitch.
LANS and LINX mutants demonstrate improved control over transcription.
To determine whether the LANS and LINX mutants improve control over the localization of a transcription factor in yeast, we fused the LANS4 and LINXa3 variants to a LexA DNA binding domain and a GAL4 activating domain. These fusion proteins were then tested in a yeast strain that contains the LexA binding site upstream of the β-galactosidase-encoding gene lacZ. Nuclear localization of the fusion protein resulted in production of β-galactosidase, which was monitored using a colorimetric assay. For LANS, better dark state caging was not observable as the wild type LANS4 already exhibited very low activity in the dark – both LANS4 variants exhibited low activity in the dark similar to that of wild type, but only the LANS4RVH mutant exhibited higher activity in the light over wild type (Figure 7a). For LINX, improved dark state caging of the NES results in more nuclear protein and hence higher activity in the dark. Both LINXa3 mutants exhibited higher activity in the dark over wild type, though the LINXa3RLR and LINXa3RVH mutants also exhibited higher activity than wild type in the light (Figure 7b). The dramatic increase in dark state activity for the LINXa3 variants results in higher light to dark fold-changes in activity with respect to wild type, where wild type fold-change is 8.1 and RLR and RVH fold-changes are 17.2 and 25.4, respectively. These data further suggest that the hinge-loop mutants significantly improve signal caging in the dark and thus increase the dynamic range of each of the photoswitches.
Figure 7.
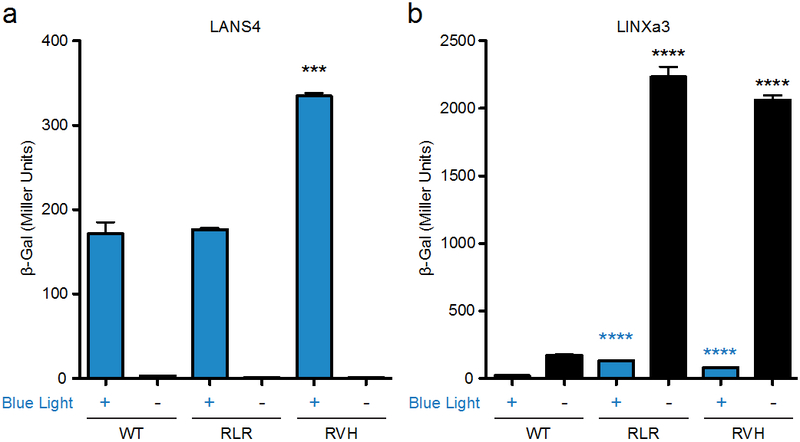
Control of gene transcription with LANS4 and LINXa3. β-galactosidase activity in the light (blue bars) or dark (black bars) induced with a GAL4 activation domain and LexA DNA binding domain fused to wild type, RLR, or RVH variants for LANS4 (a) or LINXa3 (b). (n = 3, mean ± s.e.m). **P < 0.01, ***P < 0.001, and ****P < 0.0001 by unpaired two-tailed t-test relative to wild type.
LINX mutants demonstrate improved control over histone modifications.
Next, we measured the ability of our LINX mutants to control the nucleocytoplasmic localization of Bre1, a histone E3 ubiquitin ligase in yeast. Bre1 monoubiquitylates histone H2B lysine 123 (H2Bub1), promoting transcriptional activation and elongation by RNA Polymerase II (RNA Pol II). H2Bub1 also facilitates methylation of histone H3 lysine 4 (H3K4) and histone H3 lysine 79 (H3K79)24–26. Previously, we measured the dynamics of H2BK123 monoubiquitylation and subsequent H3K4 and H3K79 trimethylation using LINXa4-Bre1, which was generated by fusing Bre1 to LINXa4 (a LINX variant with a weaker NLS than LINXa3 but with a larger dynamic range as demonstrated by the yeast transcription assay)10. Here, we generated the LINXa4-Bre1 fusion protein harbouring the RLR or RVH mutations and expressed them in a BRE1 deletion strain (bre1∆). We then grew cultures in either the dark or in blue light and determined the levels of the aforementioned histone modifications by immunoblot analysis. Levels of H2Bub1 in the dark state were increased in the RLR and RVH mutants, indicating that these mutations lead to increased nuclear localization in the dark, which suggests more effective caging of the NES in the dark (Figure 8). As expected given its weaker affinity for importin in the light, the LINXa4-Bre1 RLR mutant exhibited higher lit state H2Bub1 levels than the RVH mutant (Figure 8a). Importantly, there were no significant changes in the H3K4 and H3K79 trimethylation levels when comparing wild type and mutants in the dark or lit states, suggesting downstream effects of increased H2Bub1 may be limited (Supplementary Figure 4). Interestingly, we observed diminished H3K36 trimethylation in the lit state compared to the dark state in both the wild type and variant RVH for which the fold-change of H2Bub1 was highest between the lit and dark states (Supplementary Figure 4). The dependence of H3K36 trimethylation on H2Bub1 has only recently been described27. Since Bre1 promotes RNA Pol II transcription elongation and slow transcription rates alter H3K36 trimethylation profiles28, loss of Bre1 may lead to increased RNA Pol II dwell time, impacting co-transcriptionally-deposited histone modifications such as H3K36 trimethylation. This effect was particularly pronounced for the RVH mutant, demonstrating the importance of the improvements made in these optogenetic switches and their value for investigating signalling pathways.
Figure 8.
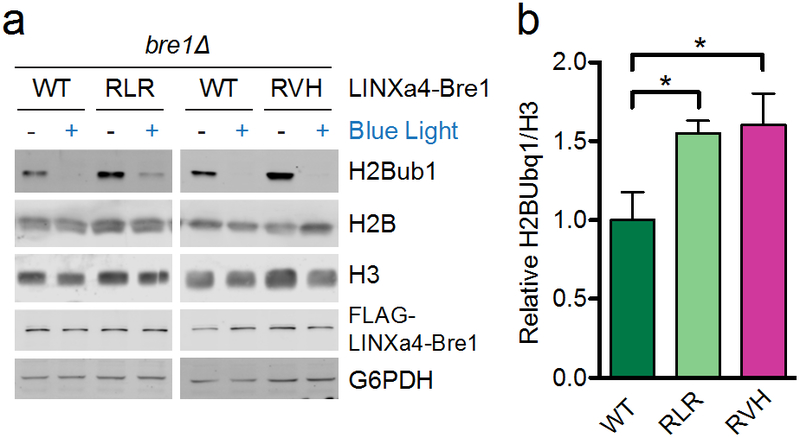
Control of histone H2B monoubiquitylation with LINXa4. (a) Immunoblots demonstrating light-mediated control of Bre1, an E3 ligase, in a BRE1 deletion strain (bre1∆) by fusing it to wild type LINXa4, LINXa4RLR, or LINXa4RVH. Asterisks indicate nonspecific bands. (b) Quantifications of dark state band intensities from replicate western blots as in (a); (n = 3, mean ± s.e.m.; see Supplementary Figure 4 for controls and replicate blots). *P < 0.05 by unpaired two-tailed t-test.
CONCLUSION
In this work, we characterized the effect of mutations in the hinge-loop region of LOV2 using our optogenetic nucleocytoplasmic shuttling photoswitches. We measured the affinity of the original LANS and two LANS hinge mutants, namely RLR and RVH, to importin after blue light exposure and after dark-induced reversion and found that binding affinities shifted toward weaker binding for the RLR mutant and were similar to the original for the RVH mutant. Using confocal microscopy, we visualized localization of LANS and LINX hinge mutants in mammalian cells in steady-state conditions and in real time photoactivation, noting increased dark state caging and hence a shift in dynamic ranges with respect to the original LANS and LINX systems. We confirmed these results using a β-Galactosidase assay to show decreased off-state activity in control of transcription using LINX. Finally, we used LINX harbouring the aforementioned mutations to demonstrate more robust control of epigenetic modifications to histone tails by light-dependent export of the E3 ubiquitin ligase Bre1 to control H2Bub1 levels. Further, by serendipity we uncovered the role temperature plays in the functionality of LOV2 photoswitches in vitro by linking increased temperature to diminished dynamic range. This observation may explain previous discrepancies and provide an important basis for the design of optogenetic experiments.
Across our in-cell assays we noted an improved dynamic range for our mutants relative to wild type, though these improvements were not entirely consistent with our binding assay. For the RLR mutant, the weaker binding observed in the in vitro binding assay in the dark and the light were consistent with the subsequent in vivo experiments demonstrating improved dark state caging and a generally right-shifted dynamic range. For the RVH mutant, the similarity between WT and mutant binding affinities are not consistent with the subsequent in vivo experiments in which the RVH mutant also demonstrates improved dark state caging.
In sum, we have identified the hinge-loop region as a significant determinant of dynamic range for LANS and LINX, improving on previous designs and offering new tools for interrogation of dynamic biological processes. Though we have only tested these mutations in the LANS and LINX systems, they are in a region not commonly mutated during the engineering of similar photoswitches. Furthermore, they are found in photoswitches optimized through directed evolution such as the iLID and FLARE systems19,20. Thus, we hypothesize that the hinge-loop mutations are likely to be applicable to other LOV2-based switches and will allow for improved spatial and temporal control of a variety of cellular processes.
METHODS
Reagents
Antibodies: H2Bub1 (CST 55465; 1,5000), H2B (Active Motif 39237; 1:5,000), H2BK79me3 (Abcam 2621; 1:3,000), H2BK79me2 (Active Motif 39143; 1:3,000), H3K4me3 (EpiCypher 13–0004; 1:5,000), H3K36me3 (Abcam 9050, 1:2,000), H3 (CST 1B1B2; 1:2,000), FLAG (Sigma Aldrich F1804; 1:3,000), G6PDH (Sigma Aldrich A9521; 1:100,000). Rabbit (Thermo SA5–10044, Donkey anti-Rabbit DyLight 800) and mouse (Thermo 35518, Goat anti-mouse DyLight 680) secondary antibodies were used at 1:10,000.
DNA Cloning
Both LANS and LINX plasmids are derived from the same codon optimized gene. All plasmids in this study were generated by amplifying the respective LOV2 construct in two fragments with overlaps, which introduced the respective mutations. Then, the two fragments were assembled and cloned into the parent plasmid via restriction digest cloning. To provide a concrete example we will detail how the RLR hinge variant plasmids used for the in vitro characterization via fluorescence polarization was generated from the original wild type LANS plasmid8. First, two fragments were amplified with Q5 polymerase (NEB) for 15 PCR cycles using the following pairs - pQE-80L forward sequencing primer and the RLRD_rev (Supplementary Table 3) as well as RLRD_for and pQE-80L reverse sequencing primer. The resulting PCR products were cleaned up with the NucleoSpin PCR clean-up kit (Macherey-Nagel) according to the manufacturer’s protocol. The two amplified fragments (2 µl each) were then assembled with Q5 polymerase with a PCR reaction without primers. Finally, 5 µl of the previous reactions were used as a template for a PCR amplification reaction with Q5 polymerase using the pQE-80L forward and reverse sequencing primers. The resulting DNA product was cleaned up with the NucleoSpin kit and cloned via restriction digest cloning using BamHI and HindIII restriction sites into its parental vector. The remaining plasmids were generated in a similar fashion using their respective vector-specific and mutant-specific primer pairs. All plasmids were sequence verified (Eurofins).
Protein Purification
Expression and purification were similar to methods described previously8. For the LANS proteins, the BL21 Star bacteria transformed with each plasmid were grown in 1.5 L of LB media. Protein expression was induced with 660 μM IPTG once the OD600 reached ~0.6–0.8 and cultures were grown overnight (18–20 hours) at 25°C and pelleted. Cell pellets were resuspended and lysed in 40 mL of Resuspension buffer (50 mM Tris pH 7.5, 150 mM NaCl, 10 mM Imidazole, 5 mM β-ME) supplemented with 250 μm PMSF and 40 μL (80 U) DNase I (NEB). Cells were sonicated on ice for 4 minutes (5 seconds on, 5 seconds off) then further lysed with 3 cycles of homogenization using EmulsiFlex-C3 (Avestin). The filtered supernatant was mixed with 3 mL His60 Ni Superflow Resin (Takara) and incubated overnight at 4°C for batch binding. The nickel column purification was carried out at 4°C: the column was first washed with 20 CV of Resuspension buffer, then with 20 CV of 50 mM Tris pH 7.5, 1 M NaCl, 30 mM Imidazole, and 5 mM β-ME; protein was eluted with 2 CV of 50 mM Tris pH 7.5, 50 mM NaCl, 500 mM Imidazole, and 5 mM β-ME, then concentrated using a 10 kDa Amicon Ultra-15 (Millipore) concentrator and subjected to size exclusion chromatography (SEC) in 50 mM Tris pH 7.5, 150 mM NaCl, 1 mM DTT on a HiLoad 16/600 Superdex 200 (GE Healthcare) column. For importin α7, following lysis and homogenization, the protein was immediately purified over a His60 Ni Superflow Resin column after only two hours of batch binding at 4°C and then dialyzed against 50 mM Tris pH 7.5, 50 mM NaCl, and 1 mM DTT for overnight at 4°C. The protein was then purified over three 5 mL HiTrap Q HP columns (GE Healthcare) and eluted over a linear gradient against 50 mM Tris pH 7.5, 1 M NaCl, 1 mM DTT. The protein was then concentrated to 2 mL and subjected to two rounds of SEC: HiLoad 16/600 Superdex 200 pg (GE Healthcare) followed by HiLoad 16/600 Superdex 75 pg (GE Healthcare) in 50 mM Tris pH 7.5, 150 mM NaCl, 1 mM DTT.
Fluorescence Polarization
Binding assays were performed as described previously8,13,29. The binding affinity of importin α7 for NLS peptide was established by titrating importin α7 from 0 to 10 μM into a 3 mL solution of 25 nM TAMRA-labelled NLS peptide. The competitive binding experiment was modified such that the LANS proteins were titrated from 0 to up to 100 μM into a 3 mL solution of 25 nM TAMRA-labelled NLS peptide and 1 μM importin α7 in 3 mL of 50 mM Tris pH 7.5, 150 mM NaCl, 1 mM DTT. In order to decrease the time for measuring polarization to less than 15 seconds, the G-factor (HV/HH) of just the TAMRA-labelled NLS peptide in solution was measured at the start of each experiment. The resulting G-factor was then “specified” for the subsequent polarization measurements. The concentrated titrant protein was kept on ice whereas the quartz cuvette was incubated at either 25°C (Figure 2 and Supplementary Figure 2), 20°C, or 25°C (Supplementary Figure 3) for the duration of the titration. In the case where the temperature was not controlled (Supplementary Figure 3), the water bath was turned off and the G-factor was not “specified” – to best replicate previous experimental methods. For each LANS titration point two polarization readings were taken, the first after illuminating the sample with blue light and the second after LANS had equilibrated to the dark state. The lit state polarization was measured after 2 minutes of continuous 6.0 mW/cm2 blue light exposure (455 nm) from a collimated blue LED (THORLABS, product number M455L2). After the two minutes of illumination, the LED was turned off and a polarization reading was taken immediately (excitation wave length = 555 nm, emission wave length = 584 nm). Since the half-life for the activated state of the LOV2 domain is ~30 seconds, this polarization reading captured the sample in the activated state. This “lit state” measurement was obtained with the blue light turned off because we observed that the light from the LED interfered with the polarization measurement. After the lit state measurement, the sample was equilibrated for 5 minutes in the dark and the polarization was measured again. The competitive binding data were fit using an adaptation of an iterative numeric fitting program30.
Mammalian Cell Culture and Transfections
HeLa (ATCC) cells were grown in Dulbecco’s Modified Eagle Medium (DMEM) supplemented with 10% (v/v) Fetal Bovine Serum (FBS) and a 1% (v/v) Penicillin/Streptomycin mix and incubated in 5% CO2 at 37°C. Cells were routinely passaged every 2–3 days. Cells were transiently transfected with individual vectors in six-well cell culture dishes using 1 μg of total DNA using Lipofectamine 2000 (Invitrogen) transfection reagent, as recommended by the manufacturer. After 24 hours transfected cells were trypsinized and transferred to 3.5 cm MatTek glass bottom dishes (No. 1.5) pre-coated with collagen. After 24 hours, the medium was removed and replaced with Ham’s F-12K (Caisson) medium lacking Phenol red containing 1% FBS.
Mammalian Cell Imaging
For steady-state images, cells were imaged with an Olympus FV1000 confocal microscope equipped with a PlanApo 60x/1.42 oil immersion objective. The 559 nm laser line was used to collect an 800 × 800 pixel image with an optical section of 1.0 μm. For photoactivations, cells were imaged and photo-activated with a Zeiss 880 LSM confocal microscope equipped with an EC Plan-Neofluar 40x/1.3 Oil DIC M27 objective. Image acquisition consisted of rasterizing 1024 × 1024 pixels while using 561 nm laser emission for mCherry excitation and simultaneous 488 nm laser emission (0.2% intensity of a 10 mW diode laser) being toggled for the photo-activation, with a pixel dwell time of 0.38 μs/pixel. Three images with an optical section of 1.1 μm were taken at 0.53 μm intervals throughout the duration of each time series (varying from 23 to 27 second intervals between each set of z-stack images). For WT LANS4 and LINXa3, 3 image stacks were acquired pre-activation, 50 were acquired during the activation and 50 were acquired post-activation. For mutants, 3 image stacks were acquired pre-activation, 25 were acquired during the activation and 25 were acquired post-activation. All other acquisition and activation parameters remained constant between samples.
Mammalian Cell Quantification
Images were analysed and videos were prepared using Fiji software31 and statistical analysis was performed using GraphPad Prism software. For activations, individual optical sections for each frame of the image series were assembled into maximum intensity z-projections. For still images and for each frame of the time series for activated cells, the fluorescence intensity was measured in elliptical regions of interest of the same size and shape in the nucleus and just outside the nucleus. The nuclear to cytoplasmic ratio was calculated using these fluorescence intensities and plotted over time. The one phase association equation Y = Y0 + (plateau – Y0)*(1 – e-kx) was used to fit values corresponding to activation for LANS4 and reversion for LINXa3, whereas the one phase decay equation Y = (Y0 – plateau)*exp(−K × X) + plateau was used to fit values corresponding to activation for LINXa3 and reversion for LANS4.
Yeast Transcription
Overnight cultures of an NMY51 strain (gift from C. Tucker, University of Colorado School of Medicine) were transformed with WT, RLR, or RVH plasmids for either LANS4 or LINXa3 and subsequently plated on SC-Leucine plates that were then incubated at 30° C in the dark. In the morning, cell density was measured at OD600 and cultures were diluted in SC-Leucine to a final volume of 2.0 mL and final OD600 of 0.2 in duplicate. Duplicate samples were either wrapped in aluminum foil or exposed to 500 W/cm2 blue light (465 nm emitted from an LED strip light wrapped around the base of the tube rack) and grown for 4 hours in the same incubator at 30°C, after which each sample was pelleted in triplicate and a β-Galactosidase assay using CPRG as substrate was performed as recommended by the manufacturer (Clontech).
Western Blotting
Overnight cultures of a bre1Δ strain were transformed with LINX-Bre1 WT, RLR, or RVH and subsequently plated on SC-Leucine plates that were then incubated at 30° C in the dark. Colonies were resuspended in SC-Leucine, split into light and dark cultures and placed in the same incubator overnight at 30°C: dark cultures were wrapped in foil and light cultures were exposed to 500 W/cm2 blue light (465 nm emitted from an LED strip light wrapped around the base of the tube rack). In the morning cell density was measured at OD600 and cultures were diluted in SC-Leucine to a final volume of 5.5 mL and final OD600 of 0.35. Cultures were then grown at 30° C in the same light conditions for 4.5 hours, after which OD600 was measured and 4 OD600 units of each asynchronous log phase culture were collected in the appropriate volume of 100% TCA (Sigma, 100% w/v) to obtain a final concentration of 20% TCA, mixed vigorously and centrifuged at 5k RPM. Supernatants were aspirated and pellets were frozen at −80°C. After freezing, samples were resuspended in TCA buffer (10 mM Tris, pH 8.0, 10% TCA, 25 mM NH4OAc, 1 mM Na2EDTA), mixed and placed on ice for 10 minutes. Cells were collected by centrifugation, resuspended in Resuspension buffer (0.1 M Tris, pH 11.0, 3% SDS) and boiled at 95°C for 10 minutes. Extracts were clarified by centrifugation, protein was quantified by the DC assay and samples were diluted to equivalent concentrations using Resuspension buffer and further diluted using 2x SDS Loading Buffer (60 mM Tris pH 6.8, 2% SDS, 10% glycerol, 0.2% bromophenol blue, 100 mM DTT added fresh). 10 uL of whole cell extracts were loaded on 15% SDS-PAGE gels. Proteins were transferred to 0.45 μm PVDF membranes (Millipore Sigma Immobilon-FL) using a Hoefer Semi-Dry Transfer Apparatus at 45 mA per membrane. Primary antibodies were incubated in Odyssey blocking buffer at 4°C overnight and secondary antibodies were incubated in Odyssey blocking buffer with 0.015% SDS for 1 hour.
Western Blot Quantification
Data for band intensities for H2Bub1, H2B, and H3 were extracted using Image Studio Lite. Local background was subtracted and ubiquitylation intensities were divided by H3 intensities. To obtain relative abundance the LINX-Bre1 WT samples were used as a reference for the mutants. Relative abundances were plotted using GraphPad Prism 5 and statistical significance was calculated using unpaired two-tailed student’s t-test (p < 0.05).
Supplementary Material
ACKNOWLEDGEMENTS
This work was supported by the NIH (R01DA036877, R35GM126900, and F31GM122321). We thank Mitch Butler and other members of the Bear lab for technical assistance with microscopy.
ABBREVIATIONS
- FLARE
Fast Light- and Activity-Regulated Expression
- G6PDH
Glucose-6-phosphate dehydrogenase
- H2B
Histone H2B
- H2Bub1
Histone H2B lysine 123 monoubiquitination
- H3
Histone H3
- H3K4me3
Histone H3 lysine 4 trimethylation
- H3K36me3
Histone H3 lysine 36 trimethylation
- H3K79me3
Histone H3 lysine 79 trimethylation
- H3K79me2
Histone H3 lysine 79 dimethylation
- iLID
improved light inducible dimer
- Jα helix
LOV2 domain C-terminal helix
- LANS
Light Activated Nuclear Shuttle
- LANSRLR
variant incorporating HVR to RLR mutations in residues 519–521
- LANSRVH
variant incorporating HVR to RVH mutations in residues 519–521
- LINX
Light Induced Nuclear Export
- LINXRLR
variant incorporating HVR to RLR mutations in residues 519–521
- LINXRVH
variant incorporating HVR to RVH mutations in residues 519–521
- LOV2
Light Oxygen Voltage 2
- RLR
LOV2 residues 519–521 HVR to RLR mutant
- RVH
LOV2 residues 519–521 HVR to RVH mutant
- WT
wild type
REFERENCES
- (1).Liu Q, and Tucker CL (2017) Engineering genetically-encoded tools for optogenetic control of protein activity. Curr. Opin. Chem. Biol 40, 17–23. [DOI] [PMC free article] [PubMed] [Google Scholar]
- (2).Kim CK, Adhikari A, and Deisseroth K (2017) Integration of optogenetics with complementary methodologies in systems neuroscience. Nat. Rev. Neurosci 18, 222–235. [DOI] [PMC free article] [PubMed] [Google Scholar]
- (3).Di Ventura B, and Kuhlman B (2016) Go in! Go out! Inducible control of nuclear localization. Curr. Opin. Chem. Biol 34, 62–71. [DOI] [PMC free article] [PubMed] [Google Scholar]
- (4).Crefcoeur RP, Yin R, Ulm R, and Halazonetis TD (2013) Ultraviolet-B-mediated induction of protein-protein interactions in mammalian cells. Nat. Commun 4, 1779. [DOI] [PubMed] [Google Scholar]
- (5).Yang X, Jost AP-T, Weiner OD, and Tang C (2013) A light-inducible organelle-targeting system for dynamically activating and inactivating signaling in budding yeast. Mol. Biol. Cell 24, 2419–30. [DOI] [PMC free article] [PubMed] [Google Scholar]
- (6).Beyer HM, Juillot S, Herbst K, Samodelov SL, Müller K, Schamel WW, Römer W, Schäfer E, Nagy F, Strähle U, Weber W, and Zurbriggen MD (2015) Red Light-Regulated Reversible Nuclear Localization of Proteins in Mammalian Cells and Zebrafish. ACS Synth. Biol 4, 951–958. [DOI] [PubMed] [Google Scholar]
- (7).Niopek D, Benzinger D, Roensch J, Draebing T, Wehler P, Eils R, and Di Ventura B (2014) Engineering light-inducible nuclear localization signals for precise spatiotemporal control of protein dynamics in living cells. Nat. Commun 5, 4404. [DOI] [PMC free article] [PubMed] [Google Scholar]
- (8).Yumerefendi H, Dickinson DJ, Wang H, Zimmerman SP, Bear JE, Goldstein B, Hahn K, and Kuhlman B (2015) Control of protein activity and cell fate specification via light-mediated nuclear translocation. PLoS One 10, e0128443. [DOI] [PMC free article] [PubMed] [Google Scholar]
- (9).Niopek D, Wehler P, Roensch J, Eils R, and Di Ventura B. (2016) Optogenetic control of nuclear protein export. Nat. Commun 7, 10624. [DOI] [PMC free article] [PubMed] [Google Scholar]
- (10).Yumerefendi H, Lerner AM, Zimmerman SP, Hahn KM, Bear JE, Strahl BD, and Kuhlman B (2016) Light-induced nuclear export reveals rapid dynamics of epigenetic modifications. Nat. Chem. Biol 12, 399–401. [DOI] [PMC free article] [PubMed] [Google Scholar]
- (11).Harper SM, Neil LC, and Gardner KH (2003) Structural basis of a phototropin light switch. Science 301, 1541–1544. [DOI] [PubMed] [Google Scholar]
- (12).Zayner JP, Antoniou C, and Sosnick TR (2012) The amino-terminal helix modulates light-activated conformational changes in AsLOV2. J. Mol. Biol 419, 61–74. [DOI] [PMC free article] [PubMed] [Google Scholar]
- (13).Lungu OI, Hallett R. a, Choi EJ, Aiken MJ, Hahn KM, and Kuhlman B (2012) Designing photoswitchable peptides using the AsLOV2 domain. Chem. Biol 19, 507–517. [DOI] [PMC free article] [PubMed] [Google Scholar]
- (14).Chook YM, and Süel KE (2011) Nuclear import by karyopherin-βs: Recognition and inhibition. Biochim. Biophys. Acta 1813, 1593–1606. [DOI] [PMC free article] [PubMed] [Google Scholar]
- (15).Hutten S, and Kehlenbach RH (2007) CRM1-mediated nuclear export: to the pore and beyond. Trends Cell Biol. 17, 193–201. [DOI] [PubMed] [Google Scholar]
- (16).Yumerefendi H, Wang H, Dickinson DJ, Lerner AM, Malkus P, Goldstein B, Hahn K, and Kuhlman B (2018) Light-Dependent Cytoplasmic Recruitment Enhances the Dynamic Range of a Nuclear Import Photoswitch. ChemBioChem 19, 1319–1325. [DOI] [PMC free article] [PubMed] [Google Scholar]
- (17).Strickland D, Yao X, Gawlak G, Rosen MK, Gardner KH, and Sosnick TR (2010) Rationally improving LOV domain-based photoswitches. Nat. Methods 7, 623–626. [DOI] [PMC free article] [PubMed] [Google Scholar]
- (18).Strickland D, Lin Y, Wagner E, Hope CM, Zayner J, Antoniou C, Sosnick TR, Weiss EL, and Glotzer M (2012) TULIPs: Tunable, light-controlled interacting protein tags for cell biology. Nat. Methods 9, 379–384. [DOI] [PMC free article] [PubMed] [Google Scholar]
- (19).Guntas G, Hallett RA, Zimmerman SP, Williams T, Yumerefendi H, Bear JE, and Kuhlman B (2015) Engineering an improved light-induced dimer (iLID) for controlling the localization and activity of signaling proteins. Proc. Natl. Acad. Sci 112, 112–117. [DOI] [PMC free article] [PubMed] [Google Scholar]
- (20).Wang W, Wildes CP, Pattarabanjird T, Sanchez MI, Glober GF, Matthews GA, Tye KM, and Ting AY (2017) A light- and calcium-gated transcription factor for imaging and manipulating activated neurons. Nat. Biotechnol 35, 864–871. [DOI] [PMC free article] [PubMed] [Google Scholar]
- (21).Iwata T, Nozaki D, Tokutomi S, Kagawa T, Wada M, and Kandori H (2003) Light-induced structural changes in the LOV2 domain of Adiantum phytochrome3 studied by low-temperature FTIR and UV-visible spectroscopy. Biochemistry 42, 8183–8191. [DOI] [PubMed] [Google Scholar]
- (22).Nozaki D, Iwata T, Tokutomi S, and Kandori H (2005) Unique temperature dependence in the adduct formation between FMN and cysteine S-H group in the LOV2 domain of Adiantum phytochrome3. Chem. Phys. Lett 410, 59–63. [Google Scholar]
- (23).Harper SM, Christie JM, and Gardner KH (2004) Disruption of the LOV-Jα helix interaction activates phototropin kinase activity. Biochemistry 43, 16184–16192. [DOI] [PubMed] [Google Scholar]
- (24).Dover J, Schneider J, Tawiah-Boateng MA, Wood A, Dean K, Johnston M, and Shilatifard A (2002) Methylation of histone H3 by COMPASS requires ubiquitination of histone H2B by Rad6. J. Biol. Chem 277, 28368–28371. [DOI] [PubMed] [Google Scholar]
- (25).Ng HH, Xu RM, Zhang Y, and Struhl K (2002) Ubiquitination of histone H2B by Rad6 is required for efficient Dot1-mediated methylation of histone H3 lysine 79. J. Biol. Chem 277, 34655–34657. [DOI] [PubMed] [Google Scholar]
- (26).Xiao T, Kao C, Krogan NJ, Sun ZW, Greenblatt JF, Osley MA, and Strahl BD (2005) Histone H2B ubiquitylation is associated with elongating RNA Polymerase II. Mol. Cell. Biol 25, 637–651. [DOI] [PMC free article] [PubMed] [Google Scholar]
- (27).Vlaming H, Molenaar TM, van Welsem T, Poramba-Liyanage DW, Smith DE, Velds A, Hoekman L, Korthout T, Hendriks S, Maarten Altelaar AF, and van Leeuwen F (2016) Direct screening for chromatin status on DNA barcodes in yeast delineates the regulome of H3K79 methylation by Dot1. Elife 5, e18919. [DOI] [PMC free article] [PubMed] [Google Scholar]
- (28).Fong N, Saldi T, Sheridan RM, Cortazar MA, and Bentley DL (2017) RNA Pol II dynamics modulate co-transcriptional chromatin modification, CTD phosphorylation, and transcriptional direction. Mol. Cell 66, 546–557. [DOI] [PMC free article] [PubMed] [Google Scholar]
- (29).Zimmerman SP, Kuhlman B, and Yumerefendi H (2016) Engineering and application of LOV2-based photoswitches. Methods Enzymol. 580, 169–190. [DOI] [PMC free article] [PubMed] [Google Scholar]
- (30).Purbeck C, Eletr ZM, and Kuhlman B (2010) Kinetics of the transfer of ubiquitin from UbcH7 to E6AP. Biochemistry 49, 1361–1363. [DOI] [PubMed] [Google Scholar]
- (31).Schindelin J, Arganda-Carreras I, Frise E, Kaynig V, Longair M, Pietzsch T, Preibisch S, Rueden C, Saalfeld S, Schmid B, Tinevez JY, White DJ, Hartenstein V, Eliceiri K, Tomancak P, and Cardona A (2012) Fiji: An open-source platform for biological-image analysis. Nat. Methods 9, 676–682. [DOI] [PMC free article] [PubMed] [Google Scholar]
Associated Data
This section collects any data citations, data availability statements, or supplementary materials included in this article.


