

Abstract
Background
Intrauterine growth retardation (IUGR) is related to pulmonary artery hypertension in adults, and microRNA‐206 (miR‐206) is proposed to affect the proliferation and apoptosis of pulmonary artery smooth muscle cells (PASMCs) via post‐transcriptional regulation.
Methods and Results
In an IUGR rat model, we found that the expression and function of potassium voltage‐gated channel subfamily A member 5 (Kv1.5) in PASMCs was inhibited, and pulmonary artery hypertension was exaggerated after chronic hypoxia (CH) treatment as adults. microRNA expression was investigated in PASMCs from 12‐week‐old male IUGR rats with CH by microarray, polymerase chain reaction, and in situ hybridization. The expression levels of Kv1.5 in primary cultured PASMCs and pulmonary artery smooth muscle from IUGR or control rats were evaluated with and without application of an miR‐206 inhibitor. Right ventricular systolic pressure, cell proliferation, luciferase reporter assay, and IK v were also calculated. We found increased expression of miR‐206 in resistance pulmonary arteries of IUGR rats at 12 weeks compared with newborns. Application of an miR‐206 inhibitor in vivo or in vitro increased expression of Kv1.5 α‐protein and KCNA5. Also, decreased right ventricular systolic pressure and cell proliferation were observed in PASMCs from 12‐week‐old control and IUGR rats after CH, while inhibitor did not significantly affect control and IUGR rats.
Conclusions
These results suggest that expression of Kv1.5 and 4‐aminopyridine (Kv channel special inhibitor)‐sensitive Kv current were correlated with the inhibition of miR‐206 in PA rings of IUGR‐CH rats and cultured IUGR PASMCs exposed to hypoxia. Thus, miR‐206 may be a trigger for induction of exaggerated CH–pulmonary artery hypertension of IUGR via Kv1.5.
Keywords: epigenetics, K‐channel, Kv1.5, microRNA, microRNA‐206, PAH, PASMCs, pulmonary hypertension
Subject Categories: Pulmonary Hypertension
Clinical Perspective
What Is New?
This study is the first to provide evidence that microRNA‐206 (miR‐206) promotes pulmonary artery smooth muscle cells proliferation and induces pulmonary artery dysfunction and exaggerated pulmonary artery hypertension via effects on Kv1.5 in adults in an intrauterine growth retardation rat model with chronic hypoxia.
This study is the first time to use miR‐206 inhibitor gene transfer via airway nebulization in vivo to alter miR‐206 expression in pulmonary artery smooth muscle cells of the chronic hypoxia–pulmonary artery hypertension rat model following intrauterine growth retardation.
What Are the Clinical Implications?
It is significant that the overexpression of miR‐206 in an intrauterine growth retardation rat model is associated with downregulation of Kv1.5, exaggerated pulmonary artery hypertension, pulmonary artery remodeling, and pulmonary artery smooth muscle cells dysfunction.
This study reveals that miR‐206 may serve as a clinical biomarker to facilitate early diagnosis and that miR‐206 inhibition may be an effective therapeutic option for pulmonary artery remodeling and pulmonary artery hypertension.
Introduction
Intrauterine growth retardation (IUGR) has been found to be associated with the later occurrence of many adult diseases, such as metabolic disease and hypertension. We have previously shown that more severe hypoxia‐induced pulmonary artery hypertension (PAH) in adults is related to IUGR occurrence.1, 2 PAH is a serious disease characterized by pulmonary vasoconstriction and excessive proliferation of pulmonary artery smooth muscle cells (PASMCs), leading to structural remodeling of blood vessel walls. Though several pharmacotherapies are reasonably efficacious for the treatment of PAH, this disease is still associated with high mortality (5‐year survival rates ranging from 34% to 58%).3 Furthermore, the exaggerated pulmonary arterial pressure following IUGR may increase mortality due to PAH after chronic hypoxia (CH).
Epigenetic mechanisms contribute to adult diseases that are associated with IUGR.4 microRNAs (miRNAs) comprise a class of 18 to 25‐bp small‐molecule RNAs that are highly conserved, do not encode proteins, and mediate many key pathways involved in regulating cell growth processes.5, 6 These molecules usually combine with the 3′‐untranslated region (UTR) of mRNA to suppress translation initiation. miR‐206 is a member of the miR‐1 family, which includes miR‐1, miR‐133, and miR‐206 and has been shown to be muscle‐specific. These miRs play a critical role in myogenesis and cell proliferation7, 8; however, the role of the miR‐1 family molecules in hypoxia‐induced PAH is still unclear.
Recently, studies demonstrated the downregulation of miR‐206 under CH via effects on Hif‐1α and Notch3 in PASMCs as well as in animal models.9, 10 As we previously found, the potassium voltage‐gated channel subfamily A member 5 (Kv1.5) appears to be a potential molecular target of IUGR‐enhanced chronic hypoxia‐induced PAH (CH‐PAH).1 It is therefore of great interest to characterize the mechanisms that mediate these effects and determine whether epigenetic mechanisms, such as those involving miR‐206, directly regulate Kv1.5.
In this study, we described an miRNA screen to identify effects of intrauterine malnutrition on small RNA expression in IUGR rats at adulthood. Epigenomic profiling in pulmonary artery (PA) tissue identified changes in miR‐206 expression between IUGR and control PASMCs. We then found that expression of Kv1.5 and 4‐aminopyridine (Kv channel special inhibitor)‐sensitive Kv currents were correlated with the inhibition of miR‐206 in PA rings of IUGR rats and cultured PASMCs exposed to hypoxia. These results suggest that miR‐206 may induce exaggerated CH‐PAH following IUGR via Kv1.5 and may have implications for diagnosis and therapy in the future.
Methods
The data, analytic methods, and study materials will be made available to other researchers for purposes of reproducing the results. Material will be available from the Department of Neonatology, the Children's Hospital, Zhejiang University School of Medicine, which is responsible for maintaining availability. All animal experiments were performed in accordance with currently prescribed guidelines under a protocol approved by the Institutional Animal Care and Use Committee at Zhejiang University and performed in accordance with the National Institutes of Health guidelines (NIH Publication No. 85‐23, revised 1996).
The randomization was used to assign the rats and cells to groups and the technicians of polymerase chain reaction (PCR), western blot, fluorescent in situ hybridization (FISH), histologic and morphometric measurements, psychology tests, electrophysiology tests, EdU tests, and luciferase tests were blinded.
Rat Model of IUGR and CH‐PAH
We established the IUGR rat model and CH‐PAH rat model in our previous studies.1 Only male offspring were studied to avoid hormonal cycle disturbances. Offspring of nonrestricted mothers were labeled as control rats; offspring of food‐restricted mothers (with a birth weight <5.8 g) were labeled as IUGR rats.1 After 2 weeks under hypoxic conditions, offspring rats (14 weeks of age) were randomly assigned to four groups: control (CON), control‐hypoxia (CON‐CH), IUGR, and IUGR‐hypoxia (IUGR‐CH). To raise the comparison ability of the results, all the experiments follow the principle of random control and double‐blind.
RNA Extraction and Quantitative Real‐Time Polymerase Chain Reaction
Resistance PA rings with diameters between 180 and 220 μm were dissected from the lungs of rats under the anatomic microscope. Samples were ground with a liquid N2‐cooled mortar and pestle. Total RNA for microarray analysis was extracted from the PA ring powder using Trizol. Because of the stem loop structures of the miRNA primers, only mature miRNA molecules were amplified into cDNA using fluorescently labeled Taqman probes and primer sets with a 7500HT Fast Real‐Time PCR device (Applied Biosystems, Foster City, CA). Fold‐change of RNA species was calculated using the formula 2−ΔΔCt. The housekeeping gene glyceraldehyde 3‐phosphate dehydrogenase was used as an mRNA reference control. The small RNA U6 was used as a reference control for miRNA quantification.
Microarray Hybridization
Total RNA (50 μg) was fluorescently labeled at 37°C for 15 minutes and at 25°C for 30 minutes with T4 RNA ligase. Flash Tag–labeled samples were hybridized to Affymetrix 3.0 microarrays at 48°C for 16 hours. Microarrays were then washed as previously described and scanned using a Gene Chip Scanner 3000 (Thermo Fisher Scientific, Waltham, MA).7 Then, quantitative real‐time polymerase chain reaction was used to verify the identified changes in miRNA.
In Silico Analysis for miR Target Prediction
The analysis of target gene prediction was completed using the TargetScan5. The 3′‐UTR of the KCNA5 gene was screened as the presence of miRNA response elements from TargetScanHuman and miRanda sites.
Hemodynamic, Histologic, and Morphometric Measurements
Right ventricular systolic pressure (RVSP) was measured to reflect the pressure of the PA as described previously.11 systolic blood pressure (SBP; mean artery pressure) and heart rate were measured as described previously.12
Immunohistochemical staining of α‐smooth muscle actin was performed as reported previously.11 In each artery (n=2–5/animal), we measured the outer perimeter of each vessel and the medial area occupied by smooth muscle (α‐smooth muscle actin positive). The ratio was calculated to assess vascular dysfunction using Image Pro Plus software 5.0 (Media Cybernetics, Rockville, MD).
Fluorescent In Situ Hybridization
The protocol for in situ hybridization for miRNA detection was based on a prior report.13 Specifically, 5‐μm sagittal lung sections were probed using a 3′‐fluorescein isothiocyanate–labeled miRCURY LNA rno‐miR‐206 detection probe (100 nmol/L; Exiqon, Vedbaek, Denmark). The miRCURY LNA U6 probe was used as a control. Probe (50 nmol/L LNA probe) annealing was performed in hybridization buffer (H7782; Sigma‐Aldrich, St Louis, MO) for 16 hours at 62°C. Following serial washes and inactivation of endogenous peroxide activity (3% hydrogen peroxide, 30 minutes at 25°C), immunolabeling was performed with an anti–3′‐fluorescein isothiocyanate horseradish peroxidase–conjugated secondary antibody for 1 hour at 25°C (1:100; DAKO, Carpinteria, CA). For detection, tyramide amplification was performed with the Individual Indirect Tyramide Reagent (PerkinElmer), and positive staining was evident by a green color. Nuclei were visualized with DAPI (Roche). The miR‐206 expression was quantified in the vascular wall of 10 to 15 resistance PAs (<100‐μm external diameter) in rats. Data are expressed as arbitrary units.
In Vivo Gene Delivery to the Lung
Rats were anesthetized with pentobarbital sodium (50 mg/kg body weight, intraperitoneally) and intubated orotracheally with PE240 polyethylene tubing during tracheal transillumination. While breathing spontaneously, ≈25 μL (0.5 mg/kg) of Anti‐miR miR‐206 inhibitor in Invivofectamine 3.0 (Thermo Fisher Scientific) compounds were nebulized to CON‐Anti206, IUGR‐ Anti206, CON‐CH‐Anti206, and IUGR‐CH‐ Anti206 rats using an intratracheal microspray device placed in the distal endotracheal tube.11 Nebulized Invivofectamine 3.0 reagent with sterile saline was used as a negative control (≈25 μL) in the CON, IUGR, CON‐CH, and IUGR‐CH rats. Rats were allowed to recover from anesthesia for 24 hours before return to the hypoxia chamber. Experiments were performed 14 days after nebulization.
PASMC Culture
PASMCs were obtained from the resistance PAs of 8‐week‐old rats using an enzymatic dissociation method as described previously.14 To compare the expression levels of miR‐206 in differentiated PASMCs, the freshly isolated differentiated PASMCs were cultured with Dulbecco's modified Eagle's medium in 15% fetal bovine serum for 3 days and then used for analysis.
Analysis of Cell Proliferation
To detect cell proliferation, primary PASMCs from the CON and IUGR groups were seeded into 96‐well plates at 1000 cells/well before transfection of miR‐206 inhibitor or anti‐miRTM miRNA Inhibitors‐Negative Control (Invitrogen) following the manufacturer's instructions. Dilute Lipofectamine RNAiMAX Reagent in Opti‐MEM Medium (1:15) and Dilute miRNA inhibitor in Opti‐MEM Medium (1:50) were mixed as 1:1 ratio. The complex was incubated for 5 minutes at room temperature and was added to cells (1 pmol miRNA inhibitor per well). Then, 24 hours after transfection, cells were stimulated with 100 μmol/L CoCl2 (a classic hypoxia mimetic; Sigma‐Aldrich) for 48 hours. EdU assays (Sigma‐Aldrich) were performed to assess cell proliferation after transfection (0, 24, and 48 hours) according to the manufacturer's instructions. The cells were scanned in a plate reader (Tecan, Mannedorf, Switzerland) at an absorbance of 490 nm. All assays were performed in triplicate.
Dual‐Luciferase Assay
Dual‐luciferase reporter experiments were performed in primary cultured PASMCs. PASMCs were cotransfected with the 3′‐UTR region of KCNA5 cloned into pMirTarget vector (0.008 μg/μL medium, Sangon Biotech,Shanghai, China) containing the sequence of a firefly luciferase as a reporter and a vector contain a Ranilla luciferase as an internal control (0.002 μg/μL medium, Sangon Biotech). PASMCs placed into a 96‐well plate at 70% confluence were cotransfected with miR‐206 mimic or scrambled miRNA as control (both at 10 nmol/L, Thermo Fisher Scientific), using Lipofectamine RNAiMAX transfection reagent (Thermo Fisher Scientific), in accordance with the manufacturer's instructions. After 48 hours, luciferase activity of firefly luciferase (F) and luciferase activity of Ranilla luciferase (R) was measured by a luminometer (Infinite® M1000 Pro, Tecan), using the Dual‐Luciferase Reporter Assay System (Promega, Madison, WI). Luciferase activity was expressed as R/F and normalized to the scrambled miRgroup.
Immunoblotting
The smooth muscle layer of resistance PA rings was dissected. Total protein extracts and western blotting were performed as previously reported.15, 16 The membrane proteins were immunoblotted with antibodies to Kv1.5 (APC‐004; Alomone Labs, Jerusalem, Israel).
Electrophysiology
After transfection and maintenance under hypoxic conditions for 48 hours, the patch clamp assay was performed on isolated PASMCs that had been cultured for 3 days. Whole‐cell patch clamp recording was performed as previously reported.1 The Kv current was defined as the difference between the whole‐cell outward current recorded in the 4‐aminopyridine–free bath solution and the current recorded after superfusing with the same bath solution containing 5 mmol/L 4‐ aminopyridine. The current density of Kv channels was calculated by dividing the average plateau phase I Kv by the cell capacitance and was compared among all the groups.17 Electrophysiologic data analysis was performed using the Clampfit subroutine of the pCLAMP software (Axon Instruments, Union City, CA).
Statistical Analysis
Data are presented as mean±SEM. The differences in mRNA and microRNA expression (PCR and FISH), protein expression, RVSP, SBP, heart rate, thickness of smooth muscle layer, EdU assays, current density, and membrane capacitance were among groups were analyzed using one‐way ANOVA for 2‐group comparisons and the Tukey's honestly significant difference test as post hoc statistical analysis. All of the above statistical analyses were performed by using SPSS, version 16.0 (IBM, Armonk, NY). The heat map and log‐log scatter plot were assessed by R‐software of significance analysis of microarray. P<0.05 was considered to indicate statistical significance.
Results
miR‐206 Associates With PAH Progression at Adulthood Following IUGR
As we found previously, IUGR causes exaggerated PAH in conjunction with CH later in life, due to PASMC dysfunction.1 To explore the epigenetic mechanisms underlying these relationships, we used Affymetrix microarrays to analyze RNA levels from PASMCs from 3 pairs of male offspring (CON and IUGR rats at 12 weeks of age; Figure 1A). Interestingly, the relative signal strength of miR‐206 and miR‐184 in IUGR rats was consistently higher than that in CON rats, while other miRNAs exhibited no difference between the 2 groups. (The expression of miR‐206 [red point] in resistance PA smooth muscle tissue were 4.73 times higher in the IUGR group than the control group by microarray test; Figure 1B and 1C.) As Kyoto Encyclopedia of Genes and Genomes pathway analysis and gene ontology processes analysis show, miR‐206 is a member of a muscle‐specific miR family associated with hypoxia and cation channel activity and predicted to target the PAH network (Figure 1D).
Figure 1.
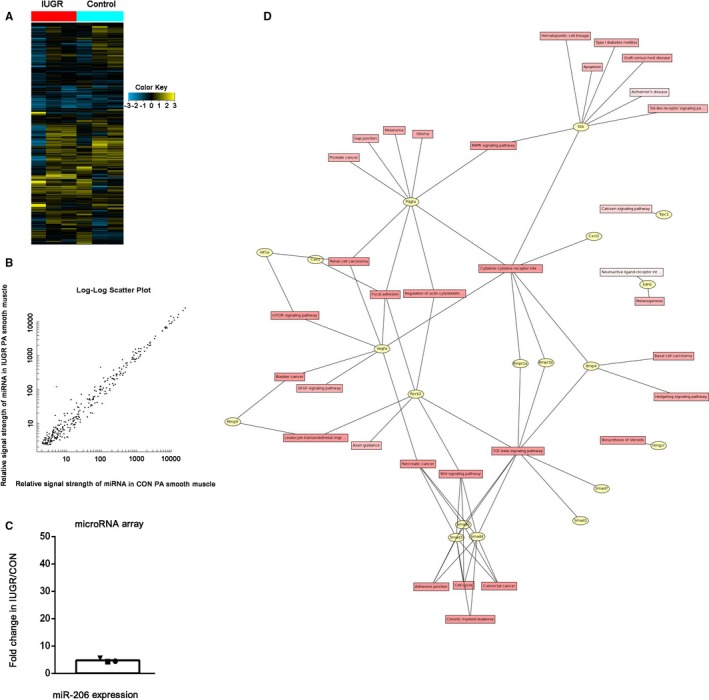
Level of miR‐206 expression in PA smooth muscle and predicted target network of miR‐206. A, Heat map of the 680 miRNAs that had differential expression between intrauterine growth retardation (IUGR) and control (CON) rats. Each column in this map corresponds to an individual rat, whereas each row corresponds to data from a single microRNA. Yellow color shows high expression, and blue color shows low expression. n=3. B and C, The microarray data show the expression of microRNA‐206 (red point) in resistance PA smooth muscle tissue of CON and IUGR rats at 12 weeks of age. D, Predicted target network of miR‐206 identified both by enrichment analysis and literature review reveals genes that may represent points of miR‐206 regulation in cell proliferation and migration inhibition. CON indicates control; IUGR, intrauterine growth retardation; miR‐206, microRNA‐206; miRNA, microRNA; PA, pulmonary artery.
To confirm the effects of hypoxic conditions on adult rats following IUGR, we measured the RVSP of these animals. The RVSP of the IUGR group was significantly higher than that of the control group after 2 weeks under hypoxic conditions (30.6±0.9 versus 35.9±1.6 mm Hg; P<0.05), while no difference was detected in SBP between these groups (119.9±1.1 versus 121.7±1.7 mm Hg; P=0.28; Figure 2C). The birth weights of the offspring from the IUGR group were markedly reduced compared with the control group (5.0±0.6 versus 7.0±0.9 g; P<0.05) as reported previously,1 while no difference was detected in weights of these offspring at 12 weeks (444±12.7 g versus 438±8.2 g; P=0.10). To validate our findings in PAs of IUGR rats, we confirmed higher level of miR‐206 in an additional 8 IUGR rats by qRT‐PCR (Figure 3A). What's more, we investigated the expression of miR‐206 in lung tissue by FISH and found that the proportion of PASMCs expressing miR‐206 in the IUGR rats was increased compared with CON rats (Figure 3E). After 2 weeks under hypoxic conditions, the expression of miR‐206 increased in both the CON‐CH and IUGR‐CH groups but was increased to a greater degree in the IUGR‐CH group. Similar findings were apparent by qRT‐PCR, as CH increased miR‐206 expression in IUGR groups more than in the CON groups (Figure 3A).
Figure 2.
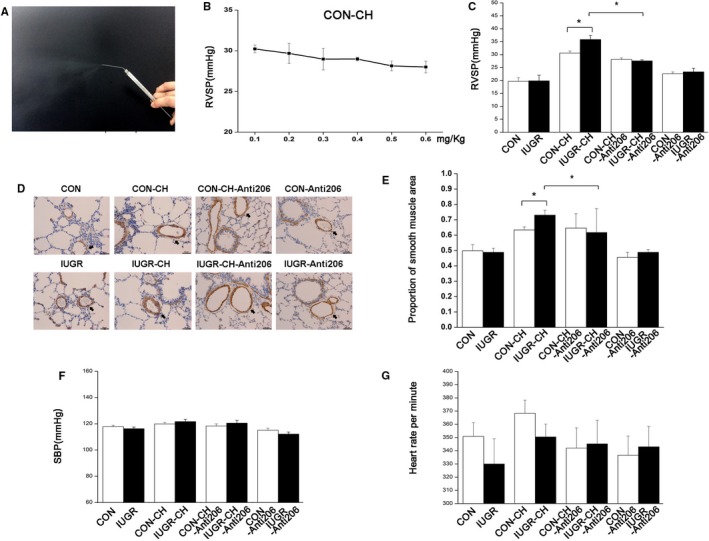
miR‐206 inhibition in vivo restored exaggerated PAH of IUGR rats. A, Representative photo of nebulized miR‐206 inhibitor. B, The effect of the indicated doses of inhaled miR‐206 inhibitor on RVSP of CON‐chronic hypoxia (CH rats). C, RVSP of the indicated groups after a dose of 0.5 mg/kg miR‐206 inhibitor via inhalation. D, Representative images of α‐SMA (smooth muscle actin) staining (brown) using immunohistochemical staining in small PA cross‐sections. Scale bar=75 μm. E, Summary plots of the area proportion (medial area/[medial+lumen] area) show the wall thickness of the smooth muscle layer in resistance PA between groups. F and G, SBP and heart rates were measured for each of the groups. n=6 for each group. *P<0.05. In all cases, data are expressed as the mean±SEM. CON indicates control; IUGR, intrauterine growth retardation; miR‐206, microRNA‐206; PA, pulmonary artery; PAH, pulmonary artery hypertension; RVSP, right ventricular systolic pressure; SBP, systemic blood pressure.
Figure 3.
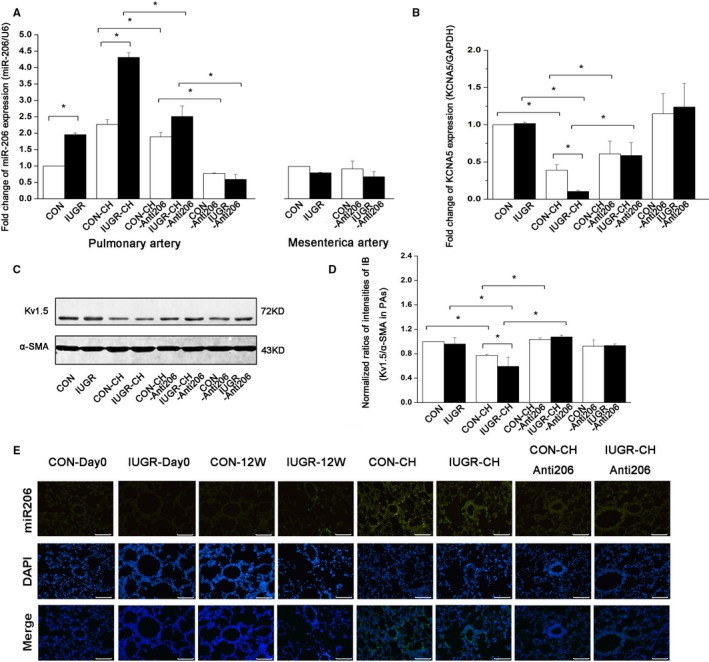
miR‐206 inhibition in vivo increased Kv1.5 channel expression to restore CH‐PAH of IUGR rats. A, Fold‐change of miR‐206 expression by qRT‐PCR in PA smooth muscle and mesenteric artery smooth muscle of different groups. n=5 per group of CON, IUGR, CON‐CH and IUGR‐CH; n=8 per group of CON‐CH‐Anti206, IUGR‐CH‐Anti206, CON‐Anti206, and IUGR‐Anti206;*P<0.05. B, Fold‐change of mRNA of KCNA5 in PA smooth muscle of different groups. n=8 per group; *P<0.05. C and D, Representative images of immunoblotting and quantitative analysis of Kv1.5 α‐protein in PA smooth muscle. n=8 per group; *P<0.05. E, Representative images of miR‐206 by FISH from IUGR and CON rats with or without CH from newborn to 12 weeks old. n=4 per group, scale bar=50 μm. In all cases, data represent the mean±SEM. CH indicates chronic hypoxia; CON, control; FISH, fluorescent in situ hybridization; IUGR, intrauterine growth retardation; miR‐206, microRNA‐206; PA, pulmonary artery; PAH, pulmonary artery hypertension; qRT‐PCR, quantitative real‐time polymerase chain reaction.
miRNA‐206 Regulates RVSP in PAH Progression in Adulthood Following IUGR
After identifying differential effects of IUGR and CH on miR‐206, we sought to examine the role of this miRNA inhibition in RVSP in PAH following nebulization with Invivofectomine 3.0 and miR‐206 inhibitor, as shown in Figure 2A. The RVSP of CON‐CH rats was lowest after application of miRNA‐206 inhibitor doses of 0.5 and 0.6 mg/kg based on preliminary experiments (Figure 2B) and showing that it decreased miR‐206 expression without excessive toxicity on heart rate and SBP (Figures 2F, 2G, and 3A), so we chose a dose of 0.5 mg/kg to conduct experiments. Both qRT‐PCR and FISH showed that the expression of miR‐206 in PA smooth muscle rings was significantly lower in CON‐CH‐Anti206 and IUGR‐CH‐Anti206 groups than in CON‐CH and IUGR‐CH groups and that there were no differences between the 2 groups treated with the inhibitor (Figure 3A and 3E).
After 2 weeks of hypoxia following nebulization, the miR‐206 inhibitor slightly decreased RVSP in IUGR‐CH‐Anti206 rats (27.58±0.40 mm Hg) compared with IUGR‐CH rats (35.84±1.55 mm Hg; P<0.05). RVSP was also decreased in the CON‐CH‐Anti206 group (30.56±0.86 mm Hg [CON‐CH] versus 28.15±0.61 mm Hg [CON‐CH‐Anti206]; P=0.08), while there was no difference between the RVSP values in the CON‐CH‐Anti206 and IUGR‐CH‐Anti206 groups (Figure 2C). The SBP and heart rates were not affected between any of the groups, indicating that miR‐206 does not affect these parameters (Figure 2F and 2G). On the other hand, RVSP did not statistically differ between CON‐Anti206 and IUGR‐Anti206 groups. Mortality was 0 of 10 following use of 25 μL Invivofectamine reagent and 7 of 10 following use of 50 μL of Invivofectamine reagent, and the presence of wheezy phlegm regressed 1 day after transfection in all the rats. Furthermore, lung inflammation was not apparent in lung sections 14 days after transfection (Figure 2D).
Additionally, we performed immunohistochemical staining in 14‐week‐old rats. There was a significant reduction in the medial hypertrophy and α‐smooth muscle actin expression in small PAs of CH groups after application of the miR‐206 inhibitor, and we found that the thickness of the resistance PA smooth muscle layer in artery slices did not differ between CON‐CH‐Anti206 (0.65±0.09) and IUGR‐CH‐Anti206 (0.62±0.16; P=0.41; Figure 2D and 2E). No differences in the normalized expression of α‐smooth muscle actin in the resistance PAs between the normoxia groups with or without the miR‐206 inhibitor were observed by immunohistochemical staining.
miRNA‐206 Inhibition Affects Kv1.5 Expression of PASMCs In Vivo in CH‐PAH in Adulthood Following IUGR
We previously showed that Kv1.5 in PASMCs is downregulated in exaggerated CH‐PAH originating from IUGR,1 and we hypothesized that an epigenetic mechanism may play an important role in the disease progression. To further test this hypothesis, we measured protein and mRNA levels of Kv1.5 in PA smooth muscle after nebulization with miR‐206 inhibitor. The protein level of Kv1.5 was increased in CON‐CH‐Anti206 (1.07±0.01) and IUGR‐CH‐Anti206 (1.05±0.04; P=0.37) according to immunoblotting studies, and the mRNA level of KCNA5 was markedly increased in the CON‐CH‐Anti206 group (0.77±0.02) compared with the IUGR‐CH‐Anti206 group (0.59±0.15; P=0.55) by PCR (Figure 3B, 3C, and 3D) and by FISH (Figure 3E). No differences in Kv1.5 protein and KCNA5 mRNA expression were noted between the CON‐Anti206 and IUGR‐Anti206 groups, indicating specific effects by the miR‐206 inhibitor. To confirm that miR‐206 binds to the 3′‐UTR of the KCNA5 mRNA, we screened the 3′‐UTR region of KCNA5 and identified putative binding sites of miR‐206 (Figure 4E). miR‐206 mimic significantly decreased the relative luciferase reporter activity of PASMCs compared with scrambled miR group (1 versus 0.74±0.09, P<0.05), which suggests that miR‐206 could directly bind to the 3′‐UTR of KCNA5 (Figure 4F).
Figure 4.
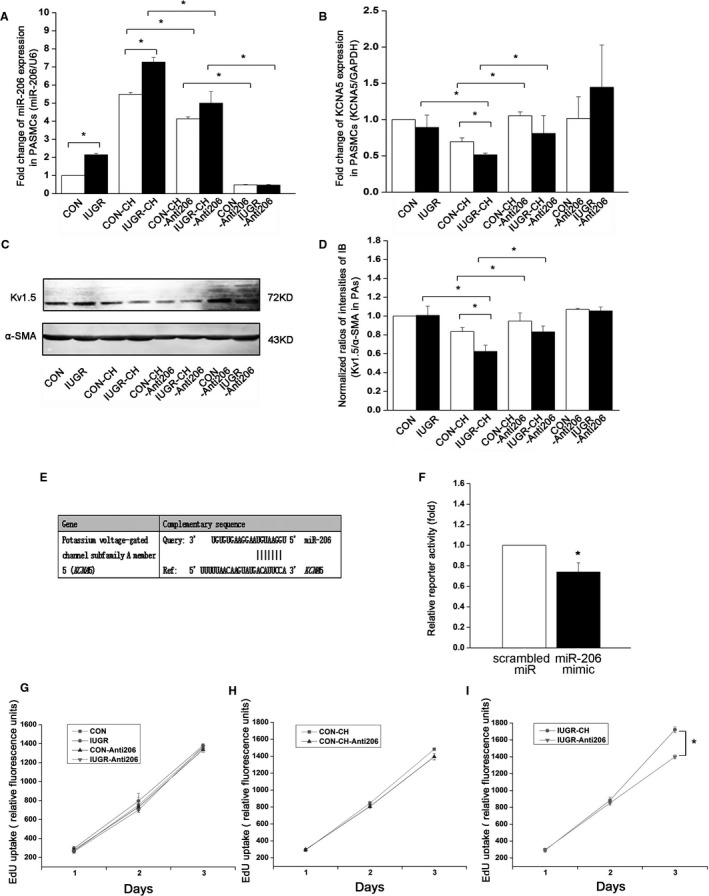
miR‐206 inhibition in primary cultured PASMCs regulates Kv1.5 channel expression and prevents overproliferation of PASMCs from IUGR‐CH‐PAH rats. A, Fold‐change of miR‐206 in PASMCs of different groups. B, Fold‐change of mRNA of KCNA5 in PASMCs of different groups. C and D, Representative images of immunoblotting and quantitative analysis of Kv1.5 α‐protein in PASMCs. Data in (A, B, D) are presented as means±SEM. *P<0.05; n=4 100‐mm dishes from 4 rats per group. E, Predicted sequence of miR‐206 complements 3′‐UTR of KCNA5 mRNA in rat. F, Relative luciferase activity in (PASMCs) cotransfected with miR‐206 mimic or scrambled miRNA with the pMirTarget vector containing the 3′‐UTR region of KCNA5 and the luciferase gene. Results are presented as means±SEM; *P<0.05. G, H, and I, Proliferation of PASMCs transfected with or without miR‐206 inhibitor was measured with EdU assays. Relative fluorescence units were detected to calculate the proliferation of PASMCs. *Represents IUGR‐CH vs IUGR‐CH‐Anti206, P<0.05; n=6 experiments. In all cases, all values are expressed as the mean±SEM. CH indicates chronic hypoxia; IUGR, intrauterine growth retardation; miR‐206, microRNA‐206; miRNA, microRNA; PAH, pulmonary artery hypertension; PASMCs, pulmonary artery smooth muscle cells; UTR, untranslated region.
miR‐206 Inhibition In Vitro Abolished the Effects of Hypoxia on PASMCs From IUGR Rats Via Heightened Kv1.5 Expression
To explore the therapeutic potential of miR‐206 inhibition, we next treated a CH cell model of PASMCs (hypoxia mimicked by 100 μmol/L CoCl2 as previously reported1) with 10 μmol/L miR‐206 inhibitor.1 The miR‐206 inhibition (Figure 4A) decreased EdU uptake in IUGR‐CH‐Anti206 PASMCs, but EdU uptake in CON‐CH‐Anti206 PASMCs was only a bit lower compared with CON‐CH PASMCs (Figure 4H and 4I), suggesting that the proliferation rate was decreased much more in the IUGR‐CH‐Anti206 PASMCs than the CON‐CH‐Anti206 groups. As expected, there was no significant effect of the miR‐206 inhibitor on CON‐Anti206 and IUGR‐Anti206 groups (Figure 4G). The EdU uptake in CON‐CH and IUGR‐CH PASMCs was significantly higher than CON and IUGR groups (Figure 4G, 4H, and 4I).
To further investigate the role of miR‐206 inhibitor on Kv1.5 expression, we examined Kv1.5 in both CON‐CH‐Anti206 and IUGR‐CH‐Anti206 PASMCs using immunoblotting. The decreased proportion of Kv1.5 protein was diminished in CON‐CH‐Anti206 and IUGR‐CH‐Anti206 groups compared with the CON‐CH and IUGR‐CH groups, and there was no difference between the CON‐CH‐Anti206 and IUGR‐CH‐ Anti206 groups, suggesting that the inhibitory effects of hypoxia on Kv1.5 have been alleviated by inhibition of miR‐206 (Figure 4C and 4D). Next, qRT‐PCR analysis demonstrated that reduced miR‐206 expression induces an increase in KCNA5 mRNA expression in PASMCs of CON‐CH‐Anti206 and IUGR‐CH‐Anti206 groups, and that this increase was similar in both groups (Figure 4B). Additionally, the Kv1.5 protein levels were increased similarly to the levels of Kv1.5 mRNA in these groups (Figure 4B, 4C, and 4D).
miR‐206 Inhibition Elevates 4‐Aminopyridine ‐Sensitive I Kv in Resistance PASMCs of CH Rats
PASMCs from resistance PAs were patch‐clamped, and the whole‐cell outward current was assessed after application of 4‐aminopyridine. Within 1 minute, these currents were inhibited by 4‐aminopyridine (Figure 5A and 5B). Subtraction analyses showed that 4‐aminopyridine–sensitive Kv currents and current densities in CON‐CH‐Anti206 and IUGR‐CH‐Anti206 groups were both increased compared with those in CON‐CH and IUGR‐CH groups; however, there was no significant difference between CON‐CH‐Anti206 and CON‐CH groups and did not exhibit a significant difference between each other (Figure 5F). The whole‐cell current densities do not have significant difference in the groups as those cultured under normoxic conditions before 4‐aminopyridine or after 4‐aminopyridine (Figure 5E through 5H). Furthermore, there was no effect of miR‐206 inhibition on the CON‐Anti206 and IUGR‐Anti206 groups (Figure 5C and 5D), and no differences in cell capacitance between any of the groups were noted (Figure 5I). Together, these results suggest that miRNA‐206 downregulation in primary cultured PASMCs could offset hypoxia‐inhibited Kv current in the IUGR group, as miR‐206 inhibition increased Kv1.5 expression similar to that of 4‐aminopyridine–sensitive Kv currents (Figure 5J).
Figure 5.
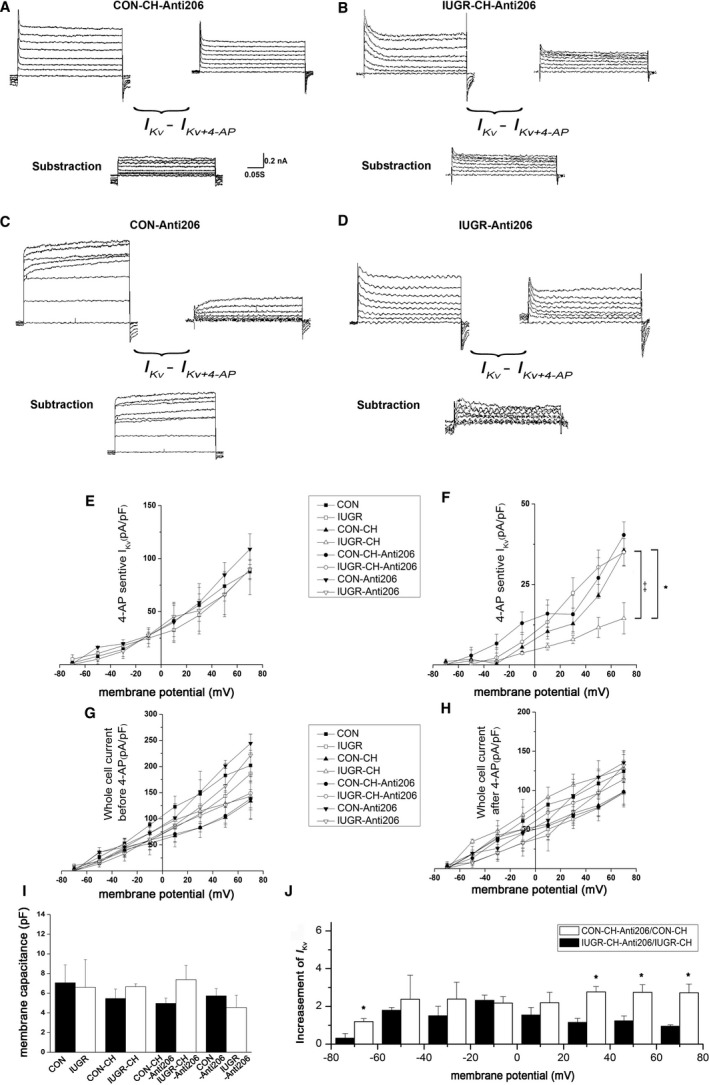
miR‐206 inhibition increased 4‐aminopyridine–sensitive voltage‐gated potassium (Kv) currents more prominently in IUGR‐CH rats. A and B, Representative traces of the whole‐cell currents in resistance PASMCs in CON‐CH‐Anti206 (A) and IUGR‐CH‐Anti206 (B) rats before (top, left traces) and after (top, right traces) treatment with 4‐aminopyridine (5 mmol/L). Analyses of current subtraction, which represents 4‐aminopyridine‐sensitive Kv currents, are shown at the bottom of (A and B). C and D, Representative traces of whole‐cell currents in resistance PASMCs in CON‐Anti206 (C) and IUGR‐Anti206 (D) rats before (top, left) and after (top, right) treatment with 4‐aminopyridine (5 mmol/L). Analyses of current subtraction, which represents 4‐aminopyridine–sensitive Kv currents, are shown at the bottom of (C and D). E and F, Plots of whole‐cell 4‐aminopyridine–sensitive Kv current density of PASMCs of the indicated groups after treatment with 4‐aminopyridine were analyzed. *Represents CON‐CH vs IUGR‐CH, ‡represents IUGR‐CH vs IUGR‐CH‐Anti206, P<0.05. G, Plots of whole‐cell current density of PASMCs of the indicated groups before treatment with 4‐aminopyridine were analyzed. Though the currents density of CON‐CH‐Anti206 and IUGR‐CH‐Anti206 groups was higher than CON‐CH and IUGR‐CH groups, there was no significant difference between each group. H, Plots of remaining currents density between the indicated groups. There were no significant differences between the groups. I, Plots of membrane capacitance of PASMCs of the indicated groups after treatment with 4‐aminopyridine were analyzed. There was no significant difference between each group. J, Plots of the ratio of IK v increase at −70 to 70 mV for CON‐CH‐Anti206/CON‐CH and IUGR‐CH‐Anti206/IUGR‐CH rats. Data are presented as means±SEM. *P<0.05. In all cases, n=18 cells from 6 rats per group. CH indicates chronic hypoxia; CON, control; IUGR, intrauterine growth retardation; miR‐206, microRNA‐206; PASMCs, pulmonary artery smooth muscle cells.
Discussion
Using a rat model, we verified previous reports of exaggerated PAH after CH later in life following intrauterine malnutrition and IUGR. This study demonstrates that miR‐206 participates in epigenetic regulation of processes that originate from IUGR and consequently promotes hypoxia‐induced pulmonary vascular disease. More specifically, we first found that miR‐206 was overexpressed in PASMCs of IUGR rats at 12 weeks of age compared with control rats. Second, miR‐206 expression was decreased to a greater extent after CH, concomitant with reduced Kv1.5 expression and I Kv in both PA smooth muscle and cultured PASMCs from 14‐week‐old IUGR rats. Finally, and most importantly, miR‐206 inhibition improved pulmonary vascular compliance, alleviated excessive PAH, and abolished over proliferation of PASMCs in both our IUGR‐CH rat model and cultured cell model, and these effects were primarily via upregulation of Kv1.5 expression. Taken together, these findings indicate that miR‐206 is a target molecule that downregulates the expression of Kv1.5 on PASMCs in IUGR rats after 2 weeks of hypoxia, causing exaggerated PAH in adults as previously suggested.1
The progression and outcome of PAs underlie PAH following IUGR. Observations in humans suggest that transient intrauterine insults are associated with pulmonary vascular dysfunction later in life.18 Exploring new pathogenetic factors, such as noncoding RNA, is therefore paramount for the development of efficient new therapies.19 As accumulating evidence demonstrates that miRNAs are involved with tissue remodeling and the development of hypertrophy and blockage in the pulmonary vasculature,20, 21, 22, 23 we sought to identify miRNAs involved in these processes in PA smooth muscle tissue. These studies demonstrated that miRNA‐206 was significantly overexpressed in IUGR rats compared with control animals. The role of miR‐206 has already been confirmed in tumor cell lines. Yan et al found low expression of miR‐206 in rhabdomyosarcoma cells via interaction with miRNA response elements (sequence‐guided) and complementary sequences (within a region of the 3′‐UTR) of the tumor suppressor c‐Met, ultimately inhibiting its expression or stabilizing the expression of PAX3 and CCND2 and causing abnormal cell proliferation and migration inhibition.7, 24 Other studies reported that miR‐206 potentially affects prenatal skeletal muscle development by repressing SFRP1 expression via degradation of the mRNA transcripts.25 Furthermore, other investigations in relevant cell models have highlighted the critical role of miR‐206 in PASMCs,9, 26 raising challenges for in vivo use of miR‐206 for PAH intervention, especially following IUGR.
Administration of the miR inhibitor via the airway significantly reduced the expression of miR‐206 in PASMCs. This delivery route is simple, effective, and well tolerated, as reported previously.11 The current volume of vector did not cause mortality, overt lung toxicity, or inflammation. Importantly, miR‐206 inhibition was found only in PAs and not in the mesenteric arteries (Figure 3A). As previously reported, unlike cationic lipids, neutral lipid emulsion such as the transfection reagent we used (lipofectamine RNAiMAX) preferentially accumulates in the lungs rather than other tissues.27 A repeated inhalation may improve the RVSP downregulation, and further investigations will be needed to assess potential laryngeal injury. Thus, we found that miR‐206 gene transfer via airway nebulization in vivo is feasible and effective and ameliorates PAH in the IUGR‐CH‐PAH model. Additional vectors may be used to employ cell type–specific promoters to target PASMCs, rather than a promiscuous promoter, and may also include other target microRNAs. Further investigations will address these possibilities.
The loss of Kv1.5 expression in PASMCs appears to be important to the pathogenesis of CH‐PAH.11, 28 Intrauterine malnutrition may augment this effect of hypoxia later in life.1 Although miR‐206 has many additional predicted targets according to Kyoto Encyclopedia of Genes and Genomes pathway analysis and gene ontology processes analysis, most of which are related to cell proliferation and apoptosis effects, our in vitro and in vivo experiments demonstrate a dominant role of miR‐206 on Kv1.5 expression in IUGR in protecting from CH‐PAH progression following miR‐206 inhibition. These observations were consistent with TargetScan5, which predicted KCNA5 as a target of miR‐206.13 We attributed the decrease of RVSP, regression in medial hypertrophy of small PAs, and altered hypoxia‐induced cell proliferation to increased Kv1.5 expression in PASMCs of IUGR‐CH‐Anti206 rats. Although SBP was slightly higher in IUGR‐CH‐Anti206 rats, there was no statistically significant difference in these values compared with control groups (Figure 2F).
Another interesting finding is that both the Kv1.5 mRNA and protein levels were repressed by miR‐206 after CH. Current evidence suggests posttranscriptional inhibition by miRNA completely complementary binding to mRNA to initiate the transcript degradation, and this mechanism may indeed play a key role in this progression.5, 29
Furthermore, the I Kv of PASMCs is more sensitive to 4‐aminopyridine in IUGR‐CH‐Anti206 rats and is proportional to the expression of the Kv1.5 α‐subunit. miR‐206 is thought to mediate the downregulation of Kv1.5 expression during CH, thus causing voltage‐dependent current changes, as well as RVSP and medial hypertrophy of small PAs, in IUGR rats.
One limitation of our study involves the detection of miR‐206 in PA smooth muscle tissue rather than via peripheral blood testing. Because expression of miRNA206 in peripheral blood is low, changes in expression need further study to consider this marker for improved diagnostics for IUGR patients with PAH. Moreover, despite the availability of classic drugs, the development of new pharmacotherapies with mechanisms that differ from current compounds may prove valuable in the treatment of PAH following IUGR. Studies stemming from our results may provide novel diagnostic potential and therapies to PAH following IUGR, in response to this high‐priority unmet clinical need.30, 31
In conclusion, miRNA is a key epigenetic regulator of numerous functions involved in IUGR progression, including increased activity, proliferation, and apoptosis of cells.32 Our study provides in vivo and in vitro findings that overexpression of miR‐206 in IUGR rats favorably increased RVSP and accelerated PASMC proliferation in these rats after CH. Importantly, miR‐206 inhibition reduced the progression of CH‐PAH of IUGR via increased expression of Kv1.5 and Kv currents in PASMCs. Collectively, these findings support the development of clinically applicable strategies to inhibit miR‐206, thereby maintaining or elevating Kv1.5 channel expression, to offer therapeutic interventions for CH‐PAH following IUGR.
Sources of Funding
This study was supported by the Zhejiang Key Laboratory for Diagnosis and Therapy of Neonatal Diseases, the Toxicology Laboratory of Zhejiang University School of Medicine, and the Key Laboratory of Medical Neurobiology of Ministry of Health of China. This work was supported by grants from the National Natural Science Foundation of China (no. 81471480, 81630037, and 81501293).
Disclosures
None.
(J Am Heart Assoc. 2019;8:e010456 DOI: 10.1161/JAHA.118.010456.)
References
- 1. Lv Y, Tang LL, Wei JK, Xu XF, Gu W, Fu LC, Zhang LY, Du LZ. Decreased kv1.5 expression in intrauterine growth retardation rats with exaggerated pulmonary hypertension. Am J Physiol Lung Cell Mol Physiol. 2013;305:L856–L865. [DOI] [PubMed] [Google Scholar]
- 2. Xu XF, Lv Y, Gu WZ, Tang LL, Wei JK, Zhang LY, Du LZ. Epigenetics of hypoxic pulmonary arterial hypertension following intrauterine growth retardation rat: epigenetics in PAH following IUGR. Respir Res. 2013;14:20. [DOI] [PMC free article] [PubMed] [Google Scholar]
- 3. Pauwaa S, Machado RF, Desai AA. Survival in pulmonary arterial hypertension: a brief review of registry data. Pulm Circ. 2011;1:430–431. [DOI] [PMC free article] [PubMed] [Google Scholar]
- 4. Barker DJ. The developmental origins of chronic adult disease. Acta Paediatr Suppl. 2004;93:26–33. [DOI] [PubMed] [Google Scholar]
- 5. Cuellar TL, McManus MT. Micrornas and endocrine biology. J Endocrinol. 2005;187:327–332. [DOI] [PubMed] [Google Scholar]
- 6. Bienertova‐Vasku J, Novak J, Vasku A. Micrornas in pulmonary arterial hypertension: pathogenesis, diagnosis and treatment. J Am Soc Hypertens. 2015;9:221–234. [DOI] [PubMed] [Google Scholar]
- 7. Yan D, Dong Xda E, Chen X, Wang L, Lu C, Wang J, Qu J, Tu L. MicroRNA‐1/206 targets c‐Met and inhibits rhabdomyosarcoma development. J Biol Chem. 2009;284:29596–29604. [DOI] [PMC free article] [PubMed] [Google Scholar]
- 8. Mondejar‐Parreno G, Callejo M, Barreira B, Morales‐Cano D, Esquivel‐Ruiz S, Moreno L, Cogolludo A, Perez‐Vizcaino F. miR‐1 is increased in pulmonary hypertension and downregulates Kv1.5 channels in rat pulmonary arteries. J Physiol. 2018. Available at: https://physoc.onlinelibrary.wiley.com/doi/full/10.1113/JP276054. Accessed January 7, 2019. [DOI] [PMC free article] [PubMed] [Google Scholar]
- 9. Jalali S, Ramanathan GK, Parthasarathy PT, Aljubran S, Galam L, Yunus A, Garcia S, Cox RR Jr, Lockey RF, Kolliputi N. Mir‐206 regulates pulmonary artery smooth muscle cell proliferation and differentiation. PLoS One. 2012;7:e46808. [DOI] [PMC free article] [PubMed] [Google Scholar]
- 10. Yue JQ, Guan J, Wang XY, Zhang LL, Yang ZX, Ao QL, Deng YT, Zhu PC, Wang GP. MicroRNA‐206 is involved in hypoxia‐induced pulmonary hypertension through targeting of the HIF‐1 alpha/Fhl‐1 pathway. Lab Invest. 2013;93:748–759. [DOI] [PubMed] [Google Scholar]
- 11. Pozeg ZI, Michelakis ED, McMurtry MS, Thebaud B, Wu XC, Dyck JR, Hashimoto K, Wang S, Moudgil R, Harry G, Sultanian R, Koshal A, Archer SL. In vivo gene transfer of the O2‐sensitive potassium channel Kv1.5 reduces pulmonary hypertension and restores hypoxic pulmonary vasoconstriction in chronically hypoxic rats. Circulation. 2003;107:2037–2044. [DOI] [PubMed] [Google Scholar]
- 12. Keegan A, Morecroft I, Smillie D, Hicks MN, MacLean MR. Contribution of the 5‐HT(1B) receptor to hypoxia‐induced pulmonary hypertension: converging evidence using 5‐HT(1B)‐receptor knockout mice and the 5‐HT(1B/1D)‐receptor antagonist GR127935. Circ Res. 2001;89:1231–1239. [DOI] [PubMed] [Google Scholar]
- 13. Parikh VN, Jin RC, Rabello S, Gulbahce N, White K, Hale A, Cottrill KA, Shaik RS, Waxman AB, Zhang YY, Maron BA, Hartner JC, Fujiwara Y, Orkin SH, Haley KJ, Barabasi AL, Loscalzo J, Chan SY. MicroRNA‐21 integrates pathogenic signaling to control pulmonary hypertension: results of a network bioinformatics approach. Circulation. 2012;125:1520–1532. [DOI] [PMC free article] [PubMed] [Google Scholar]
- 14. Michelakis ED, Weir EK, Wu X, Nsair A, Waite R, Hashimoto K, Puttagunta L, Knaus HG, Archer SL. Potassium channels regulate tone in rat pulmonary veins. Am J Physiol Lung Cell Mol Physiol. 2001;280:L1138–L1147. [DOI] [PubMed] [Google Scholar]
- 15. Gerk PM. Quantitative immunofluorescent blotting of the multidrug resistance‐associated protein 2 (MRP2). J Pharmacol Toxicol Methods. 2011;63:279–282. [DOI] [PMC free article] [PubMed] [Google Scholar]
- 16. Xu XF, Ma XL, Shen Z, Wu XL, Cheng F, Du LZ. Epigenetic regulation of the endothelial nitric oxide synthase gene in persistent pulmonary hypertension of the newborn rat. J Hypertens. 2010;28:2227–2235. [DOI] [PubMed] [Google Scholar]
- 17. Archer SL, Wu XC, Thebaud B, Nsair A, Bonnet S, Tyrrell B, McMurtry MS, Hashimoto K, Harry G, Michelakis ED. Preferential expression and function of voltage‐gated, O2‐sensitive K+ channels in resistance pulmonary arteries explains regional heterogeneity in hypoxic pulmonary vasoconstriction: ionic diversity in smooth muscle cells. Circ Res. 2004;95:308–318. [DOI] [PubMed] [Google Scholar]
- 18. Sartori C, Allemann Y, Trueb L, Delabays A, Nicod P, Scherrer U. Augmented vasoreactivity in adult life associated with perinatal vascular insult. Lancet. 1999;353:2205–2207. [DOI] [PubMed] [Google Scholar]
- 19. Ghai V, Wang K. Recent progress toward the use of circulating microRNAs as clinical biomarkers. Arch Toxicol. 2016;90:2959–2978. [DOI] [PubMed] [Google Scholar]
- 20. Guo L, Qiu ZP, Wei LP, Yu XF, Gao X, Jiang SL, Tian H, Jiang C, Zhu DL. The microRNA‐328 regulates hypoxic pulmonary hypertension by targeting at insulin growth factor 1 receptor and l‐type calcium channel‐alpha 1C. Hypertension. 2012;59:1006. [DOI] [PubMed] [Google Scholar]
- 21. Sarkar J, Gou D, Turaka P, Viktorova E, Ramchandran R, Raj JU. MicroRNA‐21 plays a role in hypoxia‐mediated pulmonary artery smooth muscle cell proliferation and migration. Am J Physiol Lung Cell Mol Physiol. 2010;299:L861–L871. [DOI] [PMC free article] [PubMed] [Google Scholar]
- 22. Courboulin A, Paulin R, Giguere NJ, Saksouk N, Perreault T, Meloche J, Paquet ER, Biardel S, Provencher S, Cote J, Simard MJ, Bonnet S. Role for miR‐204 in human pulmonary arterial hypertension. J Exp Med. 2011;208:535–548. [DOI] [PMC free article] [PubMed] [Google Scholar]
- 23. Caruso P, MacLean MR, Khanin R, McClure J, Soon E, Southgate M, MacDonald RA, Greig JA, Robertson KE, Masson R, Denby L, Dempsie Y, Long L, Morrell NW, Baker AH. Dynamic changes in lung microRNA profiles during the development of pulmonary hypertension due to chronic hypoxia and monocrotaline. Arterioscler Thromb Vasc Biol. 2010;30:716–723. [DOI] [PubMed] [Google Scholar]
- 24. Li L, Sarver AL, Alamgir S, Subramanian S. Downregulation of microRNAs miR‐1, ‐206 and ‐29 stabilizes PAX3 and CCND2 expression in rhabdomyosarcoma. Lab Invest. 2012;92:571–583. [DOI] [PubMed] [Google Scholar]
- 25. Yang YL, Sun W, Wang RQ, Lei CZ, Zhou R, Tang ZL, Li K. Wnt antagonist, secreted frizzled‐related protein 1, is involved in prenatal skeletal muscle development and is a target of miRNA‐1/206 in pigs. BMC Mol Biol. 2015;16:4. [DOI] [PMC free article] [PubMed] [Google Scholar]
- 26. Chen L, Li YS, Cui J, Ning JN, Wang GS, Qian GS, Lu KZ, Yi B. MiR‐206 controls the phenotypic modulation of pulmonary arterial smooth muscle cells induced by serum from rats with hepatopulmonary syndrome by regulating the target gene, annexin a2. Cell Physiol Biochem. 2014;34:1768–1779. [DOI] [PubMed] [Google Scholar]
- 27. Trang P, Wiggins JF, Daige CL, Cho C, Omotola M, Brown D, Weidhaas JB, Bader AG, Slack FJ. Systemic delivery of tumor suppressor microRNA mimics using a neutral lipid emulsion inhibits lung tumors in mice. Mol Ther. 2011;19:1116–1122. [DOI] [PMC free article] [PubMed] [Google Scholar]
- 28. Michelakis ED, McMurtry MS, Wu XC, Dyck JR, Moudgil R, Hopkins TA, Lopaschuk GD, Puttagunta L, Waite R, Archer SL. Dichloroacetate, a metabolic modulator, prevents and reverses chronic hypoxic pulmonary hypertension in rats: role of increased expression and activity of voltage‐gated potassium channels. Circulation. 2002;105:244–250. [DOI] [PubMed] [Google Scholar]
- 29. Hendrickson DG, Hogan DJ, McCullough HL, Myers JW, Herschlag D, Ferrell JE, Brown PO. Concordant regulation of translation and mRNA abundance for hundreds of targets of a human microRNA. PLoS Biol. 2009;7:e1000238. [DOI] [PMC free article] [PubMed] [Google Scholar]
- 30. Biomarkers Mayeux R. Potential uses and limitations. NeuroRx. 2004;1:182–188. [DOI] [PMC free article] [PubMed] [Google Scholar]
- 31. Tang L, He G, Liu X, Xu W. Progress in the understanding of the etiology and predictability of fetal growth restriction. Reproduction. 2017;153:R227–R240. [DOI] [PubMed] [Google Scholar]
- 32. Dravet‐Gounot P, Morin C, Jacques S, Dumont F, Ely‐Marius F, Vaiman D, Jarreau PH, Mehats C, Zana‐Taieb E. Lung microRNA deregulation associated with impaired alveolarization in rats after intrauterine growth restriction. PLoS One. 2017;12:e0190445. [DOI] [PMC free article] [PubMed] [Google Scholar]