

Abstract
Background
MicroRNA‐125b (miR‐125b) has been shown to regulate vascular calcification (VC), and serum miR‐125b levels are a potential biomarker for estimating the risk of uremic VC status. However, it is unknown whether clinical features, including chronic kidney disease–mineral bone disorder molecules, affect serum miR‐125b levels.
Methods and Results
Patients receiving chronic dialysis for ≥3 months were recruited from different institutes. Serum miR‐125b and chronic kidney disease–mineral bone disorder effectors, including intact parathyroid hormone, 25‐OH‐D, fibroblast growth factor‐23, osteoprotegerin, and fetuin‐A, were quantified. We used multivariate regression analyses to identify factors associated with low serum miR‐125b levels and an area under receiver operating characteristic curve curve to derive optimal cutoffs for factors exhibiting close associations. Further regression analyses evaluated the influence of miR‐125b on VC risk. Among 223 patients receiving chronic dialysis (mean age, 67.3 years; mean years of dialysis, 5.2), 54 (24.2%) had high serum miR‐125b levels. Osteoprotegerin (P=0.013), fibroblast growth factor‐23 (P=0.006), and fetuin‐A (P=0.036) were linearly associated with serum miR‐125b levels. High osteoprotegerin levels independently correlated with high serum miR‐125 levels. Adding serum miR‐125b levels and serum osteoprotegerin levels (≥400 pg/mL) into models estimating the risk of uremic VC increased the area under receiver operating characteristic curve values (for models without miR‐125b/osteoprotegerin, with miR‐125b, and both: 0.74, 0.79, and 0.81, respectively).
Conclusions
Serum osteoprotegerin levels ≥400 pg/mL and serum miR‐125b levels synergistically increased the accuracy of estimating VC risk among patients receiving chronic dialysis. Taking miR‐125b and osteoprotegerin levels into consideration when estimating VC risk may be recommended.
Keywords: biomarker, chronic kidney disease, end‐stage renal disease, fibroblast growth factor‐23, microRNA‐125b, osteoprotegerin, vascular calcification
Subject Categories: Vascular Disease
Clinical Perspective
What Is New?
We previously discovered that high serum miR‐125b levels were associated with a lower probability of uremic VC in patients with end‐stage renal disease.
In this study, we examined the probability of using clinical features and chronic kidney disease–mineral bone disorder molecules to track serum miR‐125b levels among patients with end‐stage renal disease.
Osteoprotegerin, fetuin‐A, and fibroblast growth factor‐23 levels strongly correlated with serum miR‐125b levels and influenced the risk of uremic VC.
What Are the Clinical Implications?
Serum osteoprotegerin levels and serum miR‐125b levels act synergistically in their influences on uremic VC, and both factors can be crucial components in the pathogenesis of uremic VC.
Introduction
Population aging and multimorbidity have led to a global increase of chronic kidney disease (CKD) and end‐stage renal disease (ESRD).1 Cardiovascular events are the leading causes of mortality and morbidity among those with CKD; data from the Atherosclerosis Risk in Communities Study and Cardiovascular Health Study show that the presence of baseline CKD stages 3 to 4 conferred a 30% to 40% higher risk of cardiovascular events compared with non‐CKD participants,2, 3 while prior meta‐analysis revealed that having an estimated glomerular filtration rate of <60 mL/min per 1.73 m2 increased the risk of cardiovascular mortality 2‐ to 5‐fold.4 Uremic vascular calcification (VC) involving either the tunica intima, as with atherosclerosis, or the tunica media, as with Monckeberg medial sclerosis, plays an important role in the increased cardiovascular risk brought on by CKD. The risk of VC increases with higher CKD stages, reaching its peak in those with ESRD undergoing chronic dialysis.5 Depending on imaging techniques, the presence of VC in any arterial site elevates the risk of cardiovascular events and mortality 3‐ to 4‐fold, and the risk is highest for those with ESRD.6
The pathogenesis of uremic VC is complex and involves the interplay between vascular smooth muscle cells (VSMCs), other vascular wall constituents, monocytes/macrophages, circulating stem cells, and adverse vascular microenvironments.7 Active osteochondroblastic differentiation, imbalance between the promoters and inhibitors of the calcification process, dysregulated bone turnover, chronic low‐grade inflammation, and oxidative stress have all been cited to participate in the course of uremic VC.8 MicroRNAs (miRNAs), 9‐ to 23‐nucleotide RNA species that down‐regulate target gene expression, are relatively new players in the development of VC. Through suppressing the mediators of osteoblastic differentiation, mineralization (runt‐related transcription factor 2, alkaline phosphatase [ALP], matrix metalloproteinase‐2, etc), and calcium deposition (osterix, KLF4/STAT3), overexpression of several miRNAs have been shown to reduce the probability and severity of arterial calcification in cellular and animal models.9 The pathogenic importance of microRNAs in VC serves to underlie the potential of circulating miRNAs as diagnostic biomarkers for predicting VC risk.
Existing studies rarely address the utility of circulating miRNAs for predicting uremic VC. Using a translational approach based on the in vitro screening of a VSMC biomineralization model and the findings in animal models and patient sera, we discovered that high serum microRNA‐125b (miR‐125b) levels were predictive of a lower probability of VC in ESRD patients.10 However, the relationship between serum miR‐125b and levels of other molecules involved in chronic kidney disease–mineral bone disorder (CKD‐MBD) is unclear. Several reports suggest that miR‐125b regulates osterix, ETS1, and CCL4 expression in VSMCs and valves,11, 12, 13 but none have examined the miRNA‐protein association in clinical samples. In addition, whether miR‐125b influences uremic VC through modifying other CKD‐MBD molecules, including divalent ions, fibroblast growth factor‐23 (FGF‐23), intact parathyroid hormone, osteoprotegerin, fetuin‐A, and vitamin D, remains unknown. We hypothesize that serum miR‐125b levels may exhibit a close relationship with other CKD‐MBD molecules among patients with ESRD, and this relationship affects how serum miR‐125b can be used to estimate the risk associated with VC. We aimed to examine this hypothesis using a prospectively enrolled multicenter cohort of patients undergoing chronic hemodialysis.
Methods
The data, analytic methods, and study materials will not be made available to other researchers for purposes of reproducing the results or replicating the procedure, as the data contained patient‐sensitive information.
Ethical Approval
The Institutional Review Board of the National Taiwan University Hospital (No. 201208069RIC) approved the current study, and the study protocol adheres to the Declaration of Helsinki. Written informed consent was obtained from all participants.
Participant Enrollment and Data Recording
This part of study procedure has been described previously.10 In brief, we prospectively enrolled participants with ESRD receiving chronic dialysis for ≥3 months from the National Taiwan University Hospital and its affiliated branches (Jinshan and Yunlin) between 2012 and 2014.10 A cohort of patients undergoing chronic hemodialysis from the same institute was also identified between 2011 and 2012 for combinatorial analysis, as described previously.10 Concise medical histories, including demographic profiles, comorbidities, physical parameters, and concurrent medications, were documented from participants during enrollment. Comorbidities (diabetes mellitus, hypertension, cardiac/cerebrovascular events, and peripheral vascular disease) and utilization of medications commonly used to manage vascular events were ascertained. All participants received blood tests immediately before their regular dialysis session for assaying hemograms, serum biochemistry (albumin, electrolytes, pre‐ and postdialysis urea nitrogen, creatinine, and ALP), iron profiles (ferritin), and lipid profiles (cholesterol and triglycerides).
Part of the participants’ sera was cryopreserved for CKD‐MBD‐related molecule analysis. Intact parathyroid hormone levels were measured using an ELISA (LIAISON; DiaSorin, Stillwater, MN), while 25‐hydroxyvitamin D was detected using a radioimmunoassay (DiaSorin, Stillwater, MN). We checked serum FGF‐23, osteoprotegerin, and fetuin‐A levels using commercially available ELISA methods (EZHFGF23‐32K; Millipore, Billerica, MA; ELH‐OPG; RayBiotech, Guangzhou, China; DFTA00; R&D Systems, Minneapolis, MN; respectively). Interassay variations were found to be <3% for each parameter tested.
Following the documentation of clinical and laboratory data, we had all participants receive posteroanterior chest X‐ray examinations. The severity of aortic arch calcification (AAC) was quantitatively assessed based on a widely validated AAC staging system,14, 15 in which stages 0 to 3 represent a scale of VC severity, 3 representing the highest severity of VC and 0 representing no instance of VC. AAC severity results, evaluated by chest radiographs, have been shown to exhibit a good correlation with the extent of coronary and limb VC or vasculopathy in patients undergoing chronic dialysis.15, 16, 17 We chose the presence of AAC in this study as the phenotypic manifestation of uremic VC, which consisted of stage 1 to 3 VC in the AAC staging system (Figure 1), in accordance with our previous approach.10 The calcification severity of the enrolled participants in other anatomic sites has been shown to match that of aorta previously.10
Figure 1.
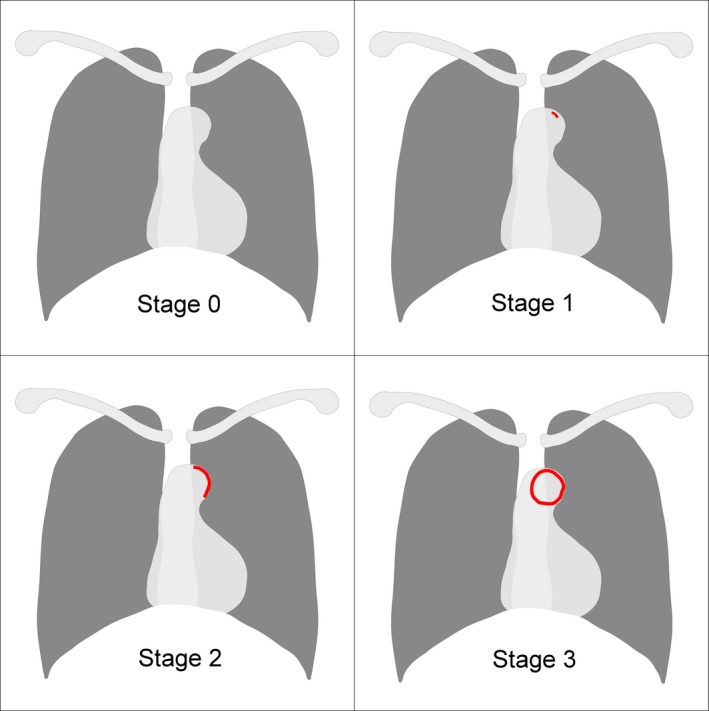
An illustrative figure showing the VC staging system used in this study. (Left upper, right upper, left lower, and right lower represented stage 0, 1, 2, and 3, respectively). VC indicates vascular calcification. Red areas mark the part with calcification opacity.
Determination of Circulating MiRNA‐125b Levels
The technique for extracting and quantifying circulating miRNA has been described previously.10 Briefly, short‐length RNAs were extracted from participants’ sera using the miRNeasy kit (Qiagen; Venlo, Netherlands) via the spin column technique, according to the manufacturer's instructions. Fixed amounts of Caenorhabditis elegans miR‐39 was added into each sample as a spike‐in exogenous reference for optimizing extraction efficiency and for subsequent quantification. The utilization of this spike‐in control in studies involving circulating miRNA has been reported to be a consistent approach for normalization in the existing literature18, 19, 20 and is recommended by the miRNA extraction kit manufacturer. There are also studies suggesting that normalization of serum miRNAs to C elegans miR‐39 yields similar results to other endogenous controls while, additionally, accounting for the influences of storage or frozen‐related alterations of endogenous controls.21 Sera from age‐ and sex‐matched healthy individuals were used as references. We also used internal control samples in each plate to reduce interplate variability. Purified miRNAs were reverse‐transcribed to cDNA and quantified using the miScript RT kit (Qiagen) and the miScript SYBR green PCR kit (Qiagen), and all the tests were performed in triplicate, with average results reported. Serum miR‐125b levels were calculated based on the ∆∆Ct method.
Statistical Analysis
Based on prior findings, lower circulatory miR‐125b levels were associated with higher risks of developing VC in ESRD patients. Moreover, a miR‐125b threshold of ≥0.06 exhibited an excellent sensitivity and high likelihood for excluding uremic VC based on the area under the receiver operating characteristic curve (AUROC).10 In this study, we categorized the participants’ serum miR‐125b levels as being ≥0.06 or <0.06 and compared clinical features (demographic profile, comorbidities, physical parameters, medication used, and laboratory data) between the 2 groups using an independent t test and a chi‐squared test for continuous and categorical variables, respectively. We also assessed the correlations between serum miR‐125b levels and clinical variables using the Pearson correlation coefficient.
To examine the relationship between clinical features and serum miR‐125b levels, we conducted 2 types of multivariate regression analyses with stepwise backward variable selection, one a linear regression model using miR‐125b level in a continuous fashion, and the other a logistic regression model using miR‐125b levels in a binary fashion (≥0.06 or <0.06), both incorporating demographic profiles, comorbidities, physical parameters, medications, and all laboratory data. We organized a panel of “core vascular variables” (CVS), including age, sex, body mass index, dialysis duration, vascular comorbidities (diabetes mellitus, hypertension, heart failure, myocardial infarction, coronary artery disease, stroke, and peripheral vascular disease), lipid profile, and CKD‐MBD parameters (calcium, phosphorus, calcium‐phosphorus product, ALP, 25‐hydroxy‐D, intact parathyroid hormone, FGF‐23, osteoprotegerin, and fetuin‐A), based on prior reports.7, 22 For each type of multivariate linear or logistic regression analysis, we further constructed 3 subtypes of regression modeling: one incorporating CVS, another incorporating CVS with all medications, and the other incorporating CVS and all other variables. Model validity for the multivariate logistic regression analyses targeting serum miR‐125b category (high versus low) was reassured using Hosmer‐Lemeshow tests. This was followed by ROC curve analyses and a numerical comparison of AUROCs between different multivariate logistic regression models with serum miR‐125b category (high versus low) as the dependent variable. The optimal cutoff value for selected variables was calculated, using the Youden Index, along with their associated sensitivities and specificities.
Finally, we evaluated the association between clinical features, serum miR‐125b, and uremic VC status among all participants using multivariate logistic regression models (uremic VC versus no VC) with stepwise backward variable selection, incorporating CVS, CVS with miR‐125b levels, and CVS with selected variables based on the cutoff determined from the analyses of miR‐125b determinants.
All statistical analyses were performed using SPSS software version 18 (IBM Corporation, Armonk, NY) and 2‐tailed P‐values <0.05 were considered significant.
Results
A total of 223 ESRD patients undergoing chronic dialysis were enrolled from 3 institutes, among whom 54 (24.2%) and 169 (75.8%) had high and low serum miR‐125b levels, respectively. The mean age of participants was 67.3±12.9 years, and they received 5.2±4.1 years of dialysis (Table 1). More than 80% of participants had hypertension, 40% had diabetes mellitus, and 30% had coronary artery disease. Nearly half received β‐blockers, while one third of them took angiotensin‐converting enzyme inhibitors/angiotensin receptor blockers and active vitamin D. There was no significant difference in most clinical features between ESRD patients with high or low serum miR‐125b levels, except for higher osteoprotegerin (P=0.004) and borderline increased fetuin‐A (P=0.07) levels in the former group (Table 1). Increased ln(serum miR‐125b) levels were associated with increased serum osteoprotegerin (P=0.031; Figure 2A), FGF‐23 (P=0.018; Figure 2B), and fetuin‐A (P=0.038; Figure 2C) levels. In the following analysis, FGF‐23 data underwent a natural log transformation for the purpose of normalizing the distribution.
Table 1.
Baseline Characteristics of ESRD Participants With High and Low Circulating miRNA‐125b Levels
| Variables | Total (n=223) | High (n=54) | Low (n=169) | P Value |
|---|---|---|---|---|
| Demographic profiles | ||||
| Age, y | 67.3±12.9 | 66.1±13.7 | 67.6±12.6 | 0.45 |
| Female (%) | 120 (54) | 34 (63) | 86 (51) | 0.14 |
| Duration of dialysis, year | 5.2±4.1 | 4.6±3.8 | 5.4±4.1 | 0.2 |
| Body height, cm | 161.3±8.8 | 162.3±8.4 | 160.9±8.9 | 0.35 |
| Body weight, kg | 60±12 | 58.6±12.1 | 60.4±12 | 0.31 |
| Body mass index, mg/m2 | 23±3.7 | 22.1±3.3 | 23.3±3.8 | 0.05 |
| Comorbidity | ||||
| Hypertension (%) | 190 (85) | 48 (89) | 142 (84) | 0.38 |
| Diabetes mellitus (%) | 90 (40) | 24 (44) | 66 (39) | 0.48 |
| Heart failure (%) | 20 (9) | 2 (4) | 18 (11) | 0.1 |
| Acute myocardial infarction (%) | 5 (2) | 3 (6) | 2 (1) | 0.06 |
| Coronary artery disease (%) | 67 (30) | 16 (30) | 51 (30) | 0.99 |
| Liver cirrhosis (%) | 12 (5) | 5 (9) | 7 (4) | 0.09 |
| Malignancy (%) | 58 (26) | 14 (26) | 44 (26) | 0.99 |
| Cerebrovascular events (%) | 19 (9) | 5 (9) | 14 (8) | 0.82 |
| Peripheral vascular disease (%) | 26 (12) | 5 (9) | 21 (12) | 0.53 |
| Physical examination parameters | ||||
| Systolic blood pressure, mm Hg | 143.6±21.2 | 143.3±20.9 | 143.6±21.4 | 0.92 |
| Diastolic blood pressure, mm Hg | 75.3±12.1 | 76.3±12.8 | 74.9±11.9 | 0.49 |
| Heart rate, per minute | 78.1±11 | 76.4±10.4 | 79.1±11.3 | 0.17 |
| Medications with potential influences on vasculopathy and divalent ion balance | ||||
| ACEI or ARB (%) | 69 (31) | 17 (31) | 52 (31) | 0.99 |
| β‐blocker (%) | 103 (46) | 27 (50) | 76 (45) | 0.52 |
| Aspirin (%) | 49 (22) | 8 (15) | 41 (24) | 0.15 |
| Statin (%) | 29 (13) | 7 (13) | 22 (13) | 0.99 |
| Calcium tablet (%) | 171 (77) | 127 (81) | 44 (75) | 0.34 |
| Active vitamin D (%) | 84 (38) | 23 (43) | 61 (36) | 0.39 |
| Laboratory profile | ||||
| Hemogram | ||||
| Leukocyte, K/μL | 6.7±2.4 | 6.5±2.2 | 6.7±2.5 | 0.55 |
| Hemoglobin, mg/dL | 10.1±1.3 | 10.1±1.2 | 10.1±1.3 | 0.78 |
| Platelet, K/μL | 183.7±66.3 | 187.3±69.2 | 182.6±65.6 | 0.65 |
| Serum biochemistry | ||||
| Albumin, g/dL | 3.9±0.4 | 4±0.3 | 3.9±0.4 | 0.11 |
| Urea nitrogen, mg/dL | 87.3±20.6 | 85.1±18.2 | 88.1±21.4 | 0.35 |
| Creatinine, mg/dL | 11.2±2.4 | 11.2±2.6 | 11.2±2.4 | 0.96 |
| Potassium, meq/L | 4.9±0.7 | 5.0±0.4 | 4.9±0.8 | 0.89 |
| Dialysis paremeter | ||||
| URR, % | 74.3±5.2 | 73.9±5.7 | 74.5±5 | 0.47 |
| Inflammation parameters | ||||
| Ferritin, ng/mL | 521.1±454 | 602.5±350 | 495.1±480 | 0.13 |
| Lipid profiles | ||||
| Total cholesterol, mg/dL | 157.5±36.3 | 155.2±34.7 | 158.2±36.8 | 0.6 |
| Triglyceride, mg/dL | 137.9±153 | 112.8±76.1 | 145.9±170 | 0.17 |
| Mineral‐bone parameters | ||||
| Calcium, mmol/L | 2.3±0.2 | 2.3±0.2 | 2.3±0.2 | 0.69 |
| Inorganic phosphate, mg/dL | 5±1.3 | 4.9±1.2 | 5±1.4 | 0.62 |
| Calcium‐phosphate product | 46.6±13.3 | 46.1±12.1 | 46.8±13.7 | 0.73 |
| Alkaline phosphatase, U/L | 82.6±39.3 | 84.2±47 | 82.1±36.7 | 0.73 |
| Intact parathyroid hormone, pg/mL | 464.4±363 | 431.6±318 | 474.9±377 | 0.45 |
| 25‐hydroxy‐vitamin D, ng/mL | 20.3±11.9 | 19.4±9.9 | 20.6±12.5 | 0.51 |
| FGF‐23, pg/mL | 5293±7755 | 5967±8191 | 5077±7622 | 0.46 |
| Ln FGF‐23 | 7.2±2.1 | 7.4±2 | 7.1±2.1 | 0.38 |
| Osteoprotegerin, pg/mL | 405.5±191 | 469.6±220 | 385±177 | 0.004 |
| Fetuin‐A, μg/mL | 494.4±212 | 539.9±231 | 479.9±204 | 0.07 |
ACEI indicates angiotensin‐converting enzyme inhibitor; ARB, angiotensin receptor blocker; ESRD, end‐stage renal disease; FGF‐23, fibroblast growth factor‐23; URR, urea reduction ratio.
Figure 2.
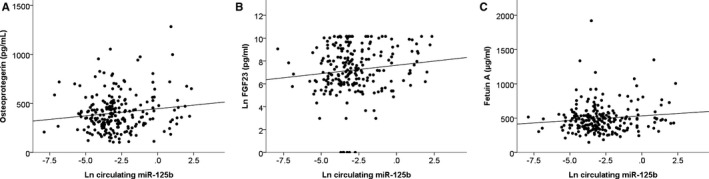
Scatter plot illustrating the correlations between serum miR‐125b levels (natural log transformed) and osteoprotegerin (A), FGF‐23 (natural log transformed) (B), and fetuin‐A (C). FGF‐23 indicates fibroblast growth factor‐23.
To examine the relationship between serum miR‐125b levels and clinical features, we conducted stepwise multivariate regression analyses focusing on serum miR‐125b levels. Multivariate linear regression analyses revealed that serum osteoprotegerin (P=0.013), FGF‐23 (P=0.006), and fetuin‐A (P=0.036) levels were significant determinants of miR‐125b levels (as a continuous variable), independent of demographic profile, dialysis duration, vascular comorbidities, and other well‐known molecules involved in CKD‐MBD (model 1; Table 2). These associations persisted after considering the influence of concurrent medications and other comorbidities or laboratory parameters (models 2 and 3; Table 2).
Table 2.
Results From Multivariate Linear Regression Analysis With Circulating miR‐125b Levels as the Dependent Variable
| Variables | β Value | t | P Value |
|---|---|---|---|
| Model 1a | |||
| Osteoprotegerin | 0.17 | 2.51 | 0.013 |
| Ln(FGF‐23) | 0.18 | 2.78 | 0.006 |
| Fetuin‐A | 0.14 | 2.11 | 0.036 |
| Model 2b | |||
| Osteoprotegerin | 0.17 | 2.51 | 0.013 |
| Ln(FGF‐23) | 0.18 | 2.78 | 0.006 |
| Fetuin‐A | 0.14 | 2.11 | 0.036 |
| Model 3c | |||
| Osteoprotegerin | 0.16 | 2.49 | 0.014 |
| Ln(FGF‐23) | 0.19 | 2.86 | 0.005 |
| Fetuin‐A | 0.14 | 2.09 | 0.038 |
FGF‐23 indicates fibroblast growth factor‐23.
Adjusting for core vascular variables.
Adjusting for core vascular variables and medications.
Adjusting for core vascular variables, medications, all other comorbidities and laboratory data.
To examine the determinants for low serum miR‐125b levels, a known risk factor for uremic VC among ESRD patients,9 multivariate logistic regression analyses using miR‐125b level as a categorical variable (≥0.06 versus <0.06) disclosed that higher age (P=0.007), longer dialysis duration (P=0.034), and lower serum osteoprotegerin levels (P<0.001) were significantly associated with having low miR‐125b levels (model 1; Table 3). After adjusting for other nonvascular comorbidities and laboratory data, multivariate logistic regression analyses showed that lower serum osteoprotegerin levels remained significantly associated with low miR‐125b levels (models 2 and 3; Table 3).
Table 3.
Results From Multivariate Logistic Regression Analysis With High Circulating miR‐125b (Versus Low) as the Dependent Variable
| Variables | Odds Ratio | 95% CI | P Value |
|---|---|---|---|
| Model 1a | |||
| Age (per year) | 0.96 | 0.93–0.99 | 0.007 |
| Dialysis duration (per year) | 0.91 | 0.83–0.99 | 0.034 |
| Osteoprotegerin | 1.004 | 1.002–1.006 | <0.001 |
| Model 2b | |||
| Age (per year) | 0.96 | 0.93–0.99 | 0.007 |
| Dialysis duration (per year) | 0.9 | 0.82–0.99 | 0.026 |
| Osteoprotegerin | 1.004 | 1.002–1.006 | <0.001 |
| Model 3c | |||
| Age (per year) | 0.97 | 0.94–0.99 | 0.034 |
| Dialysis duration (per year) | 0.86 | 0.78–0.96 | 0.004 |
| Osteoprotegerin | 1.004 | 1.002–1.007 | <0.001 |
| Albumin | 3.75 | 1.37–10.24 | 0.01 |
FGF‐23 indicates fibroblast growth factor‐23.
Adjusting for core vascular variables.
Adjusting for core vascular variables and medications.
Adjusting for core vascular variables, medications, all other comorbidities and laboratory data.
We found that the above multivariate logistic regression models were valid (Hosmer‐Lemeshow tests for model 1, P=0.93; for model 2, P=0.63; for model 3, P=0.91), and the AUROC of models 1, 2, and 3 (Table 3) were 0.62 (95% CI, 0.53–0.7), 0.73 (95% CI, 0.66–0.81), and 0.75 (95% CI, 0.67–0.82) (for the hypothesis AUROC=0.5 versus ≠0.5; P=0.009, <0.001, and <0.001), respectively (Figure 3A). Cutoff values for serum osteoprotegerin levels were 335 pg/mL (model 1), 432 pg/mL (model 2), and 400 pg/mL (model 3). Model 3 showed the highest accuracy, based on Youden Index, with a sensitivity and specificity of 67% and 73%, respectively.
Figure 3.
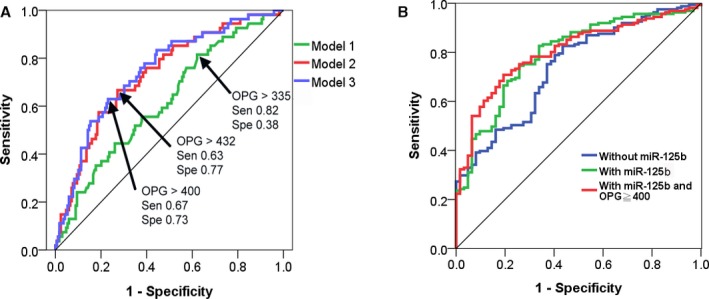
Receiver‐operating characteristics curves for multivariate logistic regression models with serum miR‐125b levels (A) or vascular calcification status (B) as the dependent variable. Cutoff values of osteoprotegerin with their sensitivity and specificity for each model was shown (A). OPG indicates osteoprotegerin; Sen, sensitivity; Spe, specificity.
Finally, we evaluated the clinical importance of the threshold osteoprotegerin level we identified. A total of 161 (72.2%) of the enrolled ESRD patients had VC and had significantly lower serum miR‐125b levels (with versus without, 0.27±1.25 versus 0.9±1.52; P=0.002) and fetuin‐A levels (467±196 μg/mL versus 565±236 μg/mL; P=0.002), but higher osteoprotegerin levels (424±190 pg/mL versus 358±186 pg/mL; P=0.022) than those without VC. Those with uremic VC exhibited a significantly higher proportion of having high osteoprotegerin (>400 pg/mL) than those without (with versus without, 48% versus 31%; P=0.016). Stepwise multivariate logistic regression analyses focusing on uremic VC presence showed that age (P=0.029), ALP (P=0.018), and fetuin‐A (P=0.006) were significantly associated with uremic VC (model 1; Table 4). After adding the variable serum miR‐125b level into the analysis, multivariate logistic regression analyses revealed that miR‐125b (P=0.001) and osteoprotegerin (P=0.003) became significantly associated with uremic VC (model 2; Table 4). The AUROC for models 1 and 2 had a numerical increase from 0.74 (95% CI, 0.67–0.81) to 0.79 (95% CI, 0.73–0.86) (Figure 3B), lending support to the importance of serum miR‐125 levels during the examination of the risk factors of uremic VC. Furthermore, we discovered that switching osteoprotegerin level from a continuous variable to a categorical one (≥400 versus <400) marginally increased the AUROC of the multivariate logistic regression models from 0.79 (95% CI, 0.73–0.85) to 0.81 (95% CI, 0.74–0.86) (Figure 3B).
Table 4.
Multivariate Logistic Regression Analysis With Vascular Calcification as the Dependent Variable
| Variables | Odds Ratio | 95% CI | P Value |
|---|---|---|---|
| Vascular calcification presence (vs without) | |||
| Model 1a | |||
| Age (per year) | 1.03 | 1.003–1.06 | 0.029 |
| ALP, U/L | 1.014 | 1.002–1.03 | 0.018 |
| Fetuin‐A, μg/mL | 0.998 | 0.996–0.999 | 0.006 |
| Model 2b | |||
| ALP, U/L | 1.02 | 1.003–1.03 | 0.017 |
| Total cholesterol, mg/dL | 0.9 | 0.82–0.99 | 0.018 |
| Osteoprotegerin, pg/mL | 1.004 | 1.002–1.006 | 0.003 |
| Fetuin‐A, μg/mL | 0.998 | 0.996–0.999 | 0.004 |
| Circulating miR‐125b | 0.66 | 0.52–0.85 | 0.001 |
| Model 3c | |||
| ALP, U/L | 1.02 | 1.004–1.03 | 0.011 |
| Total cholesterol, mg/dL | 1.01 | 1.002–1.02 | 0.02 |
| Osteoprotegerin ≥400 | 2.1 | 1.001–4.68 | 0.04 |
| Ln(FGF‐23) | 1.22 | 1.03–1.45 | 0.025 |
| Fetuin‐A, μg/mL | 0.998 | 0.996–1.000 | 0.022 |
| Circulating miR‐125b | 0.67 | 0.52–0.85 | 0.001 |
ALP indicates alkaline phosphatase.
Adjusting for core vascular variables.
Adjusting for core vascular variables and circulating miR‐125b levels.
Adjusting for core vascular variables (excluding OPG levels), circulating miR‐125b levels, and OPG ≥400.
Discussion
In this study, we discovered that serum osteoprotegerin, fetuin‐A, and FGF‐23 levels were independently associated with serum miR‐125b among ESRD patients and younger age, shorter dialysis duration, and higher osteoprotegerin levels might be markers for high serum miR‐125b levels. Furthermore, we identified an optimal osteoprotegerin cutoff value for detecting high miR‐125b levels among these patients. We showed that serum miR‐125b and fetuin‐A were inversely associated with VC risk, while osteoprotegerin and FGF‐23 worked in the contrary. Adapting the serum osteoprotegerin threshold into regression models estimating VC risk might improve the overall ability to gauge VC besides other clinical features, thus having potential utility in clinical practice.
We discovered that higher serum osteoprotegerin was associated with high miR‐125b levels (Tables 2 and 3), but higher osteoprotegerin levels were associated with an increased risk of uremic VC (Table 4). Osteoprotegerin, a member of a tumor necrosis factor receptor family, acts as a soluble decoy receptor that competes for receptor activator of NF‐κB ligand and tumor necrosis factor –related apoptosis‐inducing ligand, thus preventing osteoclastic differentiation, as well as bone resorption.23 Osteoprotegerin can also reduce the amount of apoptotic bodies serving as nucleation sites for mineralization and suppress the action of ALP through blocking receptor activator of NF‐κB ligand, thereby inhibiting VC in vitro.24, 25 However, in clinical studies, higher serum osteoprotegerin levels have been consistently shown to correlate with more severe coronary artery calcification and aortic calcification cases,26, 27 revealing a discrepancy between the experimental role (anticalcification function) and clinical correlates of osteoprotegerin. Our findings are similar, showing that higher osteoprotegerin correlates with higher miR‐125b levels, a miRNA that inhibits calcification,11, 12 but also with a higher probability of VC. We believe that the association between osteoprotegerin and the clinical severity of calcification is reflective of a countermeasure to reduce calcification.28 In addition, chronic inflammation, a plausible mediator for uremic VC, has been found to stimulate the expression of osteoprotegerin in VSMCs, along with its capacity to up‐regulate ALP in the same cells.29, 30 This phenomenon might serve to underlie the discordant relationship between serum osteoprotegerin, miR‐125b, and VC status found in our study. The negative and positive associations between fetuin‐A and FGF‐23, and uremic VC status (Table 4), respectively, align with results from most literature,7, 31 lending support to the credibility of our findings.
Circulating miRNAs are newly emerging biomarkers with important clinical utility in the diagnosis of cardiovascular and metabolic diseases. However, the issue of their effect being confounded by other clinical features has been previously raised. Goretti et al have reported age and body mass index influenced several serum cardio‐miR levels among patients with myocardial infarctions.32 Others have also suggested that serum glucose levels, lipid levels, and glycated hemoglobin levels exhibit a significant association with serum miR‐144‐5p, miR‐1207‐5p, and miR‐625‐3p levels among individuals with metabolic syndrome.33 In this study, age and dialysis duration were found to be significant determinants of serum miR‐125b levels, suggesting that clinical features are potential modifiers of miRNA levels. Furthermore, we showed that while advanced age was associated with having low serum miR‐125b levels, the association between age and uremic VC disappeared after accounting for serum miR‐125b levels (models 2 and 3 in Table 4). Pilot studies have indicated that the levels of several circulating inflammation‐related or metabolism‐associated miRNAs decreased with higher patient age,34, 35 and the expression of miR‐125b reportedly attenuated inflammatory injuries in osteochondrogenic cells.36 This implies that miR‐125b might play an important role in modulating cellular susceptibility to inflammation in osteogenic cells, and putatively work the same in VSMCs acquiring the ability of calcium deposition. Since serum miR‐125b levels may be surrogates of tissue miR‐125b from the vascular wall, we speculate that the age‐associated alterations in circulating miRNAs, especially in miR‐125b levels, may be partially responsible for the increased risk of VC, which is further aggravated by a uremic environment. This is also supported by reports revealing that age‐related factors interact with plasma miR‐125b when modulating the risk of coronary artery disease,37 and age dictates the expression levels of miR‐125b in tissues like epidermis.38 In addition, the development and progression of uremic VC is often accelerated by increased dialysis vintage, which is possibly related to the accumulative injuries from CKD‐MBD pathogenic sequels and excessive exposure to calcium‐based phosphate binders. The independent relationship between increased dialysis vintage and serum miR‐125b levels we observed can be an underrecognized explanation for the risk of uremic VC brought on by longer periods of chronic dialysis.
It is interesting to find that besides osteoprotegerin levels, higher serum miR‐125b levels were also associated with increased FGF‐23 and fetuin‐A levels in ESRD patients (Table 3). Clinical studies rarely report a connection between FGF‐23 and miRNAs. To examine the biologic connections between miR‐125b and the studied factors, we further looked for differentially expressed genes associated with miR‐125b and FGF‐23/fetuin‐A (AHSG)/osteoprotegerin (TNFRSF11B), based on Kyoto Encyclopedia of Genes and Genomes pathway analysis and Reactome pathway enrichment approach, threaded in detail with miRNA‐protein and core protein‐protein interaction networks constructed using STRING (Search Tool for the Retrieval of Interacting Genes) version 9.1. We showed that Kyoto Encyclopedia of Genes and Genomes pathways enriched in the direct and indirect linkages between miR‐125b and FGF‐23/fetuinA/osteoprotegerin include NF‐κB signaling (gene count, 37; P=1.69×10⁻⁴), tumor necrosis factor signaling (gene count, 30; P=1.02×10⁻⁵), cellular senescence (gene count, 17; P=1.38×10⁻⁶), and vascular smooth muscle contraction (gene count, 9; P=1.23×10⁻⁸) (Figure 4), all of which play an important role in the pathogenesis of uremic VC. Our findings then provide the evidence for the existence of biologic and clinical associations between miR‐125b and these CKD‐MBD molecules.
Figure 4.
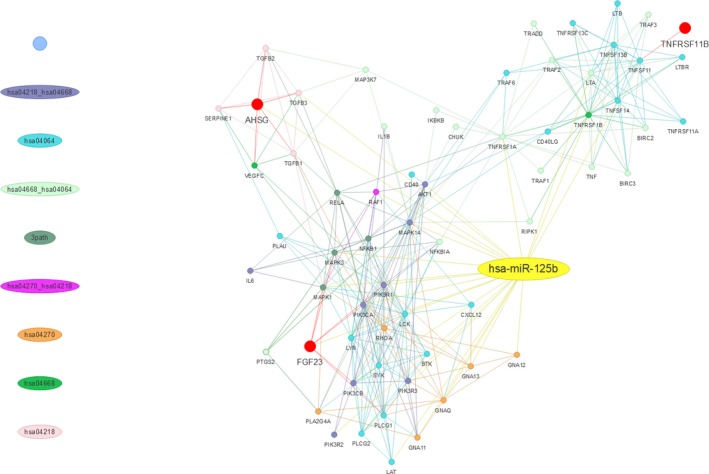
MiR‐125b‐protein and protein‐protein interaction network of differentially expressed genes, with particular focus on AHSG (fetuin‐A), FGF‐23, and TNFRSF11B (osteoprotegerin). hsa04064, NF‐κB signaling pathway; hsa04218, cellular senescence pathway; hsa04270, vascular smooth muscle contraction pathway; hsa04668, TNF signaling pathway. 3 path, hsa04064, hsa04218, and hsa04668. Lines of different colors represent the specific pathway(s) being enriched. TNF indicates tumor necrosis factor.
Based on miRNA target prediction software, prior studies proposed that miR‐197 and miR‐297a directly target FGF‐23 expression in aortas or phosphaturic tumors, although none were verified in vitro or in vivo.39, 40 Our study might be among the first few to show that in biologic fluids, serum FGF‐23 is closely associated with serum miRNA levels, but whether miR‐125b directly or indirectly regulates FGF‐23 expression remains to be investigated. Based on the bioinformatics results provided above (Figure 4), it is likely that both direct and indirect relationship could exist. Similarly, a direct or indirect relationship between fetuin‐A and miR‐125b has not been reported yet, but might be plausible in light of our analytic results (Figure 4). In addition, other reasons may account for our findings that serum fetuin‐A levels parallel miR‐125b levels. For instance, fetuin‐A can co‐localize with certain miRNAs with calcification‐regulatory capacity in extracellular vesicles (EVs) detectable in circulation. Indeed, fetuin‐A is selectively loaded into matrix vesicles secreted by VSMCs, and a selective loading of miRNAs that target osteoblast‐differentiation genes, including miR‐125b, into EVs has been demonstrated.41, 42 In this sense, the significant association between fetuin‐A and serum miR‐125b might be partially explained by the mechanism of EV‐influenced VC, although an indirect regulatory relationship in action is still possible.
Inflammation plays a key role in the propagation of uremic VC. Proinflammatory cytokines, including interleukin‐6 and tumor necrosis factor‐α, orchestrate the progression of vascular calcification through endocrine, paracrine, and autocrine mechanisms such as promoting endothelial dysfunction, proatherogenic influences, enhancing oxidative stress, and so on.43 The status of ESRD is frequently accompanied by chronic inflammation and higher levels of circulatory proinflammatory cytokines, and these factors, alongside other cardiovascular risk factors, may predispose individuals to vessel wall inflammation and the development of uremic VC.44, 45 Experimental studies revealed that miR‐125b expression was suppressed by lipopolysaccharide in several cell types, and miR‐125b directly targeted MIP‐1α and inhibited NF‐κB activation.36 It is likely that miR‐125b may influence the risk of uremic VC through modulating the molecular alterations underlying local vascular wall inflammation, although more evidence is still needed.
This study has its strength and limitations. The discovery that CKD‐MBD molecules exhibit significant correlations with serum miRNA levels has not been reported before and this relationship can help enhance current risk estimating models for uremic VC. However, this study is cross‐sectional in nature, thereby rendering the interpretation of causality between CKD‐MBD molecules and changes in miRNA levels difficult. We did not assay all the known CKD‐MBD molecules in this study, and residual influences exerted by other CKD‐MBD players may still be present. Nonetheless, the AUROCs of the regression models in this study were generally valid, and we believe that such influences are minor at best.
In conclusion, using a prospectively collected ESRD cohort, we revealed that serum osteoprotegerin, fetuin‐A, and FGF‐23 levels independently correlated with serum miR‐125b levels and all of them exhibited an association with uremic VC. Serum osteoprotegerin levels higher than 400 pg/mL and low serum miR‐125b levels synergistically enhance VC risk estimating ability using other clinical features in ESRD patients, supporting the importance of taking miR‐125b and osteoprotegerin levels into consideration during the estimation of VC risk.
Author Contributions
Study design: Chao, H.W. Chen; Data collection and analysis: Chao, Yuan, Yeh, Huang; Article drafting: Chao, Yuan, Yeh, Huang, H.W. Chen; All authors approved the final version of the manuscript.
Sources of Funding
The study is financially sponsored by National Taiwan University Hospital BeiHu Branch and the Ministry of Science and Technology, Taiwan (MOST 106‐2314‐B‐002‐132‐MY2, 106‐3114‐B‐038‐001‐, and 107‐2314‐B‐002‐244‐MY3). The sponsors have no role in the study design, data collection, analysis, and result interpretation of this study.
Disclosures
None.
Acknowledgments
We are grateful for the assistants of the microarray laboratory of the Genomic Center of National Taiwan University College of Medicine, Taipei, Taiwan.
(J Am Heart Assoc. 2019;8:e010805 DOI: 10.1161/JAHA.118.010805.)
References
- 1. Stevens PE, Lamb EJ, Levin A. Integrating guidelines, CKD, multimorbidity, and older adults. Am J Kidney Dis. 2015;65:494–501. [DOI] [PubMed] [Google Scholar]
- 2. Manjunath G, Tighiouart H, Coresh J, Macleod B, Salem DN, Griffith JL, Levey AS, Sarnak MJ. Level of kidney function as a risk factor for cardiovascular outcomes in the elderly. Kidney Int. 2003;63:1121–1129. [DOI] [PubMed] [Google Scholar]
- 3. Manjunath G, Tighiouart H, Ibrahim H, Macleod B, Salem DN, Griffith JL, Coresh J, Levey AS, Sarnak MJ. Level of kidney function as a risk factor for atherosclerotic cardiovascular outcomes in the community. J Am Coll Cardiol. 2003;41:47–55. [DOI] [PubMed] [Google Scholar]
- 4. Chronic Kidney Disease Prognosis Consortium , Matsushita K, van der Velde M, Astor BC, Woodward M, Levey AS, de Jong PE, Coresh J, Gansevoort RT. Association of estimated glomerular filtration rate and albuminuria with all‐cause and cardiovascular mortality in general population cohorts: a collaborative meta‐analysis. Lancet. 2010;375:2073–2081. [DOI] [PMC free article] [PubMed] [Google Scholar]
- 5. Temmar M, Liabeuf S, Renard C, Czemichow S, Esper NE, Shahapuni I, Presne C, Makdassi R, Andrejak M, Tribouilloy C, Galan P, Safar ME, Choukroun G, Massy Z. Pulse wave velocity and vascular calcification at different stages of chronic kidney disease. J Hypertens. 2010;28:163–169. [DOI] [PubMed] [Google Scholar]
- 6. Rennenberg RJ, Kessels AG, Schurgers LJ, van Engelshoven JM, de Leeuw PW, Kroon AA. Vascular calcifications as a marker of increased cardiovascular risk: a meta‐analysis. Vasc Health Risk Manag. 2009;5:185–197. [DOI] [PMC free article] [PubMed] [Google Scholar]
- 7. Evrard S, Delanaye P, Kamel S, Cristol JP, Cavalier E; SFBC/SN Joined Working Group on Vascular Calcifications . Vascular calcification: from pathophysiology to biomarkers. Clin Chim Acta. 2015;438:401–414. [DOI] [PubMed] [Google Scholar]
- 8. Vervloet M, Cozzolino M. Vascular calcification in chronic kidney disease: different bricks in the wall? Kidney Int. 2017;91:808–817. [DOI] [PubMed] [Google Scholar]
- 9. Nanoudis S, Pikilidou M, Yavropoulou M, Zebekakis P. The role of microRNAs in arterial stiffness and arterial calcification; an update and review of the literature. Front Genet. 2017;8:209. [DOI] [PMC free article] [PubMed] [Google Scholar]
- 10. Chao CT, Liu YP, Su SF, Yeh HY, Chen HY, Lee PJ, Chen WJ, Lee YM, Huang JW, Chiang CK, Hung KY, Chen HW. Circulating microRNA‐125b predicts and presence and progression of uremic vascular calcification. Arterioscler Thromb Vasc Biol. 2017;37:1402–1414. [DOI] [PubMed] [Google Scholar]
- 11. Goettsch C, Rauner M, Pacyna N, Hempel U, Bornstein SR, Hofbauer LC. miR‐125b regulates calcification of vascular smooth muscle cells. Am J Pathol. 2011;179:1594–1600. [DOI] [PMC free article] [PubMed] [Google Scholar]
- 12. Wen P, Cao H, Fang L, Ye H, Zhou Y, Jiang L, Su W, Xu H, He W, Dai C, Yang J. miR‐125b/Ets1 axis regulates transdifferentiation and calcification of vascular smooth muscle cells in a high‐phosphate environment. Exp Cell Res. 2014;322:302–312. [DOI] [PubMed] [Google Scholar]
- 13. Ohukainen P, Syväranta S, Näpänkangas J, Rajamaki K, Taskinen P, Peltonen T, Helske‐Suihko S, Kovanen PT, Ruskoaho H, Rysa J. MicroRNA‐125b and chemokine CCL4 expression are associated with calcific aortic valve disease. Ann Med. 2015;47:423–429. [DOI] [PubMed] [Google Scholar]
- 14. Hashimoto H, Iijima K, Hashimoto M, Son BK, Ota H, Ogawa S, Eto M, Akishita M, Ouchi Y. Validity and usefulness of aortic arch calcification in chest X‐ray. J Atheroscler Thromb. 2009;16:256–264. [DOI] [PubMed] [Google Scholar]
- 15. Ueno Y, Okuzumi A, Watanabe M, Tanaka Y, Shimada Y, Yamashiro K, Tanaka R, Hattori N, Urabe T. Cerebral small artery diseases may be associated with aortic arch calcification in stroke patients. J Atheroscler Thromb. 2014;21:1011–1021. [DOI] [PubMed] [Google Scholar]
- 16. Bannas P, Jung C, Blanke P, Treszi A, Derlin T, Adam G, Bley TA. Severe aortic arch calcification depicted on chest radiography strongly suggests coronary artery calcification. Eur Radiol. 2013;23:2652–2657. [DOI] [PubMed] [Google Scholar]
- 17. Shih M‐CP, Lee M‐Y, Huang J‐C, Tsai Y‐C, Chen J‐H, Chen S‐C, Chang J‐M, Chen H‐C. Association of brachial‐ankle pulse wave velocity and cardiomegaly with aortic arch calcification in patients on hemodialysis. Medicine (Baltimore). 2016;95:e3643. [DOI] [PMC free article] [PubMed] [Google Scholar]
- 18. Mitchell PS, Parkin RK, Kroh EM, Fritz BR, Wyman SK, Pogosova‐Agadjanyan EL, Peterson A, Noteboom J, O'Briant KC, Allen A, Lin DW, Urban N, Drescher CW, Knudsen BS, Stirewalt DL, Gentleman R, Vessella RL, Nelson PS, Martin DB, Tewari M. Circulating microRNAs as stable blood‐based markers for cancer detection. Proc Natl Acad Sci U S A. 2008;105:10513–10518. [DOI] [PMC free article] [PubMed] [Google Scholar]
- 19. Kroh EM, Parkin RK, Mitchell PS, Tewari M. Analysis of circulating microRNA biomarkers in plasma and serum using quantitative reverse transcription‐PCR (qRT‐PCR). Methods. 2010;50:298–301. [DOI] [PMC free article] [PubMed] [Google Scholar]
- 20. Arroyo JD, Chevillet JR, Kroh EM, Ruf IK, Pritchard CC, Gibson DF, Mitchell PS, Bennett CF, Pogosova‐Agadjanyan EL, Stirewalt DL, Tait JF, Tewari M. Argonaute2 complexes carry a population of circulating microRNAs independent of vesicles in human plasma. Proc Natl Acad Sci U S A. 2011;108:5003–5008. [DOI] [PMC free article] [PubMed] [Google Scholar]
- 21. Yamada A, Cox MA, Gaffney KA, Moreland A, Boland CR, Goel A. Technical factors involved in the measurement of circulating microRNA biomarkers for the detection of colorectal neoplasia. PLoS One. 2014;9:e112481. [DOI] [PMC free article] [PubMed] [Google Scholar]
- 22. Liabeuf S, Okazaki H, Desjardins L, Fliser D, Goldsmith D, Covic A, Wiecek A, Ortiz A, Martinez‐Castelao A, Lindholm B, Suleymanlar G, Mallamaci F, Zoccali C, London G, Massy ZA. Vascular calcification in chronic kidney disease: are biomarkers useful for probing the pathobiology and the health risks of this process in the clinical scenario? Nephrol Dial Transplant. 2014;29:1275–1284. [DOI] [PubMed] [Google Scholar]
- 23. Simonet WS, Lacey DL, Dunstan CR, Kelley M, Chang MS, Luthy R, Nguyen HQ, Wooden S, Bennett L, Boone T, Shimamoto G, DeRose M, Elliott R, Colombero A, Tan HL, Trail G, Sullivan J, Davy E, Bucay N, Renshaw‐Gegg L, Hughes TM, Hill D, Pattison W, Cambell P, Sander S, Van G, Tarpley J, Derby P, Lee R, Boyle WJ. Osteoprotegerin: a novel secreted protein involved in the regulation of bone density. Cell. 1997;89:309–319. [DOI] [PubMed] [Google Scholar]
- 24. Hofbauer LC, Brueck CC, Shanahan CM, Schoppet M, Dobnig H. Vascular calcification and osteoporosis—from clinical observation towards molecular understanding. Osteoporos Int. 2007;18:251–259. [DOI] [PubMed] [Google Scholar]
- 25. Morony S, Tintut Y, Zhang Z, Cattley C, Van G, Dwyer D, Stolina M, Kostenuik PJ, Demer LL. Osteoprotegerin inhibits vascular calcification without affecting atherosclerosis in ldlr(‐/‐) mice. Circulation. 2008;117:411–420. [DOI] [PMC free article] [PubMed] [Google Scholar]
- 26. Clancy P, Oliver L, Jayalath R, Buttner P, Golledge J. Assessment of a serum assay for quantification of abdominal aortic calcification. Arterioscler Thromb Vasc Biol. 2006;26:2574–2576. [DOI] [PubMed] [Google Scholar]
- 27. Abedin M, Omland T, Ueland T, Khera A, Aukrust P, Murphy SA, Jain T, Gruntmanis U, McGuire DK, de Lemos JA. Relation of osteoprotegerin to coronary calcium and aortic plaque (from the Dallas Heart Study). Am J Cardiol. 2007;99:513–518. [DOI] [PubMed] [Google Scholar]
- 28. Van Campenhout A, Golledge J. Osteoprotegerin, vascular calcification and atherosclerosis. Atherosclerosis. 2009;204:321–329. [DOI] [PMC free article] [PubMed] [Google Scholar]
- 29. Zhang J, Fu M, Myles D, Zhu X, Du J, Cao X, Chen YE. PDGF induces osteoprotegerin expression in vascular smooth muscle cells by multiple signal pathways. FEBS Lett. 2002;521:180–184. [DOI] [PubMed] [Google Scholar]
- 30. Tintut Y, Patel J, Territo M, Saini T, Parhami F, Demer LL. Monocyte/macrophage regulation of vascular calcification in vitro. Circulation. 2002;105:650–655. [DOI] [PubMed] [Google Scholar]
- 31. Nasrallah MM, El‐Shehaby AR, Salem MM, Osman NA, El Sheikh E, Sharaf El Din UAA. Fibroblast growth factor‐23 (FGF‐23) is independently correlated to aortic calcification in haemodialysis patients. Nephrol Dial Transplant. 2010;25:2679–2685. [DOI] [PubMed] [Google Scholar]
- 32. Goretti E, Vausort M, Wagner DR, Devaux Y. Association between circulating microRNAs, cardiovascular risk factors and outcome in patients with acute myocardial infarction. Int J Cardiol. 2013;168:4548–4550. [DOI] [PubMed] [Google Scholar]
- 33. Raitoharju E, Seppälä I, Oksala N, Lyytikainen LP, Raitakari O, Viikari J, Ala‐Korpela M, Soininen P, Kangas AJ, Waldenberger M, Klopp N, Illig T, Leiviska J, Loo BM, Hutri‐Kahonen N, Kahonen M, Laaksonen R, Lehtimaki T. Blood microRNA profile associates with the levels of serum lipids and metabolites associated with glucose metabolism and insulin resistance and pinpoints pathways underlying metabolic syndrome: the cardiovascular risk in Young Finns Study. Mol Cell Endocrinol. 2014;391:41–49. [DOI] [PubMed] [Google Scholar]
- 34. Hooten NN, Fitzpatrick M, Wood WH, De S, Ejiogu N, Zhang Y, Mattison JA, Becker KG, Zonderman A, Evans MK. Age‐related changes in microRNA levels in serum. Aging. 2013;5:725–740. [DOI] [PMC free article] [PubMed] [Google Scholar]
- 35. Zhang H, Yang H, Zhang C, Jing Y, Wang C, Liu C, Zhang R, Wang J, Zhang J, Zen K, Zhang C, Li D. Investigation of microRNA expression in human serum during the aging process. J Gerontol A Biol Sci Med Sci. 2015;70:102–109. [DOI] [PubMed] [Google Scholar]
- 36. Jia J, Wang J, Zhang J, Cui M, Sun X, Li Q, Zhao B. MiR‐125b inhibits LPS‐induced inflammatory injury via targeting MIP‐1α in chondrogenic cell ATDC5. Cell Physiol Biochem. 2018;45:2305–2316. [DOI] [PubMed] [Google Scholar]
- 37. Ding X‐Q, Ge P‐C, Liu Z, Jia H, Chen X, An FH, Li LH, Chen ZH, Mao HW, Li ZY, Gu Y, Zhu TB, Li CJ, Wang LS, Ma WZ, Yang ZJ, Jia EZ. Interaction between microRNA expression and classical risk factors in the risk of coronary heart disease. Sci Rep. 2015;5:14925. [DOI] [PMC free article] [PubMed] [Google Scholar]
- 38. Toyokuni S, Jiang L, Wang S, Hirao A, Wada T, Soh C, Toyama K, Kawada A. Aging rather than sun exposure is a major determining factor for the density of miR‐125b‐positive epidermal stem cells in human skin. Pathol Int. 2015;65:415–419. [DOI] [PubMed] [Google Scholar]
- 39. Zheng S, Zhang S, Song Y, Guo W, Zhai W, Qiu X, Li J. MicroRNA‐297a regulates vascular calcification by targeting fibroblast growth factor 23. Iran J Basic Med Sci. 2016;19:1331–1336. [DOI] [PMC free article] [PubMed] [Google Scholar]
- 40. Green D, Mohorianu I, Piec I, Turner J, Beadsmoore C, Toms A, Ball R, Nolan J, McNamara I, Dalmay T, Fraser WD. MicroRNA expression in a phosphaturic mesenchymal tumour. Bone Rep. 2017;7:63–69. [DOI] [PMC free article] [PubMed] [Google Scholar]
- 41. Kapustin AN, Chatrou ML, Drozdov I, Zheng Y, Davidson SM, Soong D, Furmanik M, Sanchis P, De Rosales RT, Alvarez‐Hernandez D, Shroff R, Yin X, Muller K, Skepper JN, Mayr M, Reutelingsperger CP, Chester A, Bertazzo S, Schurgers LJ, Shanahan CM. Vascular smooth muscle cell calcification is mediated by regulated exosome secretion. Circ Res. 2015;116:1312–1323. [DOI] [PubMed] [Google Scholar]
- 42. Krohn JB, Hutcheson JD, Martínez‐Martínez E, Aikawa E. Extracellular vesicles in cardiovascular calcification: expanding current paradigms. J Physiol. 2016;594:2895–2903. [DOI] [PMC free article] [PubMed] [Google Scholar]
- 43. Stenvinkel P, Ketteler M, Johnson RJ, Lindholm B, Pecoits‐Filho R, Riella M, Heimburger O, Cederholm T, Girndt M. IL‐10, IL‐6, and TNF‐α: central factors in the altered cytokine network of uremia—the good, the bad, and the ugly. Kidney Int. 2005;67:1216–1233. [DOI] [PubMed] [Google Scholar]
- 44. Strobl FF, Rominger A, Wolpers S, Rist C, Bamberg F, Thierfelder KM, Nikolaou K, Uebleis C, Hacker M, Reiser MF, Saam T. Impact of cardiovascular risk factors on vessel wall inflammation and calcified plaque burden differs across vascular beds: a PET‐CT study. Int J Cardiovasc Imaging. 2013;29:1899–1908. [DOI] [PubMed] [Google Scholar]
- 45. Chao CT, Hsu YH, Chang PY, He YT, Ueng RS, Lasi CF, Chiang CK, Huang JW, Huang SJ. Simple self‐report FRAIL scale might be more closely associated with dialysis complications than other frailty screening instruments in rural chronic dialysis patients. Nephrology. 2015;20:321–328. [DOI] [PubMed] [Google Scholar]