Abstract
In this study, we use Monte Carlo modelling to investigate the effect of tissue optical properties on Cherenkov emission detected from tissue surface. MC simulations are performed for wavelength between 400-1000nm and the values of absorption coefficient at each wavelength are determined based on the molar extinction coefficients of oxy- and deoxy-hemoglobin, with varying total haemoglobin concentration and tissue oxygen saturation of 70%. Tissue reduced scattering coefficient is approximated using μs’(λ) = Aλ−0.838. A range of clinically relevant tissue optical properties was investigated, with absorption coefficient between 0.1 and 1 cm−1 and reduced scattering coefficient between 5 and 40 cm−1 at 665nm. The angular distribution, depth of origins and the effect of tissue optical properties on Cherenkov emission on tissue surface are evaluated.
Keywords: MC simulation, light propagation, Cherenkov emission, total skin electron beam therapy, tissue optical properties, angular distribution, depth of origins
INTRODUCTION
One major challenge of total skin electron beam therapy (TSET) is to deliver a homogenous dose over the entire irregular skin surface. The delivered dose can also deviate from prescribed dose due to setup positioning uncertainties and potential patient movements during TSET. Therefore, there is a need for a quick and simple method to monitor dose delivery to ensure more homogenous dose delivery and to provide a new method for TSET protocol commissioning. Cherenkov radiation is an electromagnetic radiation emitted from transmission of a charged particle through a dielectric medium at a speed greater than the phase velocity of light in that medium[1, 2]. Cherenkov light signal can be generated when high energy photon and electron pass through human tissues. Studies have demonstrated that Cherenkov emission from tissue surface can be used to visualize radiation dose deposition on patient during electron therapy[3]. Linear relationship between the Cherenkov signal intensity and locally deposited dose further suggests that Cherenkov emission can be used for quality assurance and in vivo dosimetry to assess spatial dose distribution especially in TSET.
The implementation of Cherenkov imaging offers an excellent technology to detect abnormalities in the treatment, which would otherwise go unnoticed. However, there are factors that can alter the linearity between dose and Cherenkov signal, for instance, tissue optical properties. Spatial heterogeneity in optical properties due to different tissue sites, skin pigmentation and discoloration, is commonly encountered in patients and may easily be misinterpreted as non-uniformity of dose deposition if this is not corrected for carefully. Besides intra-patient heterogeneity, optical properties of human tissues can vary greatly across patients. Thus, it impossible to use a universal equation to convert Cherenkov intensity to dose since the Cherenkov-dose conversion ratio may differs within and across patients. Furthermore, depending on the tissue optical properties, the thickness/volume of the superficial layer where the Cherenkov photons are generated could also be very different.
In this study, we use Monte Carlo simulations to evaluate the effect of skin optical properties on Cherenkov emission detected from skin surface. We simulate the spectrum of Cherenkov emission from 400nm to 1000nm for a range of clinically relevant tissue optical properties at 665nm (μa = 0.1 – 1 cm−1, μs’= 5 – 40 cm−1) based on a review on the in-vivo tissue optical properties[4]. The absorption coefficient at each wavelength was determined based on the absorption spectra of oxy- and deoxyhaemoglobin. The reduced scattering coefficient at each wavelength was approximated based on Mie scattering theory, μa’(λ) = Aλ−b. The effect of tissue optical properties on the emission spectrum, angular distribution and depth of origin of Cherenkov light detected on tissue surface were systematically evaluated.
METHODS
Monte Carlo modelling of Cherenkov emission
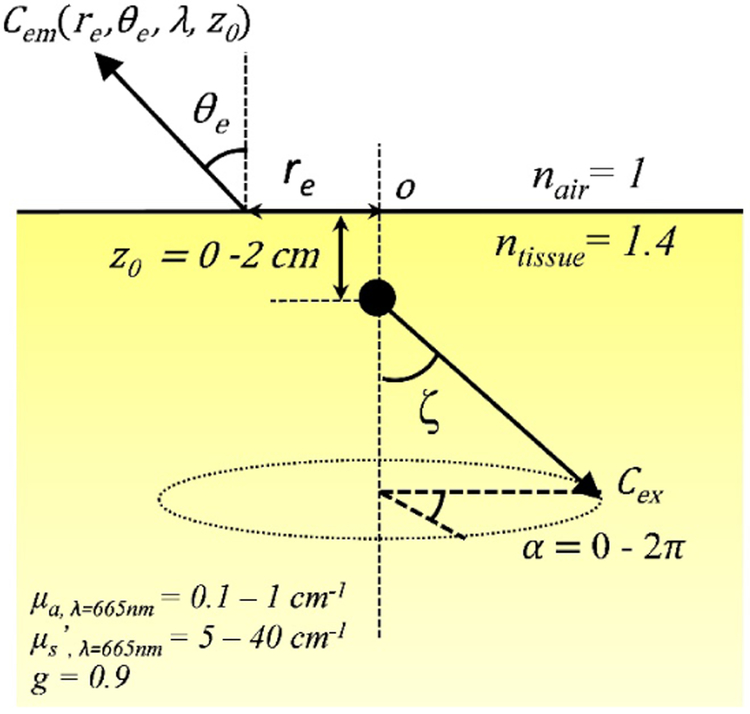
The Monte Carlo algorithm used here was written in Matlab (The Mathworks Inc., Natick, MA.) as described previously [5-7]. The setup geometry to be calculated by Monte-Carlo simulation for a semi-infinite medium with uniform optical properties is shown in Figure 1. The anisotropy g factor is 0.9 and refraction mismatch is 1.4 (nair = 1 and ntissue 1.4). Cherenkov photons are generated uniformly along a cone parallel to the central axis (of particle propagation) from below the surface, z0 = 0 cm to 2 cm into tissue. The half angle of the cone, also known as the Cherenkov angle ζ was set at 43.5°, which corresponds to 3MeV electron beam energy. The maximum depth of Cherenkov generation in this study was 2 cm as photons generated beyond this depth are unlikely to propagate and escape from tissue surface.
Figure 1.
Setup geometry for Monte-Carlo simulation for a semi-infinite turbid medium.
A million Cherenkov photons were run for each Monte Carlo simulation. When a photon is launched, z0 and α are randomly determined between 0 and 2 cm and between 0 and 2π, respectively. λ is randomly selected between 400 – 1000 nm with 4 nm spacing. Depending on the λ selected, μa and μs’ and the initial weight of the photon will be determined from the spectra as shown in Figures 2(a) - (c). The initial weight of photon was set to 1 for 400 nm and the initial photon weight for other wavelengths were determined based on λ−2 relationship. The absorption spectrum was determined based on the molar extinction coefficients of oxy- (HbO2) and deoxy-hemoglobin (Hb), with tissue oxygen saturation of 70% ([HbO2]/([HbO2]+[Hb])=0.7). Oxy- and deoxy-hemoglobins are assumed to be the primary light absorbers in tissue. The range of tissue absorption simulated in this study, between 0.1 - 1 cm−1 at 665nm, was shown by the dashed lines in Figure 2(a), corresponding to total haemoglobin concentration between 41.9 – 419 μM. Reduced scattering spectrum was determined based on Mie scattering theory, μs’ (λ) = Aλ−b as shown in Figure 2(b). The value of b used in this study was 0.838, as reported by Jacques[8] for skin epidermis and dermis tissues. The range of reduced scattering coefficient simulated in this study was between 5 – 40 cm−1 at 665nm.
Figure 2.
Spectra of (a) absorption coefficient μa, (b) reduced scattering coefficient μs’, and (c) initial photon weight over wavelength range between 400 – 1000nm. Solid lines in (a) and (b) represent the spectra of average tissue optical properties measured in patients [2], for which μa and μs’ at 665nm are 0.3 cm−1 and 10 cm−1 as indicated by ‘x’. Dashed lines in (a) and (b) represent the maximum and minimum tissue optical properties spectra used in MC simulations. The ranges of μa and μs’ at 665nm are 0.1 – 1 cm−1 and 5 – 40 cm−1, as indicated by ‘x’.
After a Cherenkov photon is launched, it is traced through multiple scattering events until it escapes the medium or falls below a threshold weight, triggering a random roulette process. In the roulette process, a photon has a one in ten chances of surviving with ten times its initial weight and nine in ten chance of being terminated. At the end of each step, the photon weight is reduced by a factor of 1-a’, where () and a new scattering angle is determined based on the optical properties of the medium. Specular reflection at the surface, resulting from the refractive index mismatch (ni1/n2=1.4), is calculated by the Fresnel reflectance for unpolarized light. Fractional Cherenkov photons (Cem) escaping the air-tissue interface are scored as a function of lateral radius re, exiting angle θe, wavelength λ and depth of origin z0. The reciprocity theorem is used to calculate diffuse reflected Cherenkov light for a broad incident electron beam [9].
RESULTS AND DISCUSSION
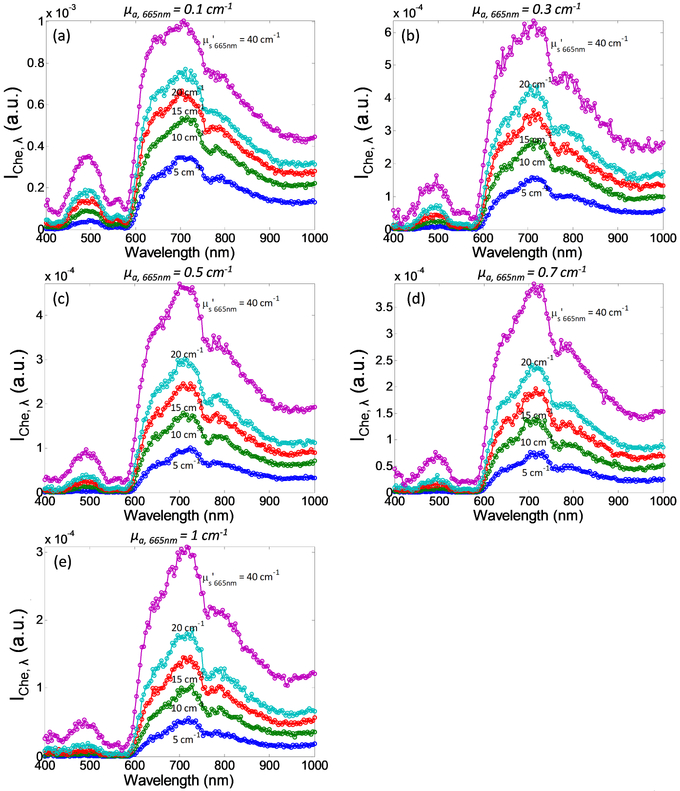
Figure 3 shows spectra of Cherenkov emission, between 400 – 1000nm, simulated by MC modeling for a range of optical properties at 665nm (μa,665nm = 0.1 - 1 cm−1 and μs’665nm = 5 - 40 cm−1). Although most Cherenkov radiation is in the ultraviolet spectrum, Cherenkov emission detected on tissue surface is mainly comprised of deep-tissue penetrating red photons. Instead of the color of brilliant blue in which visible Cherenkov radiation is observed to be, one should expect the detected Cherenkov emission from tissue surface to be red in color. The intensity of Cherenkov emission below 600nm is relatively low due to high absorption of oxy and de-oxyhemoglobin. The intensity of Cherenkov emission is the highest in the “biological window”, between 600 – 800nm, with a peak at 710nm and tail off at higher wavelength due to the λ−2 dependence of the Cherenkov radiation. The overall intensity of Cherenkov emission decreases with increasing tissue absorption, as can be observed from the reduction in peak intensity of each spectrum from Figure 3(a) through 3(e). On the other hand, the intensity of detected Cherenkov emission increases with increasing tissue scattering as can be seen from the increase in peak intensity of the 5 spectra with different colors in each plot.
Figure 3.
Cherenkov emission spectra as a function of absorption coefficient at 665nm, μa,665nm = (a) 0.1 cm−1, (b) 0.3 cm−1, (c) 0.5 cm−1, (d) 0.7 cm−1, and (e) 1 cm−1, and reduced scattering coefficient at 665nm, μs’665nm (from bottom to top: 5 cm−1, 10 cm−1, 15 cm−1, 20 cm−1, and 40cm−1). Iche,λ is defined as ∫∫∫ Cem(r, θe, λ, z0)rdrdθdz.
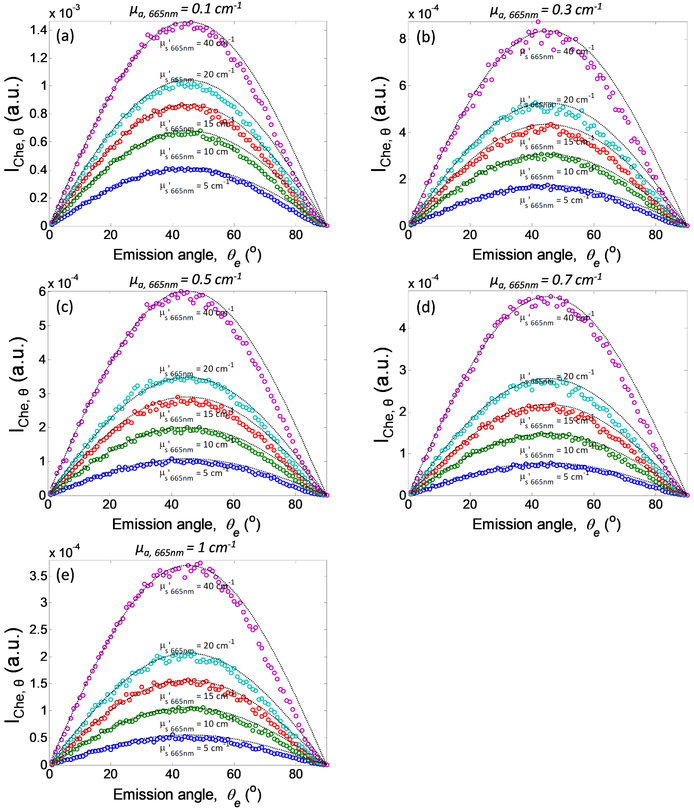
Figure 4 shows the angular distribution of the Cherenkov emission, for different optical properties. Based on the conservation of the number of photons, diffuse reflectance rd is related to radiance L by rd·dθ=L·dΩ/ϕin, where ϕin = incident fluence rate, Ω is the solid angle and dΩ=2πsinθdθ. Thus L = rd·ϕin /2πsinθ. In this simulation, Cem is equivalent to rd and the in-tissue Cherenkov radiation fluence rate is equivalent to ϕin In general, results in Figure 4 show that the angular dependence of the MC calculated Cem follows a function of sin2θ=2sinθcosθ for all optical properties examined. The function sin2θ was plotted and overlaid on each simulation result as dotted lines. As a result, we can conclude that the Cherenkov emission follows the Lambertian distribution (L∝ cosθ), with exception for small deviations from the analytical theory when the photons exit approximately parallel to the tissue surface (at large exit angles). Of more interest, these results suggest that there is no angular dependence of Cherenkov emission on tissue surface due to the generation of Cherenkov radiation at a specific angle in tissue.
Figure 4.
Angular distribution of Cherenkov emission as a function of absorption coefficient at 665nm, μa,665nm = (a) 0.1 cm−1, (b) 0.3 cm−1, (c) 0.5 cm−1, (d) 0.7 cm−1, and (e) 1 cm−1, and reduced scattering coefficient at 665nm, μs’665nm (from bottom to top: 5 cm−1, 10 cm−1, 15 cm−1, 20 cm−1, and 40cm−1). Lambertian distribution function sin2θ is plotted and overlay on each simulation for different optical properties. IChe,θ is defined as ∫∫∫ Cem(r, θe, λ, z0)rdrdλdz.
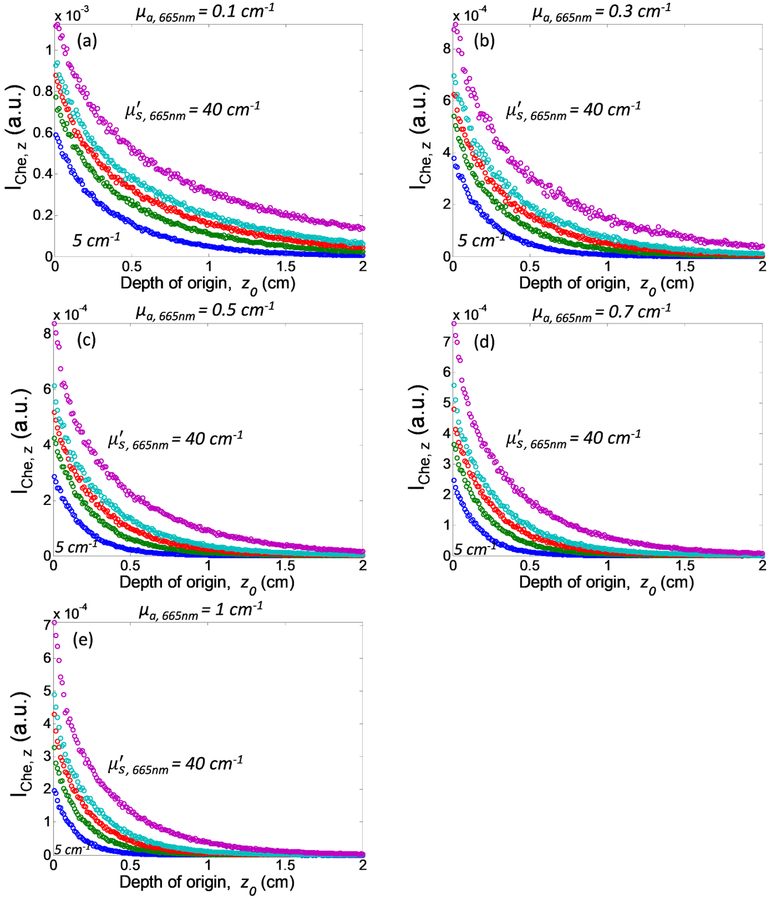
Figure 5 examines the depth of origin of Cherenkov emission detected from tissue surface as a function of optical properties. As we can see, most detected Cherenkov photons originate from superficial tissue layers. The number of Cherenkov photons emitted from tissue surface reduces exponentially as the depth of origin increases, with negligible contribution from tissue depth greater than 2 cm for all optical properties. Lower tissue absorption and higher tissue scattering can both extend the depth of origin of the detected Cherenkov emission.
Figure 5.
Depth of origin of Cherenkov emission as a function of absorption coefficient at 665nm, μa,665nm = (a) 0.1 cm−1, (b) 0.3 cm−1, (c) 0.5 cm−1, (d) 0.7 cm−1, and (e) 1 cm−1, and reduced scattering coefficient at 665nm, μs’665nm (from bottom to top: 5 cm−1, 10 cm−1, 15 cm−1, 20 cm−1, and 40cm−1). Iche,z. is defined as ∫∫∫ Cem(r, θe, λ, z0)rdrdθdλ.
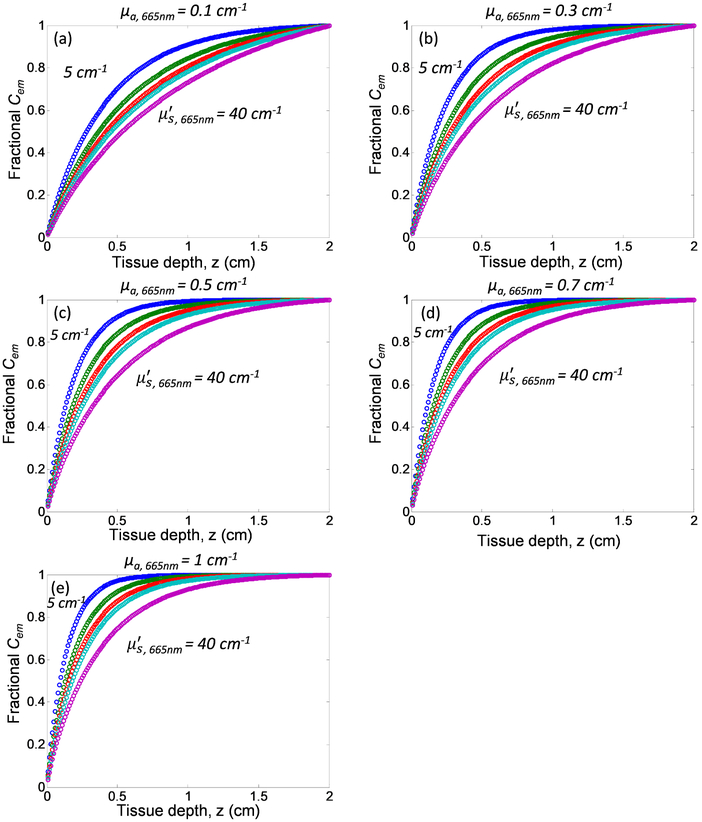
To better understand the depth contribution of Cherenkov emitted from tissue with different tissue optical properties, we quantify the fractional Cherenkov intensity, fCem as a function of tissue depth as shown in Figure 6. Fractional Cherenkov intensity is defined as Contribution of Cherenkov emission from deeper tissue layers increases with increasing tissue scattering and decreasing tissue absorption. Most of the detected Cherenkov emission from tissue surface are contributed by the Cherenkov radiation generated from the superficial layers as can be seen from the steep increase of the curves in Figure 6, follow by a plateau at different tissue depth for different tissue optical properties. For the range of optical properties investigated in this study, 80% of the detected Cherenkov emission originate from 2.3 mm to 11.8 mm of the superficial tissue layers, with a tissue thickness of 5.5 mm for mean optical properties μa = 0.3 cm−1 and μs’ = 10 cm−1 at 665nm. As these tissue thicknesses are larger than the mean-free path l=1/(μa+μs’) for the corresponding tissue optical properties, the direction of propagation of Cherenkov photon is randomized before escaping from the surface. This finding is in accordance with results shown in Figure 4, in which the Cherenkov emission on tissue surface follows Lambertian distribution. However, it should be noted that Table 1 summarizes the thickness of the superficial layer that contributes 80% of the entire Cherenkov emission detected from tissue surface.
Figure 6.
Fractional Cherenkov emission as a function of tissue depth and optical properties: absorption coefficient at 665nm, μa,665nm = (a) 0.1 cm−1, (b) 0.3 cm−1, (c) 0.5 cm−1, (d) 0.7 cm−1, and (e) 1 cm−1, and reduced scattering coefficient at 665nm, μs’665nm (from top to bottom: 5 cm−1, 10 cm−1, 15 cm−1, 20 cm−1, and 40cm−1).
Table 1.
Thickness of superficial tissue layers (mm) that contributes 80% of surface Cherenkov emission for tissue optical properties μa,665nm = 0.1 - cm−1 and μs’665nm = 5 - 40 cm−1.
| μa, 665nm╲μs’665nm | 5 cm−1 | 10 cm−1 | 15 cm−1 | 20 cm−1 | 40 cm−1 |
|---|---|---|---|---|---|
| 0.1 cm−1 | 6.6 mm | 8.6 mm | 9.7 mm | 10.5 mm | 11.8 mm |
| 0.3 cm−1 | 4.0 mm | 5.5 mm | 6.6 mm | 7.4 mm | 9.4 mm |
| 0.5 cm−1 | 3.1 mm | 4.3 mm | 5.3 mm | 6.0 mm | 7.9 mm |
| 0.7 cm−1 | 2.6 mm | 3.7 mm | 4.5 mm | 5.2 mm | 7.0 mm |
| 1 cm−1 | 2.3 mm | 3.2 mm | 3.9 mm | 4.4 mm | 6.0 mm |
Lastly, we evaluated the effect of tissue optical properties on the total Cherenkov emission. Total Cherenkov emission is defined as ∫ ∫ ∫ ∫ Celtl(r,θe,λ, z0)rdrdθdλ dz. Cherenkov emission normalized to the mean optical properties at 665nm, μa,665nm = 0.3 cm−1 μs’,665nm = 10 cm−1, was plotted against absorption coefficient, reduced scattering coefficient and diffuse reflectance at 665nm as shown in Figure 7. Figure 7(a) shows that Cherenkov emission decreases with increasing tissue absorption and Figure 7(b) shows that Cherenkov emission increases with tissue scattering. Figure 7(c) shows that tissue optical properties dependence of Cherenkov emission can be expressed in one dimensional function of diffuse reflectance using equation y=0.117e4.879Rd with R2 value of 0.9986. This finding suggests an analytical correction method based on diffuse reflectance for Cherenkov emission intensity variation due to tissue optical properties heterogeneities.
Figure 7.
Normalized Cherenkov emission as a function of (a) absorption coefficient, (b) reduced scattering coefficient and (c) diffuse reflectance at 665nm.
It should be noted that optically homogenous single layer semi-infinite tissue geometry used in this study was an oversimplification of skin tissue which is well known to have multi-layered structure with distinct tissue optical properties. Uniform Cherenkov photon generation along the central axis is assuming constant electron beam energy up to 2 cm tissue depth. Although the findings in this study provide a good representation of Cherenkov emission from skin surface, simulations using a more realistic multi-layered tissue geometry, and generating Cherenkov photons based on in-tissue axial electron beam energy profile should produce more accurate results that represent Cherenkov emission during total skin electron therapy.
CONCLUSION
As a conclusion, we simulated Cherenkov generation and propagation in a semi-infinite tissue geometry with homogenous optical properties and demonstrated that changes in tissue optical properties can significantly altered the Cherenkov emission on tissue surface. Cherenkov emission increases with tissue scattering and decreases with increasing tissue absorption. The optical properties dependence of Cherenkov emission can be expressed in one dimensional function of diffuse reflectance using equation y=0.117e4.879Rd. Cherenkov emission is comprised primarily of Cherenkov radiation generated from superficial tissue layers. 80% of the surface Cherenkov emission can originate from 2.3 mm to 11.8 mm of superficial tissue layers for the range of optical properties investigated in this study, with a mean tissue thickness of 5.5 mm at μa,665nm = 0.3 cm−1 μs’,665nm = 10 cm−1. Angle specific generation of Cherenkov radiation in tissue has no effect on the angular dependence of Cherenkov emission on tissue surface as the angular distribution of Cherenkov emission follows Lambert’s law.
ACKNOWLEDGEMENTS
This work is supported by grants from the National Institute of Health (NIH) R01 CA154562 and P01 CA87971 and the University of Pennsylvania Department of Radiation Oncology.
REFERENCES
- [1].Rongxiao Z, et al. , "Superficial dosimetry imaging of Cerenkov emission in electron beam radiotherapy of phantoms," Phys. Med. Biol. 58(16), 5477 (2013). [DOI] [PMC free article] [PubMed] [Google Scholar]
- [2].Xie Y, et al. , "Cherenkov imaging for Total Skin Electron Therapy (TSET)," Proc. SPIE 10478, 1047816 (2018). [Google Scholar]
- [3].Tien PK, Ulrich R, and Martin RJ, "Optical Second Harmonic Generation in Form of Coherent Cerenkov Radiation from A Thin-Film Waveguide," Appl. Phys. Lett. 17(10), 447–450 (1970). [Google Scholar]
- [4].Sandell JL and Zhu TC, "A review of in-vivo optical properties of human tissues and its impact on PDT," J Biophotonics 4(11-12), 773–87 (2011). [DOI] [PMC free article] [PubMed] [Google Scholar]
- [5].Ong YH, Finlay JC, and Zhu TC, "Monte Carlo modeling of fluorescence in semi-infinite turbid media," Proc. SPIE 10492,104920T (2018). [DOI] [PMC free article] [PubMed] [Google Scholar]
- [6].Lambson K, et al. , "A theoretical and experimental examination of fluorescence in enclosed cavities," Proc. SPIE 8568, 85680B (2013). [DOI] [PMC free article] [PubMed] [Google Scholar]
- [7].Ong YH, et al. , "PDT dose dosimetry for Photofrin-mediated pleural photodynamic therapy (pPDT)," Phys. Med. Biol. 63(1), 015031 (2017). [DOI] [PMC free article] [PubMed] [Google Scholar]
- [8].Jacques SL, "Optical assessment of cutaneous blood volume depends on the vessel size distribution: a computer simulation study," J Biophotonics 3(1-2), 75–81 (2010). [DOI] [PubMed] [Google Scholar]
- [9].Ong YH and Zhu TC, "Analytic function for predicting light fluence rate of circular fields on a semi-infinite turbid medium," Opt. Exp. 24(23), 26261–26281 (2016). [DOI] [PMC free article] [PubMed] [Google Scholar]


