

Abstract
Aims/Introduction
The aim of the present study was to obtain a full view of the changes of urinary complement activation products in the development of diabetic nephropathy and explore their possible significance in the disease process.
Materials and methods
A total of 62 patients at different stages of diabetic nephropathy, 20 diabetes patients without nephropathy and 20 healthy persons were enrolled. Urinary complement activation products, including C3a, C5a and C5b‐9, were measured, and their associations with the progression of the disease were analyzed.
Results
The urinary complement activation products increased markedly since the proteinuria stage, and were parallel with the progression of diabetic nephropathy. More severe renal tubular damage was observed in patients with higher levels of urinary complement activation products. The urinary complement activation products levels correlated closely with renal tubulointerstitial injury score and relative tubular interstitial volume. Multivariate regression analysis showed that elevated urinary complement activation products were independent risk factors for tubular injury in diabetic nephropathy patients.
Conclusions
Urinary complement activation might have a role in renal tubular interstitial injury in patients with diabetic nephropathy, especially in patients at a later stage of the disease.
Keywords: Diabetic nephropathy, Tubular injury, Urinary complement activation products
Introduction
Diabetic nephropathy (DN) is the leading cause of end‐stage renal disease worldwide, affecting approximately 25–30% of those with diabetes1, 2. Despite extensive efforts, the pathogenic mechanism of DN has not been completely understood. No satisfactory therapeutic option is now available to treat this insidious disease2, 3, 4.
The pathogenesis of DN is multifactorial. Recent studies suggested that complement might be involved in the progression of DN5. However, the exact significance and underlying mechanism are far from clear. Increased urinary complement activation products (CAPs) have been reported in proteinuric kidney diseases including DN6, 7, 8, 9, 10, 11, 12. However, the exact significance of urinary CAPs in DN is still unclear. Of note, previous studies examined urinary CAPs mainly in DN patients at an advanced stage of the disease. No observation of urinary CAPs in the earlier stages of the disease has been made. As DN is a highly heterogeneous disease13, the extent and significance of urinary complement activation might differ among patients in different conditions; for example, patients of different pathological types and patients at different stages of the disease.
To obtain a full view of the changes of urinary CAPs in the development of DN and explore their possible pathological significance, in the present study, we investigated the changes of urinary CAPs, including C3a, C5a and C5b‐9, in patients at different stages of DN and associated them with renal tubular damage.
Methods
Study population
Studies were carried out in 62 biopsy‐proven type 2 DN patients, 20 type 2 diabetes mellitus patients who had normal findings in urinary examinations and renal function tests (9 men and 11 women with a mean age of 48 ± 8 years, a mean urinary albumin excreting ratio of 10.5 ± 3.4 mg/24 h and mean estimated glomerular filtration rate [eGFR] of 100 ± 14 mL/min/1.73 m2, served as diabetes mellitus control group) and 20 healthy individuals (10 men and 10 women with a mean age of 41 ± 11 years, a mean urinary albumin excreting ratio of 11.6 ± 5.8 mg/24 h and mean eGFR of 108 ± 16 mL/min/1.73 m2, served as the normal control group). The 62 DN patients were the same as those in the previous study, and were divided into the microalbuminuria stage group (MG; n = 11), proteinuria stage group (PG; n = 17) and renal insufficiency stage group (RIG; n = 34), just as what has been reported in a previous study14. All the patients in the present study met the criteria for diabetes (namely: [i] symptoms of diabetes plus casual plasma glucose ≥11.1 mmol/L; and/or [ii] fasting blood glucose ≥7.0 mmol/L; and/or [iii] 2‐h postload glucose concentration ≥11.1 mmol/L), and were inconsistent with the definition for type 2 diabetes15. Patients with other types of diabetes mellitus, such as maturity onset diabetes of the young, gestational diabetes mellitus and type 1 diabetes mellitus, and patients with other infective or inflammatory diseases, were excluded. The final diagnosis of DN was made on the basis of clinical and histological features. Patients with renal biopsy inconsistent with DN or with concomitant other renal diseases were carefully ruled out. Here, healthy individuals were defined as persons who had: (i) normal findings in physical examinations (including chest radiography, electrocardiography, hematology, blood biochemistry, hepatic function, renal function and urine analysis); (ii) negative findings on HIV, and hepatitis B and C viral testing; (iii) no history of hypertension, diabetes, renal disease or vascular disease; and (iv) no inflammatory or infective diseases at least 4 weeks before the time when urine and blood samples were taken. Ethical approval for the present study was obtained from the ethics committee of Jingling Hospital (approval number: 2013GJJ‐100). All research work with human participants was in accordance with the ethical standards of the responsible committee on human experimentation and with the Declaration of Helsinki. Informed consent was obtained from every participant.
Collection of urine and plasma samples
On the day when renal biopsy would be carried out, 10 mL of freshly voided morning urine was collected and centrifuged immediately at 750 g for 10 min. The supernatant was aliquoted into 1 mL/tube and stored in −70°C until use. Plasma specimens were taken from blood samples drawn in ethylenediaminetetraacetic acid at the time of urine collection. Plasma samples were also stored at −70°C until measurement. All the work from collecting to storing the samples was finished within 1 h.
Histology
At Jingling Hospital, Nanjing, China, the indications for renal biopsy included the sustained presence of albuminuria (>30 mg/24 h) and/or proteinuria (>0.4 g/24 h) and/or hematuria and/or renal insufficiency, with or without coexisting systemic disease. The renal biopsies were carried out by a group of clinicians and were examined by experienced nephrologists using techniques, such as light microscopy, immune staining and electron microscopy. Kidney lesions in the glomerulus, tubulointerstitial area and blood vessels were recorded and scored according to the reported criteria.13 According to the morphological characteristics of the cells on hematoxylin–eosin staining, the inflammatory cells in the tubulointerstitial area were identified and the number of each inflammatory cell was counted. Through dividing the number of inflammatory cells by the area of the regions involved, the density of inflammatory cells was calculated. According to the methods described by Okon et al.16, the relative interstitial volume (RIV) was measured. At least 10 randomly selected cortical regions in each section were measured, and the average value was obtained.
Measurement of urinary CAPs
Complement activation products; that is, C3a, C5a and C5b‐9, were measured in the urine and plasma samples using enzyme‐linked immunosorbent assay kits (BD Biosciences, San Diego, CA, USA) according to the manufacturer's instructions. To minimize the variations from urine collection, urinary creatinine was used for correcting the urinary C3a, C5a and C5b‐9, and their level was expressed as nanogram per milligram creatinine.
Statistical analysis
All data were analyzed using SPSS 17.0 (SPSS Inc., Chicago, IL, USA). Because the data about the levels of urinary CAPs (including C3a, C5a and C5b‐9) were determined to be non‐normal, multigroup comparison was carried out using the Kruskal–Wallis test. The difference between two groups was compared with a non‐parametric Wilcoxon rank sum test. To explore the correlation of urinary CAPs with clinical or renal pathological indices, the Spearman correlation analysis was used. Univariate and multivariate logistic regression was carried out to gain deeper insight into the relationship between urinary CAPs and tubular injury. Model A, crude; model B, adjusted for 24 h urine protein level and eGFR, two important factors associated with tubular injury. All statistical tests were two‐tailed, and P values <0.05 were considered significant.
Results
Level of urinary CAPs increased with the development of DN
A total of 62 DN patients were measured for urinary C3a, C5a and C5b‐9. As has been reported14, indices reflecting renal injury, such as 24 h urine protein and the glomerular, tubulointerstitial and renal blood vessel injury score, increased from the MG to the PG and RIG. Also, significant changes in indices reflecting renal function injury, such as serum creatinine, serum urea nitrogen and eGFR level, were observed in the RIG14. All these showed the progression of the disease. In parallel with the progression of DN, as shown in Figure 1, the urinary C3a, C5a and C5b‐9 level increased. The urinary CAPs were found to increase significantly as the proteinuria stage increased further in the renal insufficiency stage. There were strong positive correlations between urinary levels of C3a, C5a and C5b‐9 in DN patients(r = 0.861, P < 0.001 between C3a and C5a; r = 0.857, P < 0.001 between C3a and C5b‐9; and r = 0.816, P < 0.001 between C5a and C5b‐9). No significant change in the levels of urinary CAPs was found in the diabetes mellitus control group and MG compared with the normal control group.
Figure 1.
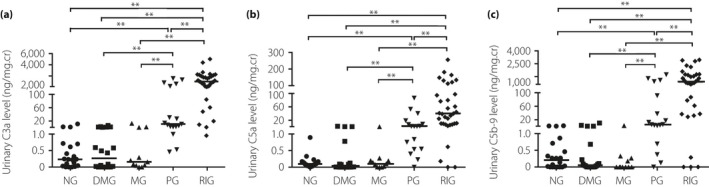
Urinary levels of C3a, C5a and C5b‐9 in patients at different clinical stages of diabetic nephropathy. As the data about the levels of urinary complement activation products (including C3a, C5a and C5b‐9) were determined to be non‐normal, multigroup comparison was carried out using the Kruskal–Wallis test. The difference between the two groups was compared with a non‐parametric Wilcoxon rank sum test. (a) Urinary levels of C3a in different groups. (b) Urinary levels of C5a in different groups. (c) Urinary levels of C5b‐9 in different groups. Thick black line shows the median. **P < 0.01. DMG, diabetes mellitus group (without nephropathy); MG, microalbuminuria stage group; NG, normal control group; PG, proteinuria stage group; RIG, renal insufficiency stage group.
No significant change in the levels of plasma CAPs was observed during the development of DN
Previously, we measured the level of plasma C5b‐9 in the 62 DN patients and no significant change in the level of C5b‐9 was found between the normal control group, MG, PG and RIG14. Here, we further examined the levels of plasma C3a and C5a in these DN patients. Also, we examined the levels of plasma C3a, C5a and C5b‐9 in 20 type 2 diabetes mellitus patients without nephropathy. No significant changes in the plasma level of C3a, C5a and C5b‐9 were observed in DN patients when compared with normal controls. Also, we did not observe significant change in urinary CAPs levels in type 2 diabetes mellitus patients without nephropathy. Also, the levels of urinary CAPs did not correlate significantly with those of plasma CAPs.
Association of the levels of urinary CAPs with renal tubule damage
To explore the pathological significance of urinary complement activation in the development of DN, we first examined the association of the levels of urinary CAPs with clinical indices reflecting renal damage. As shown in Table 1, the levels of urinary CAPs were found to correlate with indices reflecting renal function damage, such as eGFR, serum creatinine and 24 h urine protein level. No significant associations of urinary CAPs with the age, sex, duration of diabetes mellitus, systolic and diastolic blood pressure, body mass index, fasting blood glucose, postprandial blood glucose, serum glycated hemoglobin, and serum triglyceride level were found.
Table 1.
Correlation of urinary complement activation products level with clinical and renal pathological indices
| Indices | Urinary C3a level | Urinary C5a level | Urinary C5b‐9 level | |||
|---|---|---|---|---|---|---|
| r | P | r | P | r | P | |
| eGFR | −0.706 | <0.001 | −0.630 | <0.001 | −0.562 | <0.001 |
| Serum creatinine | 0.727 | <0.001 | 0.633 | <0.001 | 0.614 | <0.001 |
| 24‐h urine protein | 0.848 | <0.001 | 0.838 | <0.001 | 0.885 | <0.001 |
| Tubular and interstitial lesion score | 0.632 | <0.001 | 0.634 | <0.001 | 0.636 | <0.001 |
| Relative tubular interstitial volume | 0.742 | <0.001 | 0.700 | <0.001 | 0.658 | <0.001 |
| Density of tubulointerstitial inflammatory cells | 0.617 | <0.001 | 0.569 | <0.001 | 0.487 | <0.001 |
The relationship of variables was determined by using Spearman correlation coefficients. eGFR, estimated glomerular filtration rate.
To gain a deeper insight into the relationship between urinary complement activation and tubular damage, all the DN patients were further divided into three groups according to the level of urinary C3a: group 1 patients with the urinary C3a level within the first third (<9.2 ng/mg·Cr), group 2 patients with the urinary C3a level within the second third (≥9.2 and <893 ng/mg·Cr) and group 3 patients with the urinary C3a level within the last third (≥893 ng/mg·Cr). We observed that patients with a higher urinary CAPs level usually had more severe renal tubular damage, as observed with a higher proportion of atrophic tubules, larger tubular interstitial area, more severe degree of brush border loss and more tubular epithelial cells detached from the tubular basement membrane in their renal biopsies (Figure 2). Also, the levels of urinary CAPs were found to correlate closely with renal tubular and interstitial injury score, RIV and the density of interstitial infiltration cells (Table 1).
Figure 2.
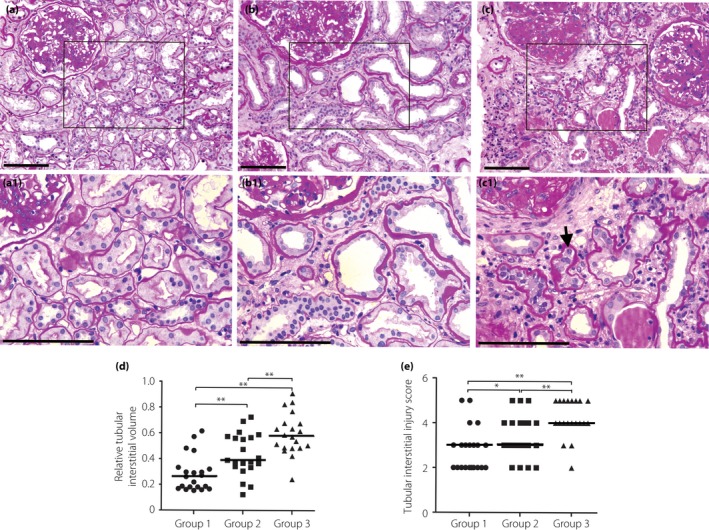
More severe renal tubular damage, such as a higher proportion of atrophic tubules, larger tubular interstitial area, more severe degree of brush border loss and more tubular epithelial cells detached from the tubular basement membrane (shown by black arrow), was observed in the renal biopsies of patients with higher levels of urinary complement activation products. According to the level of urinary C3a, all the patients were divided into three groups: group 1, patients with the urinary C3a level within the first third (<9.2 ng/mg·Cr); group 2, patients with the urinary C3a level within the second third (≥9.2 and <893 ng/mg·Cr); group 3, patients with a urinary C3a level within the last third (≥893 ng/mg·Cr). As the data about tubular interstitial injury score and relative interstitial volume were determined to be non‐normal, multigroup comparison was carried out using the Kruskal–Wallis test. The difference between the two groups was compared with a non‐parametric Wilcoxon rank sum test. (a) A representative picture of periodic acid–Schiff staining from a patient in group 1. (b) A representative picture of periodic acid–Schiff staining from a patient in group 2. (c) A representative picture of periodic acid–Schiff staining from a patient in group 3. (d) The relative tubular interstitial volume in different groups. (e) The tubular interstitial injury score in different groups. (a1,b1,c1) Partial enlargement of (a–c), respectively. Scale bars (a–c, a1–c1), 50 μM. Thick black line in (d) and (e) shows the median.*P < 0.05; **P < 0.01.
Regression analysis of the association of urinary CAPs with tubular injury markers
So far, the present data supported the idea that increased urinary CAPs might contribute to tubular damage in DN patients, especially in patients with later stages of the disease. To further evaluate the role of urinary CAPs in tubular injury, a multivariate regression analysis was carried out. In the unadjusted model (model A), an above‐median level of urinary CAPs was significantly associated with higher renal tubular and interstitial injury score and RIV level. The association between urinary CAPs and renal tubular and interstitial injury score and RIV still remained significant (model B) after adjustment for possible confounding factors (24‐h urine protein and eGFR level; Table 2).
Table 2.
Association of urinary complement activation products level with the markers of tubular injury before and after adjustment for confounders
| Tubular injury markers | Urinary CAPs | Model A | Model B | ||
|---|---|---|---|---|---|
| OR (95% CI) | P | OR (95% CI) | P | ||
| TIS | C3a | 14.3 (4.2–48.7) | <0.001 | 6.5 (1.6–26.6) | 0.009 |
| C5a | 21.7 (5.9–80.1) | <0.001 | 11.1 (2.6–48.2) | 0.001 | |
| C5b‐9 | 14.3 (4.2–48.7) | <0.001 | 8.2 (2.0–34.3) | 0.004 | |
| RIV | C3a | 17.4 (4.9–61.2) | <0.001 | 8.3 (1.7–41.3) | 0.009 |
| C5a | 27.0 (7.0–104.7) | <0.001 | 17.3 (3.0–101.0) | 0.002 | |
| C5b‐9 | 17.4 (4.9–61.2) | <0.001 | 13.2 (2.3–75.3) | 0.004 | |
Model A: no adjustments; model B: adjusted for estimated glomerular filtration rate and 24‐h urine protein. Here, the odds ratio (OR) value means the fold of possibility that patients with higher (above median) level of complement activation products (CAPs) have more severe renal tubular interstitial injury (as represented by higher relative interstitial volume [RIV] or tubular and interstitial injury score [TIS]) than patients with lower (below median) level of CAPs.
Discussion
By using the renal biopsy specimen and the urine samples from patients with different stages of DN, the present study investigated the pathological significance of urinary complement activation in the development of DN. Increased urinary CAPs have been reported in some renal diseases including DN10, 11, 12. In 1991, Ogrodowski et al.11 first reported increased urinary C5b‐9 in patients with renal diseases. Six DN patients were included in the study. In 2000, Morita et al.10 reported increased urinary iC3b, Bb and MAC in proteinuric patients, and 17 DN patients were included. Because of the small number of DN patients included in these studies, association analysis of urinary CAPs with the progression of the disease is impossible. Furthermore, most of the patients included in these studies had severe renal insufficiency, leaving the change of urinary CAPs in DN patients at microalbuminuria and proteinuria stages unknown. In addition, although the diagnosis of most of the DN patients included in the above‐mentioned studies was based only on clinical observation, it is unable to associate urinary complement activation with kidney damage directly. Quite different from the studies carried out by Ogrodowski et al. and Morita et al., in a recently published study, Li et al.12 reported urinary CAP levels in 50 biopsy‐proven DN patients. However, with the mean eGFR being 44.28 mL/min/1.73 m2 (44.28 ± 26.79 mL/min/1.73 m2) and mean proteinuria being 6.33 g/24 h (6.33 ± 4.35 g/24 h)12, most of the patients included in the study by Li et al. still belonged to the advanced stage of DN. Thus, Li et al. did not analyze the urinary CAP levels in patients at earlier stages of the disease. In contrast to the study carried out by Li et al., the present study included 62 biopsy‐proven DN patients, consisting of 11 patients at the microalbuminuria stage, 17 at the proteinuria stage and 34 at the renal insufficiency stage, almost covering all the stages of DN. Thus, the present study might have given us a more comprehensive understanding of urinary CAPs in DN patients. Given the heterogeneity of DN13, it is of importance.
In the present study, we showed that the urinary C3a, C5a and C5b‐9 level increased with the progression of DN. This was likely to result from renal local complement activation rather than circulating complement activation, given that the plasma levels of CAPs were comparable between patients with DN and controls, and there was no association between plasma and urinary CAPs. The consistency of the elevation of urinary CAPs with the worsening of the disease suggests the involvement of urinary complement activation in the disease. Indeed, in the present study, we observed that the levels of urinary CAPs were not only associated with the indices reflecting renal function damage, but were also associated closely with indices reflecting renal tubular interstitial injury. Also, we observed that patients with higher levels of CAPs usually had severe renal tubular interstitial damage in their renal biopsies. The results of multivariate logistic regression analysis showed that the urinary CAP level is the independent risk factor for renal tubular injury in DN patients.
Can increased urinary complement activation contribute to the progression of DN through aggravating renal tubular interstitial damage? Activation of complement might exert detrimental effects on the host tissue through direct attack of C5b‐9 to the cell surface or activation of complement receptors and their downstream signals by complement fragments17, 18. Deposition of C5b‐9 can lead to formation of transmembrane channels, followed by disruption of target cell membrane and cell lysis. In addition, complement fragments, such as C3a and C5a, can bind to their receptors and activate downstream signal pathways, such as the extracellular signal‐regulated kinases 1/2 pathway, phosphatidylinositol‐4,5‐bisphosphate 3‐kinase pathway, transforming growth factor‐β pathway and nuclear factor‐κB pathway19. Through activation of these downstream signals, complement fragments C3a and C5a can induce both immune and non‐immune roles, and contribute to tissue injury20, 21. Specifically, C3a and C5a have been reported to be able to induce renal injury (especially renal tubular injury) in some pathological conditions through activation of C3aR and C5aR, respectively22, 23. For example, C3a has been reported to be able to induce the production of inflammatory cytokines and epithelial‐to‐mesenchymal transdifferentiation in tubular epithelial cells through activation of C3aR22, 23. Based on these, we believed that it is possible for urinary complement activation to contribute to the tubular interstitial injury and thus promote the progression of DN. However, further investigations are still required to confirm our supposition.
In the present study, no significant elevation in the levels of urinary CAPs was found in the type 2 diabetes mellitus patients without nephropathy and DN patients at the microalbuminuria stage. Increased urinary CAPs were observed since the proteinuria stage. This phenomenon was in accordance with previous explanations of the causes for intratubular complement activation10, 24 – a certain level of complement components and production of ammonium in the tubular lumen. Under normal conditions, the glomerular filter membrane prevents the entry of complement components, such as C3, a protein with a molecular weight of approximately 200 kD, into the urinary space. In the later stage of DN, the selectivity of the glomerular barrier is impaired badly and larger amounts of complement components are filtered into the urinary space with other proteins. In the meantime, increased proteinuria, tubular injury, renal insufficiency and metabolic acidosis induce the production and secretion of ammonium into the tubular lumen10. Ammonium might amidate urinary C3, and result in the formation of the alternative pathway convertase (amidated C3) and initiation of the complement activation cascade24.
It should be pointed out that the present finding of a close correlation between urinary CAPs and renal tubular interstitial injury is quite different from the results obtained by Li et al.12 For the present, we cannot explain the causes. Given the heterogeneity of DN and the different indications for renal biopsy in DN patients used in different institutions, perhaps a difference in the study population is among them. The different results observed by different studies (the present study and the study by Li et al.) might have emphasized the need for more investigations to show the nature of urinary CAPs in DN patients.
There were still several limitations to the present study. First, selection bias necessarily exists. To confirm all the patients included had pure DN and for the purpose of analyzing the association of urinary CAPs with renal pathological changes, we only included biopsy‐proven DN patients in the present study, which might cause selection bias. Second, as it was a biopsy‐based study, deviation caused by the limitation of biopsy studies might also exist. Third, as it is just a cross‐sectional observation, further prospective studies are still required to prove our supposition. Finally, the sample size was not very large, especially for the microalbuminuria stage group and the proteinuria stage group. The limited number of patients restricted our further analysis and might also cause bias in the present results.
In summary, by including patients at different stages of DN, the present study has provided a full view of the change of urinary CAPs in DN patients. By taking advantage of renal biopsy specimens of all patients included, we analyzed the association of urinary complement activation with the kidney injury. The present results support the idea that urinary complement activation might have a role in renal tubular interstitial injury in DN patients, especially for the patients at a later stage of the disease. Given that urinary complement activation can be enhanced by kidney damage, which would result in more complement components filtrated through the injured glomerular filter membrane and production of more ammonium in the tubular lumen, and thus promote urinary complement activation, we speculated that there might be a vicious circle between urinary complement activation and renal tubular injury in patients at the later stage of DN, and blocking this vicious circle might be helpful for treatment of this disease. In addition, as there is a close correlation of urinary CAPs with the severity of DN, the urinary CAPs might be used as a marker for clinicians to evaluate the severity and progression of the disease, especially for the injury of renal tubules.
Disclosure
The authors declare no conflict of interest.
Acknowledgments
This study was supported by the National Natural Science Foundation of China (81370828). We thank JP Wang and F Xu, who are affiliated to the National Clinical Research Center of Kidney Diseases, Jingling Hospital, for their excellent technical assistance and help in collection of urine, plasma and renal biopsy samples. We also thank YX Liu and ML Zhou, who are affiliated with the Data and Statistics Center of Jingling Hospital, for their help with data analysis.
J Diabetes Investig 2019; 10: 738–744
References
- 1. Molitch ME, Adler AI, Flyvbjerg A, et al Diabetic kidney disease: a clinical update from Kidney Disease: improving global outcomes. Kidney Int 2015; 87: 20–30. [DOI] [PMC free article] [PubMed] [Google Scholar]
- 2. Lim AK. Diabetic nephropathy ‐ complications and treatment. Int J Nephrol Renovasc Dis 2014; 7: 361–381. [DOI] [PMC free article] [PubMed] [Google Scholar]
- 3. Fried LF, Emanuele N, Zhang JH, et al Combined angiotensin inhibition for the treatment of diabetic nephropathy. N Engl J Med 2013; 369: 1892–1903. [DOI] [PubMed] [Google Scholar]
- 4. de Zeeuw D, Akizawa T, Audhya P, et al Bardoxolone methyl in type 2 diabetes and stage 4 chronic kidney disease. N Engl J Med 2013; 369: 2492–2503. [DOI] [PMC free article] [PubMed] [Google Scholar]
- 5. Flyvbjerg A. The role of the complement system in diabetic nephropathy. Nat Rev Nephrol 2017; 13: 311–318. [DOI] [PubMed] [Google Scholar]
- 6. Onda K, Ohsawa I, Ohi H, et al Excretion of complement proteins and its activation marker C5b‐9 in IgA nephropathy in relation to renal function. BMC Nephrol 2011; 12: 1–8. [DOI] [PMC free article] [PubMed] [Google Scholar]
- 7. Gou SJ, Yuan J, Wang C, et al Alternative complement pathway activation products in urine and kidneys of patients with ANCA‐associated GN. Clin J Am Soc Nephrol 2013; 8: 1884–1889. [DOI] [PMC free article] [PubMed] [Google Scholar]
- 8. Ma R, Cui Z, Liao YH, et al Complement activation contributes to the injury and outcome of kidney in human anti‐glomerular basement membrane disease. J Clin Immunol 2013; 33: 172–178. [DOI] [PubMed] [Google Scholar]
- 9. Burwick RM, Easter SR, Dawood HY, et al Complement activation and kidney injury molecule‐1‐associated proximal tubule injury in severe preeclampsia. Hypertension 2014; 64: 833–838. [DOI] [PubMed] [Google Scholar]
- 10. Morita Y, Ikeguchi H, Nakamura J, et al Complement activation products in the urine from proteinuric patients. J Am Soc Nephrol 2000; 11: 700–707. [DOI] [PubMed] [Google Scholar]
- 11. Ogrodowski JL, Hebert LA, Sedmak D, et al Measurement of SC5b‐9 in urine in patients with the nephrotic syndrome. Kidney Int 1991; 40: 1141–1147. [DOI] [PubMed] [Google Scholar]
- 12. Li XQ, Chang DY, Chen M, et al Complement activation in patients with diabetic nephropathy. Diabetes Metab 2018. 10.1016/j.diabet.2018.04.001. [DOI] [PubMed] [Google Scholar]
- 13. Tervaert TW, Mooyaart AL, Amann K, et al Pathologic classification of diabetic nephropathy. J Am Soc Nephrol 2010; 21: 556–563. [DOI] [PubMed] [Google Scholar]
- 14. Zheng JM, Ren XG, Jiang ZH, et al Lectin‐induced renal local complement activation is involved in tubular interstitial injury in diabetic nephropathy. Clin Chim Acta 2018; 482: 65–73. [DOI] [PubMed] [Google Scholar]
- 15. Expert Committee on the Diagnosis and Classification of . Diabetes Mellitus. Report of the expert committee on the diagnosis and classification of diabetes mellitus. Diabetes Care 2003; 26(Suppl 1): S5–S20. [DOI] [PubMed] [Google Scholar]
- 16. Okon K, Szumera A, Kuzniewski M. Are CD34+ cells found in renal interstitial fibrosis? Am J Nephrol 2003; 23: 409–414. [DOI] [PubMed] [Google Scholar]
- 17. Ricklin D, Lambris JD. Complement in immune and inflammatory disorders: pathophysiological mechanisms. J Immunol 2013; 190: 3831–3838. [DOI] [PMC free article] [PubMed] [Google Scholar]
- 18. Li L, Yin Q, Tang X, et al C3a receptor antagonist ameliorates inflammatory and fibrotic signals in type 2 diabetic nephropathy by suppressing the activation of TGF‐beta/smad3 and IKBalpha pathway. PLoS ONE 2014; 9: e113639. [DOI] [PMC free article] [PubMed] [Google Scholar]
- 19. Ghosh P, Sahoo R, Vaidya A, et al Role of complement and complement regulatory proteins in the complications of diabetes. Endocr Rev 2015; 36: 272–288. [DOI] [PMC free article] [PubMed] [Google Scholar]
- 20. Kelly KJ, Liu Y, Zhang J, et al Renal C3 complement component: feed forward to diabetic kidney disease. Am J Nephrol 2015; 41: 48–56. [DOI] [PMC free article] [PubMed] [Google Scholar]
- 21. Wang H, Vinnikov I, Shahzad K, et al The lectin‐like domain of thrombomodulin ameliorates diabetic glomerulopathy via complement inhibition. Thromb Haemost 2012; 108: 1141–1153. [DOI] [PubMed] [Google Scholar]
- 22. Peng Q, Li K, Smyth LA, et al C3a and C5a promote renal ischemia‐reperfusion injury. J Am Soc Nephrol 2012; 23: 1474–1485. [DOI] [PMC free article] [PubMed] [Google Scholar]
- 23. Tang Z, Lu B, Hatch E, et al C3a mediates epithelial‐to‐mesenchymal transition in proteinuric nephropathy. J Am Soc Nephrol 2009; 20: 593–603. [DOI] [PMC free article] [PubMed] [Google Scholar]
- 24. Nangaku M. Mechanisms of tubulointerstitial injury in the kidney: final common pathways to end‐stage renal failure. Intern Med 2004; 43: 9–17. [DOI] [PubMed] [Google Scholar]