Abstract
The dopamine transporter (DAT) regulates dopamine neurotransmission via reuptake of dopamine released into the extracellular space. Interactions with partner proteins alter DAT function and thereby dynamically shape dopaminergic tone important for normal brain function. However, the extent and nature of these interactions are incompletely understood. Here, we describe a novel physical and functional interaction between DAT and the voltage-gated K+ channel Kv2.1 (potassium voltage-gated channel subfamily B member 1 or KCNB1). To examine the functional consequences of this interaction, we employed a combination of immunohistochemistry, immunofluorescence live-cell microscopy, co-immunoprecipitation, and electrophysiological approaches. Consistent with previous reports, we found Kv2.1 is trafficked to membrane-bound clusters observed both in vivo and in vitro in rodent dopamine neurons. Our data provide evidence that clustered Kv2.1 channels decrease DAT's lateral mobility and inhibit its internalization, while also decreasing canonical transporter activity by altering DAT's conformational equilibrium. These results suggest that Kv2.1 clusters exert a spatially discrete homeostatic braking mechanism on DAT by inducing a relative increase in inward-facing transporters. Given recent reports of Kv2.1 dysregulation in neurological disorders, it is possible that alterations in the functional interaction between DAT and Kv2.1 affect dopamine neuron activity.
Keywords: dopamine transporter, protein–protein interaction, neurotransmitter transport, voltage-dependent anion channel, trafficking
Introduction
The dopamine transporter (DAT)2 reuptakes released dopamine from the extracellular space following an action potential, which terminates the signal and recycles the monoamine (1). Mutations in DAT have been linked to early-onset parkinsonism in humans, and DAT knockout mice exhibit severely reduced striatal dopamine levels (2–4). Importantly, activation of DAT increases the excitability of dopamine neurons via an inwardly-depolarizing Na+ current while also increasing intracellular Ca2+ mobilization (5, 6). Dopamine neurons have conserved mechanisms to curtail these DAT-mediated responses, including transporter internalization and its membrane microdomain redistribution (7–9). Additionally, functional interactions between DAT and its partner proteins have been shown to influence many facets of dopamine neuron physiology, including neurotransmitter release and reuptake, modulation of excitability, and responses to cellular stress (6, 10, 11). In this study, we examine the physical and functional interaction between DAT and Kv2.1, a voltage-gated K+ channel critical to the regulation of neuronal excitability and membrane microdomain organization (12–14).
Kv2.1 is a slowly deactivating K+ channel that has been extensively studied as a regulator of neuronal excitability and a neuroprotective target in hippocampal and cortical neurons (12, 15). The activity of Kv2.1 repolarizes neurons following an action potential, and its activation is enhanced in response to cellular stress as a putative homeostatic braking mechanism to decrease neuronal excitability (16). In dopamine neurons, inhibition of Kv2.1 has been shown to increase spontaneous firing activity while also increasing the half-width of action potentials (17). Separate from Kv2.1's channel activity, Kv2.1 clusters facilitate vesicular release in neuroendocrine cells via an interaction with syntaxin (18). Interestingly, Kv2.1 has been shown to undergo oxidation in the human brain during aging and neurodegenerative disease, leading to nonfunctional channels distinct from native clusters of nonoxidized channels (19, 20). This oxidation of Kv2.1 has been linked to a dysregulation of Ca2+ signaling in hippocampal neurons in a rodent model of neurodegenerative pathology (20).
We and others have shown Kv2.1 is a partner protein of DAT as measured by co-immunoprecipitation of the proteins in brain tissue and in heterologous expression systems (21, 22). Kv2.1 is one of only two K+ channels, in addition to Kv4.3M, shown to interact with DAT via proteomics analysis, despite an extensive variety of expressed K+ channels in dopamine neurons (21, 23, 24). Although it is possible that both channels may regulate DAT via a functional interaction, this study is restricted to the interaction of DAT and Kv2.1. Herein, we report that there is a dynamic functional interaction between Kv2.1 and DAT that can regulate DAT activity and thus dopamine transmission.
Results
Kv2.1 clusters exist at the soma and proximal processes of midbrain dopamine neurons
Previous reports have shown that Kv2.1 is trafficked into micron-sized clusters along the soma and axon initial segment of cortical and hippocampal neurons (25–27). The clustered channels are hypothesized to serve a nonconducting role, with channels not localized to clusters conducting the signature delayed-rectifier current (28, 29). To examine the expression and localization of Kv2.1 in dopamine neurons, we utilized double-immunofluorescence labeling and 3D confocal microscopy in cultured dopamine neurons (Fig. 1A) as well as mouse (Fig. 1B) and rat (Fig. 1C) brain slices containing the substantia nigra pars compacta. Consistent with previous reports, DAT is expressed throughout the soma and proximal processes of dopamine neurons (Fig. 1, A–C, leftmost panels, green in Merge). Similar to DAT, Kv2.1 is expressed at the soma and along the proximal processes of dopamine neurons (Fig. 1, A–C, middle panels, red in merge). In contrast to DAT's uniform expression pattern, Kv2.1 labeling was localized to discrete clusters, observable as bright red puncta (Fig. 1, A–C). These data confirm the co-expression of Kv2.1 and DAT in dopamine neurons and indirectly support the previously published association of Kv2.1 and DAT in mouse striatal tissue (21).
Figure 1.
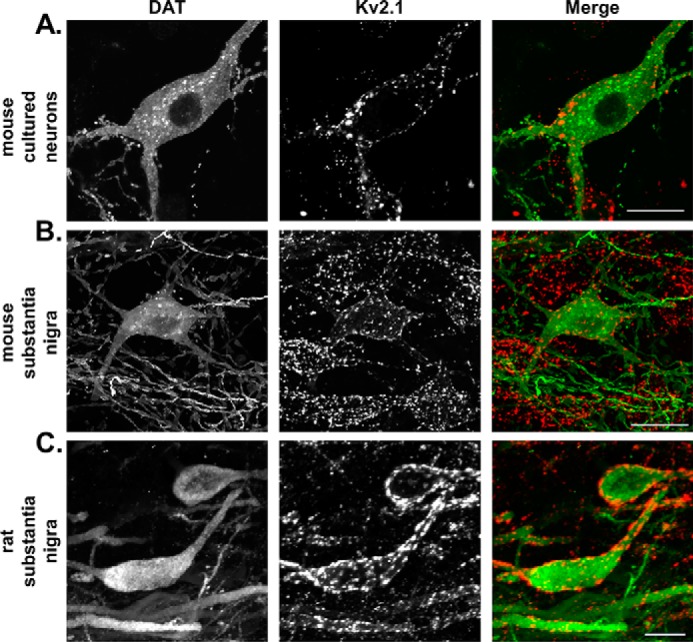
Kv2.1 is expressed at the soma and proximal processes of murine dopamine neurons. Double-immunofluorescence labeling is shown of DAT (leftmost column, green in merge) and Kv2.1 (middle column, red in merge) in murine dopamine neurons. All images are 2D maximum intensity projections of 3D reconstructed confocal z-stack. In mouse cultured neurons (A) and labeled mouse (B) and rat (C) brain slices, DAT labeling is diffuse along the entirety of the soma and proximal processes, whereas Kv2.1 is localized exclusively to large clusters. (Scale, 10 μm.)
Kv2.1 and DAT associate in vivo
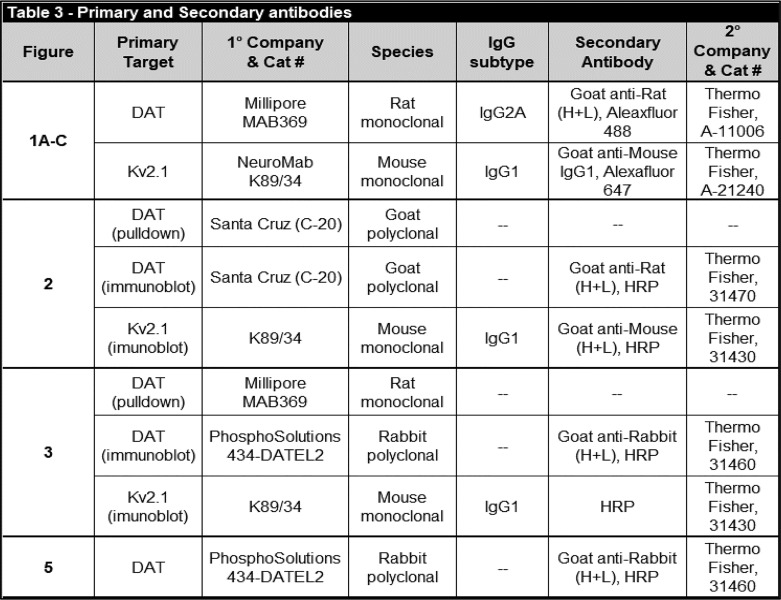
Because the previously published co-immunoprecipitation of Kv2.1 and DAT was conducted in mouse tissue, we examined whether an association between endogenous Kv2.1 and DAT can be detected in rat striatal tissue. To this end, we immunoprecipitated DAT and probed for DAT and Kv2.1 in Western blotting experiments (Fig. S1, antibody information in Table 3). Both DAT and Kv2.1 were present in the total input before DAT immunoprecipitation (Fig. S1, 2nd and 4th blots). DAT was detected when pulled down using a specific antibody, but no band was detected with a nonspecific IgG control, confirming the specificity of the immunoprecipitation assay (Fig. S1, 1st blot). Kv2.1 was also detected following DAT immunoprecipitation confirming that the endogenous proteins associate in vivo in rat striatal tissue (Fig. S1, 3rd blot). To determine whether the interaction between Kv2.1 is dynamically regulated, we next repeated co-immunoprecipitation experiments in a heterologous system with or without activation of DAT.
Table 3.
Primary and secondary antibodies
DAT activation increases its association with Kv2.1
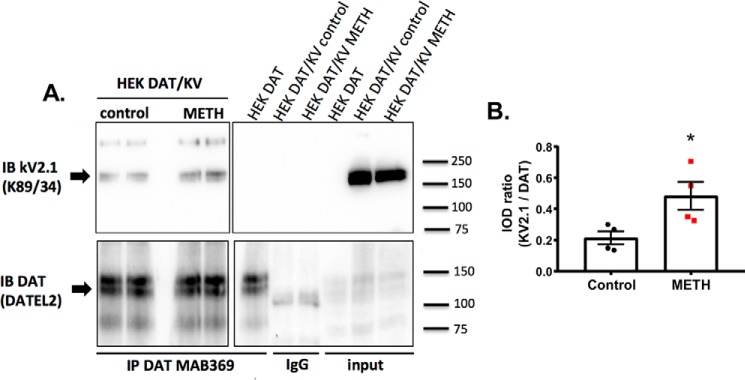
Previous studies from our group and others have shown the cell surface distribution of DAT is regulated by multiple mechanisms, including substrate activation of DAT, changes in membrane potential, DAT interaction with its partner proteins, and intracellular kinases (9, 10, 30, 31). To determine whether DAT's association with Kv2.1 was dynamically regulated, we used co-immunoprecipitation with or without pharmacological activation of DAT in overexpressing HEK-293 cells. In the absence of pharmacological stimulation of DAT, Kv2.1 and DAT co-immunoprecipitated (Fig. 2A). Methamphetamine (METH) activation of DAT (10 μm, 5-min incubation) significantly increased the amount of Kv2.1 co-immunoprecipitated with DAT, suggesting that the association between the two proteins is dynamically regulated by DAT activity (Fig. 2B, control, 0.2124 ± 0.0416; METH, 0.4821 ± 0.0896; p = 0.0342; unpaired t test; n = 4 independent experiments for each condition). These co-immunoprecipitation data support the hypothesis that there is a functional interaction between Kv2.1 and DAT; however, this can be either through a direct interaction and/or via a larger protein complex. To address these possibilities, we next measured the proximity between Kv2.1 and DAT using live cell Förster resonance energy transfer (FRET) microscopy with and without DAT activation.
Figure 2.
DAT activation increases the transporter's association with Kv2.1. A, representative blot showing the co-immunoprecipitation (IP) between GFP–Kv2.1 and YFP–DAT before (control) or after DAT activation (METH, 10 μm for 5 min). DAT was a pulldown using an N-terminal targeted antibody (MAB369) and detected with an antibody targeting the second extracellular loop (DATEL2). No Kv2.1 was detected in cells expressing DAT alone (right blot, DAT) or when nonspecific IgG beads were used (right blot, IgG lanes). IB, immunoblot. B, quantification of the ratio of Kv2.1 signal to DAT signal observed in basal (control) and DAT activation (METH 10 μm) conditions. Activation of DAT results in an increase in the observed ratio, indicative of increased association between the two proteins (p = 0.0342, unpaired t test; n = 4 independent experiments for each condition).
DAT activation directly increases its proximity to Kv2.1 within clusters
The increased amount of Kv2.1 co-immunoprecipitated with DAT and Kv2.1 supports two potential possibilities: either DAT activation increases its interaction with a protein complex containing Kv2.1 and/or DAT activation increases its interaction with Kv2.1 channels directly. To investigate which of these possibilities underlies the observed increase in DAT and Kv2.1 co-immunoprecipitation, we employed live-cell acceptor photobleaching FRET in cells co-expressing RFP–DAT and GFP–Kv2.1 (Fig. 2) (32, 33). FRET microscopy is based on the transfer of energy between a pair of chromophores (FRET pairs) to estimate the proximity of two fluorescently tagged proteins up to 100 Å (34). All imaging was carried out at a single confocal optical plane near the basal membrane where GFP–Kv2.1 clusters were readily identifiable (Fig. 3A). FRET was observed in basal conditions between RFP–DAT and GFP–Kv2.1 (Fig. 3B, vehicle = 8.407 ± 0.552%, n = 116 cells from 10 independent experiments), suggesting these two proteins natively exist within 100 Å of each other. To confirm the specificity of the observed FRET, we repeated the experiment using GFP–Kv2.1 and an intracellular protein (RFP-tagged early endosome antigen 1, RFP–EEA1) (9, 35). No FRET was observed between GFP–Kv2.1 and RFP–EEA1, and this was significantly different from the FRET signal measured in each experimental group (Fig. 3B, p < 0.0001 between RFP–EEA1/GFP–Kv2.1 and all experimental groups n = 32 cells from four independent experiments; Tukey's test following one-way ANOVA). Next, we examined the FRET efficiency between DAT and Kv2.1 following DAT activation. FRET efficiency between RFP–DAT and WT–GFP–Kv2.1 increased ∼41% following METH stimulation of DAT activity when compared with control conditions (Fig. 3B, METH = 11.88 ± 0.710%; ***, p = 0.0006, n = 101 cells from nine independent experiments, Tukey's test following one-way ANOVA). Similarly, DAT activation with the endogenous substrate dopamine (1 μm) yielded ∼36% increase in the FRET efficiency between RFP–DAT and WT–GFP–Kv2.1 (Fig. 3B, DA = 11.46 ± 0.953%, p < 0.0001, n = 61 cells from seven independent experiments, Tukey's test following one-way ANOVA). To confirm that this effect depended on DAT activation, we repeated this experiment after pretreatment with the DAT blocker nomifensine (10 μm, Fig. S2B). When the transporter was blocked, METH did not increase the FRET between the two proteins (NOM/METH = 4.208 ± 0.767%; ns (not significant) change from control; n = 51 cells (control) and 62 cells (NOM/METH) from four independent experiments each, Tukey's test following one-way ANOVA). As shown in Fig. S2, the increase in proximity between Kv2.1 and DAT was observed irrespective of the FRET pair used. These data suggest DAT activation in and of itself directly increases the proximity between Kv2.1 and DAT.
Figure 3.
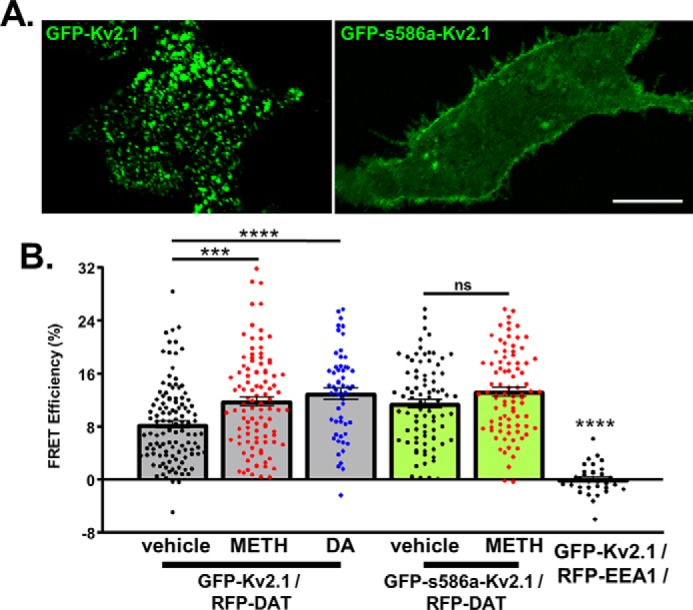
Disruption of Kv2.1 clustering prevents METH-induced increases in its proximity to DAT. A, representative confocal images at a single optical plane where FRET was conducted showing WT–GFP–Kv2.1 localization compared with the nonclustering mutant GFP–s586a–Kv2.1. (Scale, 25 μm.) B, measured FRET efficiencies. Comparing basal conditions (vehicle) and DAT activation (METH (10 μm) or DA (1 μm)) revealed an increase in FRET efficiency between RFP–DAT and Kv2.1 (GFP-Kv2.1/RFP-DAT, vehicle versus METH, p = 0.0066, n = 116 and 101 cells from 10 and 9 independent experiments for vehicle and METH, respectively; vehicle versus DA p < 0.0001, n = 61 cells from six independent experiments, Tukey's test following one-way ANOVA). No significant FRET increase was observed under the same conditions when Kv2.1 clustering was disrupted (GFP-s586a-Kv2.1/RFP-DAT, n = 83 and 86 cells for vehicle and METH, respectively, each from six independent experiments, Tukey's test following one-way ANOVA). To confirm the specificity of the FRET observed, GFP–Kv2.1 was expressed with a noninteracting protein tagged with an identical chromophore (RFP–EEA1), in which conditions no FRET was observed (p < 0.0001 between all experimental groups, n = 32 cells from four independent experiments).
Neuronal activity or cellular stress can induce a loss of Kv2.1 clusters, freeing channels to diffuse throughout the membrane (36, 37). Therefore, to examine whether or not Kv2.1 clustering regulates its association with the transporter, we repeated the FRET experiments with the nonclustering s586a mutant Kv2.1 (GFP–s586a–Kv2.1) (38). Unlike what we observed with the WT–GFP–Kv2.1, activation of the transporter did not increase the FRET efficiency between RFP–DAT and GFP–s586a–Kv2.1, suggesting that the native localization pattern of Kv2.1 is necessary for its dynamic interaction with DAT (Fig. 3D, S586A METH = 13.340 ± 0.672%; ns versus GFP–s586a–Kv2.1, vehicle, n = 86 and 83 cells for METH and vehicle, respectively, each from six independent experiments, Tukey's test following one-way ANOVA). Taken together, these data suggest that the proximity of DAT and Kv2.1 is dynamically regulated by DAT activation, and this regulation is sensitive to the state of Kv2.1 clustering.
METH-stimulated DAT internalization is inhibited at sites of Kv2.1 clusters
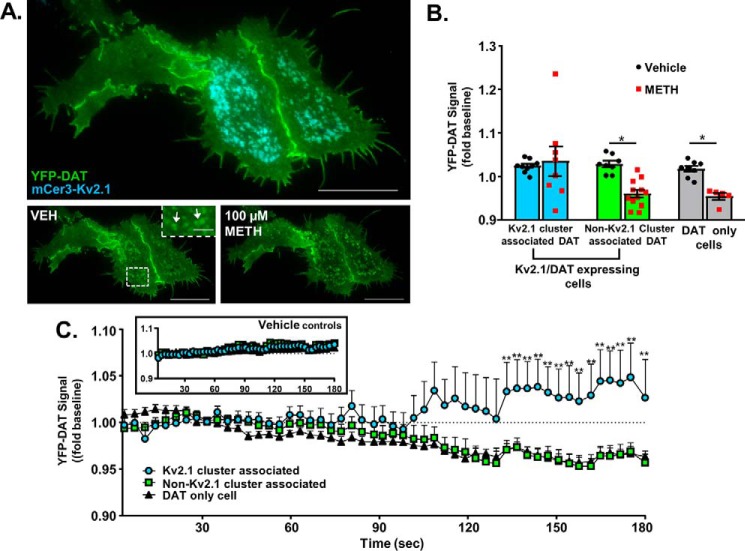
Next, we examined the functional consequences of increased proximity between Kv2.1 and DAT in cells expressing YFP–DAT and a new mCerulean3–Kv2.1 (mCer3–Kv2.1) generated for this study. Unlike cells expressing YFP–DAT alone, where the transporter molecules are homogeneously distributed (6, 7, 9, 39), live cell total internal reflection microscopy (TIRFM) in Kv2.1/DAT cells revealed DAT molecules accumulated in areas of the membrane containing Kv2.1 clusters (Fig. 4A, bottom left panel, white arrows in inset).This observation effectively segmented DAT at the plasma membrane into two populations: the Kv2.1 cluster-associated DAT (named as such), and the DAT molecules in the same cell that were not in a region containing a Kv2.1 cluster (non-Kv2.1 cluster-associated DAT). To examine whether or not these two DAT populations exhibited unique internalization behavior following activation with METH, dual-color live cell TIRFM was utilized to determine Kv2.1 regulation of DAT internalization. Consistent with previous results, YFP–DAT was rapidly internalized following METH stimulation of DAT activity in cells not expressing mCer3–Kv2.1 (Fig. 4B, non-Kv2.1–expressing cell DAT, mean difference: 0.0632 ± 0.025, p = 0.0414, Sidak's multiple comparisons test following two-way ANOVA). This effect was nearly identical when examining the population of DAT in mCer3–Kv2.1-expressing cells not associated with Kv2.1 clusters (Fig. 4B, non-Kv2.1 cluster-associated DAT, mean difference: 0.0683 ± 0.020, p = 0.0037, Sidak's multiple comparisons test following two-way ANOVA). Conversely, the population of DAT associated with Kv2.1 clusters proved resistant to internalization, and no loss of YFP signal was observed in these regions (Fig. 4B, Kv2.1 cluster-associated DAT, mean difference: −0.0104 ± 0.021, ns, Sidak's multiple comparisons test following one-way ANOVA). In control experiments, no appreciable DAT internalization was observed following vehicle perfusion (Fig. 4C, inset). These data suggest Kv2.1 clusters either retain DAT at the membrane by limiting the mobility of the protein or the DAT molecules are actively trafficked to sites of Kv2.1 clusters following activation.
Figure 4.
DAT internalization is reduced at sites of Kv2.1 clusters. A, TIRFM image of a Kv2.1/DAT cell (top), and YFP–DAT signal before (below, left) and 2 min after exposure to 100 μm METH (below, right). (Scale bars, 25 μm; inset scale bars, 5 μm.) B, normalized YFP–DAT signal measured during the final 30 s in cells co-expressing mCer3–Kv2.1 (two leftmost groups) and cells expressing YFP–DAT only (rightmost group) following treatment with METH or imaging buffer alone. YFP–DAT signal in cells co-expressing Kv2.1 was segregated on the basis of mCer3–Kv2.1 cluster presence as indicated. Non-Kv2.1 cluster associated DAT and DAT in cells that did not express Kv2.1 exhibited a significant loss of fluorescence at the membrane, indicative of internalization (non-Kv2.1 cluster-associated DAT VEH-METH: p = 0.0037; DAT only cells VEH-METH: p = 0.0414; Sidak's multiple comparison test following two-way ANOVA). Kv2.1 cluster-associated DAT did not exhibit a decrease in fluorescence at the membrane in response to METH treatment. C, line graph showing changes in the YFP–DAT fluorescence levels at the plasma membrane for Kv2.1 cluster associated DAT (blue line), non-Kv2.1 cluster-associated DAT (green line), and DAT-only cells (black line). Non-Kv2.1 cluster associated DAT showed no difference in internalization rate from that in non-Kv2.1–expressing cells, although both groups differed significantly at the indicated time points for Kv2.1 cluster-associated DAT. (**, p < 0.01, Tukey's multiple comparison test following two-way ANOVA.)
Kv2.1 cluster association limits lateral mobility of DAT
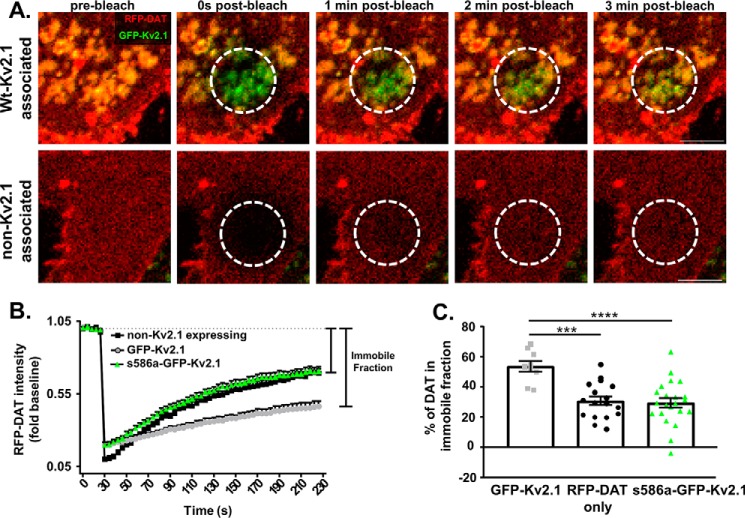
To determine whether Kv2.1 clusters retained DAT molecules once associated, live cell fluorescence recovery after photobleaching (FRAP) imaging of RFP–DAT was conducted in the presence of WT–GFP–Kv2.1 or the GFP–s586a–Kv2.1 mutant and compared with cells expressing RFP–DAT alone (Fig. 5). FRAP measures lateral membrane mobility of DAT (11, 30). Briefly, a region of interest was drawn to selectively bleach DAT molecules in a discrete area of the basal membrane. Re-emergence of RFP signal in the photobleached area is indicative of the diffusion of RFP–DAT molecules from unbleached regions of the cell (Fig. 5A). The amount of signal that is not recovered following photobleaching represents the immobile fraction of DAT (Fig. 5B). Comparing the immobile fractions across experimental groups revealed a significant increase in the amount of immobile DAT when WT–GFP–Kv2.1 was present compared with DAT in cells not expressing Kv2.1 (Fig. 5C, GFP–Kv2.1: 53.69 ± 3.36%, n = 9 cells from seven independent experiments; non-Kv2.1–expressing cells: 30.72 ± 2.91%, n = 17 cells from eight independent experiments; p = 0.0003, Tukey's test following one-way ANOVA). In the presence of GFP–s586a–Kv2.1, the measured immobile fraction was nearly identical to that seen in cells not expressing Kv2.1 (GFP–s586a–Kv2.1: 29.44 ± 3.11%, ns versus non-Kv2.1–expressing cells, p < 0.0001, versus GFP–Kv2.1; n = 22 cells from seven independent experiments, Tukey's test following one-way ANOVA). Taken together, these data suggest decreased DAT internalization at sites of Kv2.1 clusters is likely due to an overall decrease in the membrane mobility of DAT. Additionally, and in agreement with our observed FRET data, the reduction in the lateral mobility of DAT depended upon the presence of clustered Kv2.1 channels at the membrane as indicated by the loss of effect with the nonclustering s586a–Kv2.1 mutant channel.
Figure 5.
Kv2.1 cluster association limits DAT membrane mobility. A, representative FRAP time series showing the basal membrane of a Kv2.1/DAT cell (top panel) or cell expressing DAT only (lower panel). White circle outlines the photobleached region followed by the time-dependent recovery of RFP signal, representing the lateral mobility of unbleached RFP–DAT molecules. (Scale bars, 5 μm.) B, fluorescence recovery profiles for cells only expressing RFP–DAT (black line) or cells co-expressing RFP–DAT with WT–GFP–Kv2.1 (gray line) or RFP–DAT with s586a-GFP–Kv2.1 (green line). C, quantification of immobile DAT fraction defined by the decreased fluorescent recovery. The cells expressing only RFP–DAT and cells co-expressing RFP–DAT plus the nonclustering s586a-GFP–Kv2.1 showed a significant fluorescent recovery following photobleaching leading to a significantly lower immobile fraction for RFP–DAT in cells co-expressing WT–GFP–Kv2.1 (WT versus non-Kv: p = 0.0003; WT versus s586a: p < 0.0001; n = 9 cells (WT), 17 cells (non-Kv), and 22 cells (s586a) from seven (WT), eight (non-Kv), and seven (s586a) independent experiments; Tukey's test following one-way ANOVA).
Kv2.1 expression attenuates DAT-mediated inward current and uptake
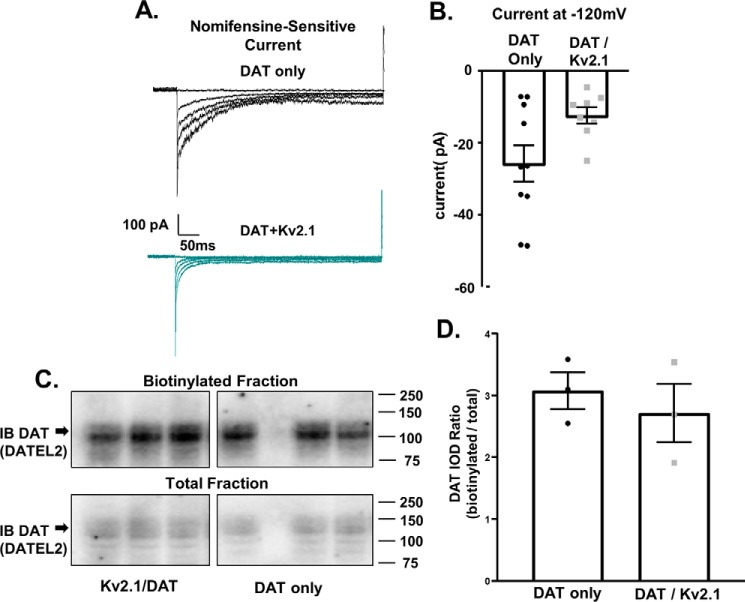
The data presented thus far support the interpretation that the DAT molecules are associated with Kv2.1 clusters at the surface membrane, and these Kv2.1 clusters decrease METH-induced internalization and membrane mobility of DAT. Therefore, we hypothesized the membrane retention of DAT by Kv2.1 clusters is coupled to concomitant changes in DAT-mediated forward transport to prevent runaway transporter activity. Forward transport of substrate through DAT is coupled to an inward current mediated by Na+ ions. Substrate activation of DAT allows the inward current associated with forward transport to be measured via whole-cell patch-clamp electrophysiology. As reported previously, steady-state DAT currents are measured as the final 100 ms of each given voltage step (9, 40, 41). Therefore, we first tested whether Kv2.1 co-expression influenced DAT-mediated inward current.
In cells expressing Kv2.1, there was a reduction in the nomifensine-sensitive, DAT-mediated inward current at the tested membrane potential (Fig. 6B, DAT only: −25.77 ± 5.03 pA, n = 10 cells; DAT/Kv2.1: −12.38 ± 2.62 pA, n = 8 cells; p =.0405, two-tailed unpaired t test). In addition, we noticed an apparent voltage-dependent decrease in the transient currents. Because Kahligh et al. (41) have shown changes in transient currents correlate with surface DAT expression, we tested the hypothesis that Kv2.1 co-expression reduces surface DAT levels. To test this hypothesis, we compared DAT levels at the plasma membrane in cells with or without Kv2.1. Biotinylation experiments revealed no difference in surface DAT levels when comparing cells with or without Kv2.1 co-expression (Fig. 6C, DAT only: 3.078 ± 0.299; Kv2.1/DAT: 2.715 ± 0.470, ns difference, two-tailed unpaired t test). These data suggest that retained DAT at sites of Kv2.1 clusters is hypofunctional, a putative homeostatic mechanism to counteract the loss of transporter internalization.
Figure 6.
Kv2.1 expression decreases DAT-mediated inward current without reducing surface DAT levels. A, representative recordings obtained in whole-cell patch-clamp configuration with a voltage step from −120 to −40 mV showing the DAT-mediated inward current in YFP–DAT only cells (top) or cells co-expressing YFP–DAT and mCer3–Kv2.1 (bottom). The DAT-mediated inward current is defined as basal whole-cell current minus the current after nomifensine (10 μm) application, canonically described as nomifensine-sensitive current. B, bar graph shows the DAT-mediated inward current at −120 mV in cells expressing DAT alone (black bar) or in the cells co-expressing DAT plus Kv2.1 (teal bar) (p = 0.0405, n = 8–10; unpaired t test). C, representative immunoblot showing surface DAT (biotinylated fraction) and total DAT (total fraction) from cells with or without Kv2.1 co-expression. D, comparison of surface DAT levels in cells expressing DAT only or cell co-expressing Kv2.1 and DAT. The surface DAT level was determined by calculating the ratio of DAT signal from the biotinylated fraction to total DAT levels. Co-expression of Kv2.1 did not alter the surface DAT level compared with cells without Kv2.1 (p = 0.5496, n = 3, unpaired t test).
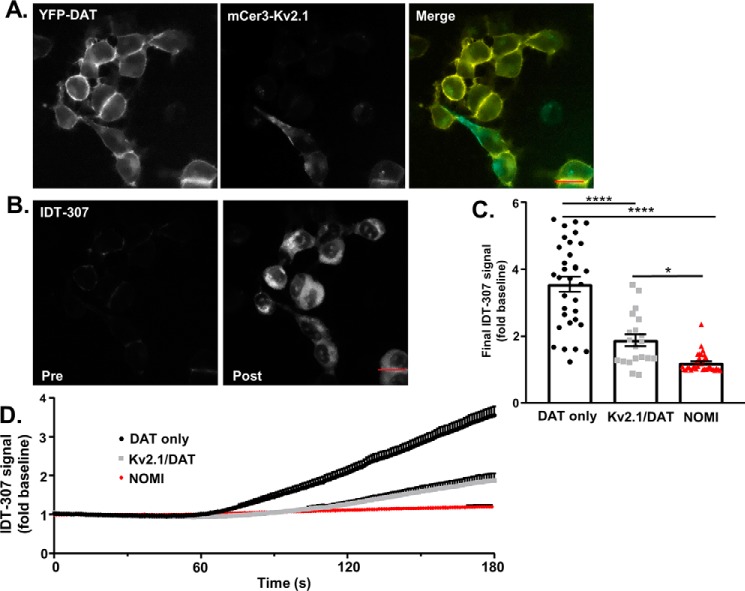
This down-regulation of DAT-mediated forward transport by Kv2.1 was further confirmed using IDT307 (APP+), a fluorescent substrate of monoamine transporters (Fig. 7B) (42). Similar to the measured decreased in the DAT-mediated inward current, Kv2.1 expression significantly decreased IDT307 uptake through DAT (Fig. 7C, DAT only: 3.551 ± 0.224-fold baseline, n = 33 cells from seven independent experiments; Kv2.1/DAT: 1.880 ± 0.174-fold baseline, n = 20 cells from seven independent experiments; p < 0.0001, Tukey's test following one-way ANOVA). Preincubation with nomifensine (DAT blocker, 10 μm) prevented IDT307 uptake, confirming the uptake is via DAT (NOMI: 1.202 ± 0.045-fold baseline, n = 37 cells from six independent experiments; p < 0.0001 versus DAT only; p = 0.0182 versus Kv2.1/DAT, Tukey's test following one-way ANOVA). One potential explanation for a down-regulation of forward transport with no concomitant loss of available transporters at the membrane is an alteration of the conformational equilibrium of DAT by Kv2.1.
Figure 7.
Kv2.1 expression decreases DAT-mediated uptake. A, representative images of the stacked membrane of YFP DAT cells (right panel) or cells expressing both YFP_DAT and Kv2.1 (middle panel) (scale bars, 20 μm). B, representative baseline fluorescence signal (Pre, left) and the fluorescence signal after IDT-307 uptake (Post, right) (scale bars, 20 μm). C, IDT-307 uptake (shown as fold increased above baseline signal) in cells expressing DAT alone or co-expressing Kv2.1. Cells co-expressing Kv2.1 and DAT showed a significantly lower IDT-307 uptake (DAT only: 3.385 ± 0.247, n = 33 cells from seven independent experiments; Kv2.1/DAT: 1.846 ± 0.180, n = 20 cells from seven independent experiments; p < 0.0001, Tukey's test following one-way ANOVA). Pretreatment with the DAT blocker NOMI significantly reduced IDT307 uptake compared with both experimental groups (NOMI: 1.202 ± 0.045, n = 37 cells from six independent experiments; p < 0.0001 versus DAT only, p = 0.0182 versus Kv2.1/DAT, Tukey's test following one-way ANOVA). D, time course of the IDT-307 uptake for all experimental groups. The presence of Kv2.1 significantly reduced the uptake of IDT-307 compared with cells expressing DAT alone (p = 0.0002, F(1,45) = 15.95, two-way ANOVA).
Kv2.1 attenuates DAT function via an alteration of transporter conformational equilibrium
The current working model of dopamine transport states that DAT begins the transport cycle in an “outward facing” conformation, exposing substrate-binding domains to the extracellular space; upon substrate binding, DAT shunts to an “inward-facing” conformation to expose the substrate-binding domains to the intracellular space and release the bound molecules into the cell (1). However, substrate-independent factors such as membrane microdomain composition and protein–protein interactions also impact the proportion of transporters in the outward- versus inward-facing conformation at any given time (8, 43). To determine the influence of Kv2.1 on DAT's conformational equilibrium, we employed a novel assay using the fluorescent cocaine analog JHC1-064 (44, 45).
DAT blockers, including cocaine and its fluorescent analog JHC1-064 bind DAT molecules that exist in an outward-facing conformation (44, 46). To determine the relative levels of inward- versus outward-facing DAT, cells expressing YFP-DAT or cells co-expressing YFP-DAT/mCer3–Kv2.1 were incubated with JHC1-064, and the ratio of the YFP–DAT signal to JHC1-064 was calculated at the stacked membrane region of the cell (Fig. 8, A, C, and D). Comparing the ratio between cells co-expressing DAT and Kv2.1 with those expressing DAT alone revealed a significant increase in the ratio of YFP–DAT signal to JHC1-064 signal (Fig. 8B, DAT only: 1.527 ± 0.059, n = 44 cells from five independent experiments; Kv2.1/DAT: 1.977 ± 0.113, n = 35 cells from five independent experiments; p = 0.0004, two-tailed unpaired t test) suggesting a relative increase in the level of inwardly-facing transporters in DAT/Kv2.1 cells (Fig. 8A). Because modifications that shift DAT's conformational equilibrium toward more inwardly-facing transporters have been shown to decrease substrate uptake through the transporter, it is plausible that Kv2.1's alteration of conformational equilibrium toward more inwardly-facing transporters is responsible for the reduced DAT-mediated inward current and uptake (47).
Figure 8.
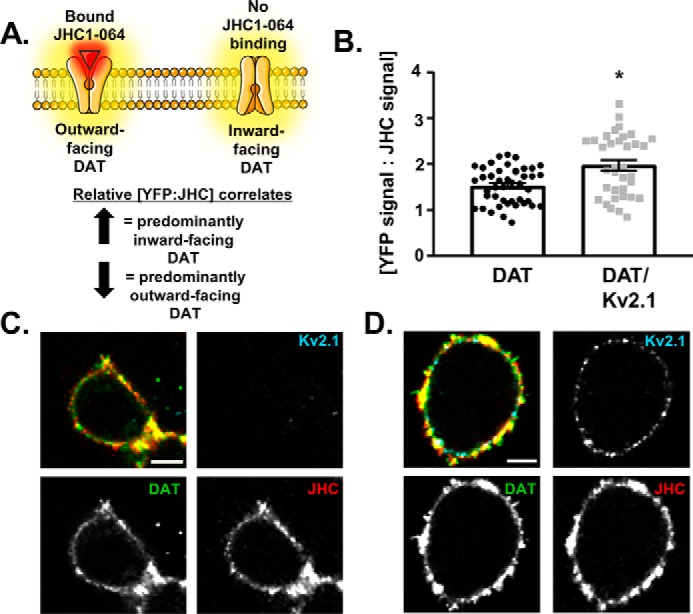
DAT adopts an inward-facing conformation in the presence of Kv2.1. A, schematic of the JHC1-064–binding paradigm used to determine the relative conformational preference of DAT. JHC1-064 binds to the outwardly-facing conformation of DAT. An increase in the ratio of YFP–DAT signal to JHC1-064 signal suggests a higher proportion of the transporters exist in an outwardly-facing conformation. B, quantification and comparison of the ratio of YFP–DAT signal to JHC1-064 signal in cells expressing DAT alone versus cells co-expressing DAT with Kv2.1. The YFP–DAT/JHC1-064 ratio was increased in cells co-expressing Kv2.1 compared with cells expressing DAT alone (p = 0.0004, n = 44 cells (DAT only) and 35 cells (DAT/Kv2.1) from five independent experiments, unpaired t test). C and D, representative images of YFP–DAT signal (lower left panels), mCer3–Kv2.1 signal (upper right panels), and JHC1-064 signal (upper right panels) in either a DAT-only cell (C) or a DAT/Kv2.1 cell (D) (scale bars, 5 μm).
Discussion
We have determined the extent to which Kv2.1 functionally interacts with DAT to regulate transporter internalization and its activity, and the degree by which this process depends upon clustering of Kv2.1 (Fig. 9). Using immunofluorescent confocal microscopy, we confirmed the expression and canonical clustered localization of Kv2.1 in midbrain dopamine neurons. Co-immunoprecipitation and live-cell FRET microscopy revealed the interaction between Kv2.1 and DAT is dynamically regulated, where DAT activation increased the proximity of the two proteins. However, no such regulation occurred between DAT and a nonclustering Kv2.1 mutant, supporting the interpretation that Kv2.1 clusters act as discrete sites of DAT regulation. We also found that Kv2.1 cluster association decreased the lateral mobility and the canonical cell surface redistribution of DAT. Functionally, co-expression of Kv2.1 reduced DAT-mediated inward current and substrate uptake, and this was due to a shift in DAT's conformational equilibrium toward more inward-facing transporters. Our data suggest Kv2.1 clusters may act as an endogenous down-regulator of DAT activity specifically at sites of clustered Kv2.1 channels.
Figure 9.
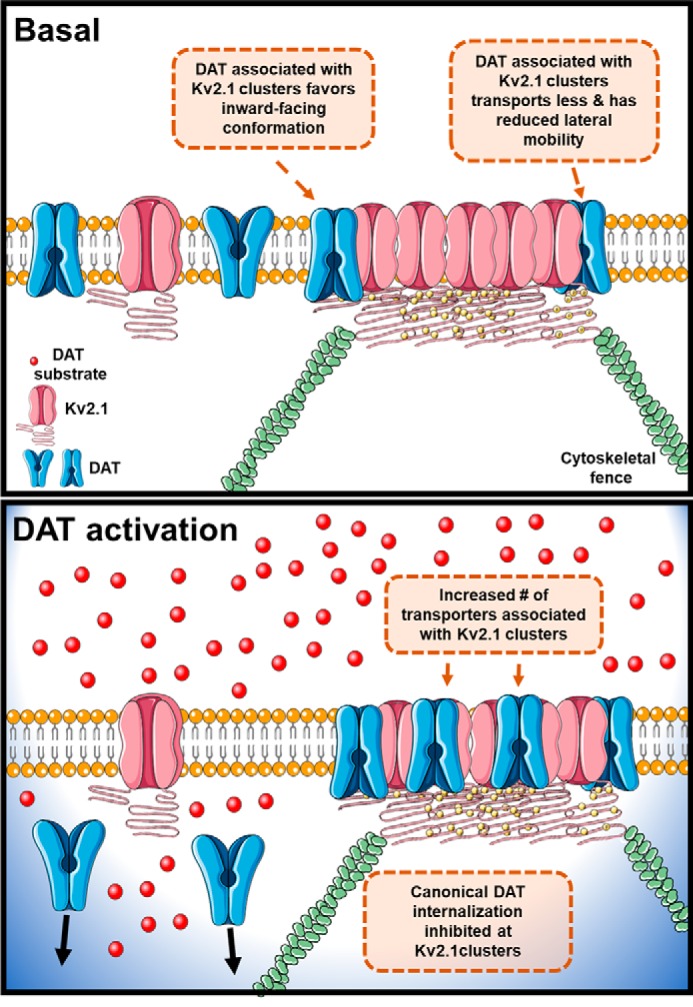
Proposed model for the interaction between Kv2.1 and DAT. We hypothesize that in basal conditions some transporters are associated with Kv2.1 clusters. This association can be due either to a direct interaction with Kv2.1 or within a protein complex containing the cytoskeletal elements known to stabilize Kv2.1 clusters (“cytoskeletal fence”). DAT in Kv2.1 clusters is stabilized in an inward-facing conformation, resulting in decreased uptake. When activated, additional DAT molecules become ensnared at Kv2.1 clusters decreasing the canonical cell surface redistribution of transporters in response to transporter activation.
Super-resolution microscopy indicates DAT distribution in the soma, and the axon-initial-segment of dopamine neurons is irregular, and this functional organization of DAT is affected by neuronal activity (48). Similarly, Kv2.1 is asymmetrically targeted to the axon-initial-segment, a neuronal compartment adjacent to the soma that is involved in signal summation and action potential generation (26, 49, 50), suggesting Kv2.1 activation or inhibition can regulate neuronal firing activity. Consistent with this interpretation, blockade of Kv2.1 in substantia nigra dopamine neurons increased the spontaneous firing frequency while decreasing the magnitude of the after-hyperpolarization of spontaneously-generated action potentials (17, 23).
Using both confocal and TIRF microscopy, we found that Kv2.1 and DAT form “co-clusters” at or near the plasma membrane (Fig. 4A). As predicted by the reported activity-dependent nanodomain distribution of these proteins (48, 51), methamphetamine activation of DAT increased the proximity of the two proteins and inhibited canonical DAT internalization. Following METH stimulation of DAT activity, there was a modest increase in surface DAT levels at the membrane nanodomain containing Kv2.1 clusters, as opposed to canonical DAT internalization. The significant reduction in the DAT's lateral membrane mobility as measured by live-cell FRAP microscopy identified a potential mechanism for the decreased DAT internalization at Kv2.1 clusters. Given the impact on DAT conformational equilibrium, ionic current, and internalization behavior, this raises the possibility that DAT is differentially regulated in subcellular compartments based on the relative amount of Kv2.1 clustering present at each site. However, the subcellular distribution of Kv2.1 in distinct regions in dopamine neurons must first be examined to determine whether this type of differential regulation can alter DAT behavior in a subcellular-specific manner. This hypothesis is consistent with our work and others reporting that DAT localized to neuronal extensions preferentially adopts a clustered pattern (48, 52). Our data suggest Kv2.1 clusters on the membrane of dopamine neurons can influence membrane organization of DAT and its internalization in response to activation. This supports the possibility that the observed clustering of DAT is a result of reorganization induced by Kv2.1 clusters. However, simultaneous super-resolution imaging of both proteins will be necessary to examine this possibility. Interestingly, recent reports have shown Kv2.1 localization is dysregulated in models of neurodegenerative disease, suggesting a vital role for the channel's clustered distribution in normal neuronal physiology as well as stress-induced pathology (20, 51). The degree to which clustered Kv2.1 localization impacts dopaminergic physiology may therefore shed light on the heightened vulnerability to degermation of these neurons. In summary, our data support the conclusion that Kv2.1 and DAT functionally interact, and this interaction can modulate dopamine neurotransmission.
Experimental procedures
Drugs and chemicals
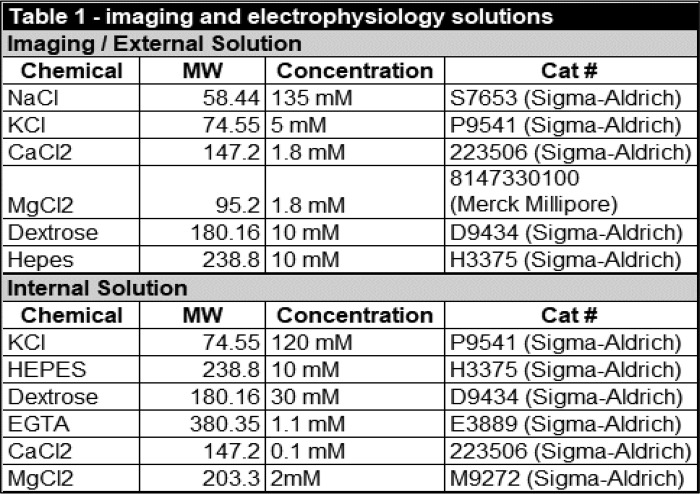
Unless indicated, all drugs and chemicals were purchased from Sigma. A summary of all chemicals, drugs, and antibodies used in this study can be found in in Tables 1–4.
Table 1.
External and internal solution constituents
Table 2.
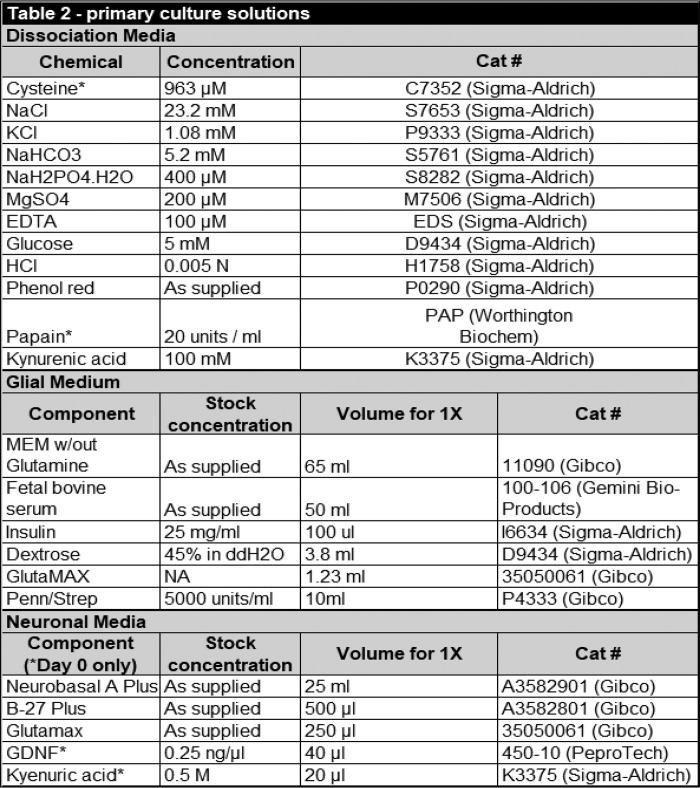
Primary culture solution constituents
Table 4.
Plasmid constructs
EYFP is enhanced yellow fluorescent protein.
| Protein | Fluorophore | Vector | Source |
|---|---|---|---|
| Kv2.1 | GFP | RBG4 | Trimmer (25) |
| s586a–Kv2.1 | GFP | RBG4 | Trimmer (38) |
| Kv2.1 | mCerulean3 | mCerulean3-C1 | M. Davidson (Vector Labs and Addgene) |
| DAT | Tag RFP | pTagRFP–T-C1 | Melikian (55) |
| DAT | EYFP | stable expressing (pEYFP-N1) | Javitch (41) |
| Transferrin receptor | mCerulean | mCerulean | M. Davidson (Addgene) |
| E YFP | EYFP | pEYFP–N1 | Clontech |
| mCerulean3 | mCerulean3 | mCerulean3-C1 | M. Davidson (Addgene) |
| FRET8 | mCerulean/mVenus | pEGFP-C1 | Piston (56) |
| EEA1 | Tag RFP | pcDNA3 | S. Corvera (Addgene) |
Animals
All procedures utilizing animals were conducted in accordance with the University of Florida Institutional Animal Care and Use Committee (IACUC) policies and adhered to the guidelines established by the National Institute of Health. WT C57BL/6J mice and Sprague Dawley rats were obtained from the University of Florida Animal Care Services and were maintained on a 12-h light/dark cycle with food and water available ad libitum in their home cages.
Ventral midbrain primary culture and immunocytochemistry
Primary cultures of ventral midbrain dopamine neurons were prepared as described (6). Briefly, P0 or P1 WT pups of both sexes were anesthetized on ice before rapid decapitation and brain extraction. Whole brains were submerged in ice-cold Hanks' balanced salt solution and allowed to cool for ∼10 min before the ventral midbrain was isolated by removing the cerebellum, cortical lobes, and dorsal-most one-third of the mesencephalon. Isolated ventral mesencephalon tissue was transferred into dissociation media (Table 2) oxygenated with 95% CO2 and 5% O2 and allowed to incubate for 2 h at 37 °C. Following dissociation, tissue was transferred to a 50-ml conical tube and gently washed two times with glial media (Table 2), before being triturated with 5 ml of glial media. Tissue was gently triturated using progressively smaller micropipette tips until the solution was homogeneous, at which point it was centrifuged for 3 min at 500 × g at room temperature to pellet dissociated cells. Supernatant was removed, and the pellet was suspended in glial media (1 ml per animal) before being passed through a 70 μm cell strainer. Cells from this solution were plated on 12-mm glass coverslips coated with 100 μg/ml poly-d-lysine and 5 μg/ml laminin. Following 2 h of incubation, coverslips were gently flooded with 2 ml of neuronal media supplemented with glial-derived neurotrophic factor and kyneurate as described in Table 2. Cells were fed every 4 days by exchanging 1 ml for fresh neuronal media and fixed for immunolabeling on day 10 in vitro.
Immunofluorescence labeling and imaging
Mice used for immunohistochemistry were 4–5-week-old males; rats used were 4-month-old males. Both species were anesthetized with isoflurane until consciousness was lost and then fitted with custom-made anesthetic masks for continuous isoflurane delivery until time of death. An incision was made just below the sternum to allow access to the diaphragm, which was then severed to terminate the animal and expose the heart. An initial puncture was made in the right atrium before perfusing 10 ml (mice) or 300 ml (rats) of ice-cold phosphate-buffered saline (PBS) followed by 10 ml (mice) or 300 ml (rats) of freshly prepared 4% paraformaldehyde (PFA) in PBS through the left ventricle. Brains were then extracted and post-fixed in 4% PFA in PBS overnight. Rat tissue was cryoprotected by sequential storage in 10% sucrose until sunk, and then 30% sucrose until sunk. For mouse tissue, 40-μm–thick sections containing the ventral midbrain were cut on a Vibratome 1000 plus sectioning system (Ted Pella Inc., Redding CA). Rat brains were mounted and frozen in O.C.T Compound (ThermoFisher Scientific, Hampton, NH) and 35-μm sections were cut using a Leica CM1850 cryostat (Leica Microsystems, Buffalo Grove, IL).
Slices were blocked and permeabilized for 1 h at 37 °C in PBS containing 0.3% Triton X-100 (Sigma) and 10% normal goat serum (Lampire Biological Products, Pipersville, PA). Sections were immediately transferred to primary antibody solution containing 0.1% Triton X-100 and 5% normal goat serum. The primary and secondary antibodies used are listed in Table 3. Following incubation, slices were rinsed three times for 30 min with PBS and labeled with secondary antibody for 1 h at room temperature in the same blocking solution used for primary incubation. Slices were then washed for 24 h in PBS at room temperature before being mounted onto slides for visualization using Fluoromount-G (Southern Biotechnology, Birmingham, AL).
For cultured neurons, cells were fixed with ice-cold 4% paraformaldehyde in PBS from a 32% commercial stock (Electron Microscopy Sciences, Hatfield, PA) for 25 min at room temperature. Coverslips were washed three times with PBS and then blocked and permeabilized for 30 min at room temperature in PBS containing 0.5% Triton X-100 (Sigma) and 10% normal goat serum (Lampire Biological Products, Pipersville, PA). Coverslips were incubated at 4 °C overnight in primary antibody solution containing 0.1% Triton X-100 and 5% normal goat serum. Control coverslips were incubated in blocking solution with no primary antibody added. Following incubation, coverslips were rinsed three times for 10 min with PBS and labeled with secondary antibody for 1 h at room temperature in the same blocking solution used for primary incubation. Cells were then washed for 24 h in PBS at room temperature before being mounted onto slides for visualization using Fluoromount-G (Southern Biotechnology, Birmingham, AL). The primary and secondary antibodies used are listed in Table 3.
Confocal imaging was carried out on a Nikon A1 laser-scanning confocal microscope (Nikon Instruments, Melville, NY). Samples were visualized through a ×60 1.4 NA oil-immersion objective (Nikon Instruments, Melville NY). Excitation was achieved with 488 and 647 nm for DAT and Kv2.1, respectively; emission was captured at 525 and 685 nm for DAT and Kv2.1, respectively. To prevent nonspecific bleed through, excitation and emission detection were activated sequentially in a nonoverlapping series. Image processing, including deconvolution and denoising of the displayed representative images, was carried out using Nikon Elements imaging software (Nikon Instruments, Melville, NY). All images presented together in a given panel were manipulated identically.
Cell culture and transient transfections
A list of all constructs used in this study can be found in Table 4. All constructs were generous gifts from the stated source. GFP-tagged Kv2.1 was a generous gift from Dr. Jim Trimmer (University of California, Davis) and was used to generate the mCerulean3–Kv2.1 (mCer3–Kv2.1) utilized in this study (25). Briefly, rat Kv2.1 was digested from GFP–Kv2.1 and subcloned into mCerulean3-C1 (gift from Michael Davidson, Addgene plasmid no. 54605) with EcoRI and SacII restriction enzymes. Correct insertion of the construct was verified through Sanger sequencing.
Parental and YFP–DAT stably expressing human embryonic kidney (HEK-293; EM4 clonal line) cells were cultured as described previously (53, 54). Cells were grown in Dulbecco's modified minimum essential medium (Corning, 10-017-CV) to ∼85% confluency in 25-cm2 flasks before transient transfections and plating. For the generation of Kv2.1/DAT cells, parental HEK cells were transiently transfected with GFP–Kv2.1 and RFP–DAT, or YFP–DAT HEK cells were transiently transfected with mCer3–Kv2.1 in flasks. Transfections were carried out with polyethyleneimine (PEI, Polysciences Inc., Warrington, PA) at a 2:1 ratio (10 μg of plasmid, 20 μg of PEI). The PEI/DNA solution was made in 1 ml of sterile double distilled H2O and allowed to rest at room temperature for 20 min before being added into 5 ml of standard media in flasks. These cells were then split the following day onto either coverslips or glass bottom dishes and used 24–48 h following plating.
Co-immunoprecipitation of Kv2.1 and DAT
Brain tissue samples from Sprague-Dawley rats (60–90 days old) were homogenized with a glass/Teflon homogenizer (20× strokes) in 10 volumes of ice-cold lysis buffer (125 mm NaCl, 10% (v/v) glycerol, 1 mm EDTA, 1 mm EGTA, and HEPES (20 mm, pH 7.6)), containing protease inhibitors (1 μm leupeptin, 150 nm aprotinin, 1 μm E-64, 500 μm 4-(2-aminoethyl)benzenesulfonyl fluoride, 1 mm phenylmethylsulfonyl fluoride, and 0.5 mm EDTA; Calbiochem). The homogenates were incubated on a microtube rotator at 4 °C for 1 h in the presence of 1% (v/v) Triton X-100, and insoluble material was removed by centrifugation at 16,000 × g, 15 min at 4 °C. The supernatants obtained (protein lysates) were collected, measured for protein concentration, and used in the immunoprecipitations and immunoblots. HEK cells overexpressing DAT and Kv2.1 were homogenized in ice-cold lysis buffer containing protease inhibitors and 1% (v/v) Triton X-100, and protein lysates were obtained as described above.
Immunoprecipitations were performed using 0.5 mg of total protein. To immunoprecipitate DAT from rat brain protein lysates and HEK cells overexpressing DAT and Kv2.1, the homogenates were incubated overnight at 4 °C with a polyclonal anti-DAT antibody (Table 3, Santa Cruz Biotechnology, C-20, dilution 1:100) and a monoclonal anti-DAT antibody (Millipore MAB369, dilution 1:100), respectively, followed by the addition of 80 μl of a mixture of protein A- and protein G-Sepharose beads (2 h at 4 °C in a rotatory shaker). The immunoprecipitated proteins were recovered by centrifugation at 10,000 × g for 1 min (4 °C) and washed four times with ice-cold lysis buffer supplemented with 1% (v/v) Triton X-100, and pellets were resuspended in 40 μl of 4× protein sample buffer containing β-mercaptoethanol. The proteins were separated by 10% SDS-PAGE and transferred to nitrocellulose membranes using the Bio-Rad system. For immunodetection, the nitrocellulose membranes were first blocked for 1 h in TBS-T buffer (50 mm Tris-HCl, 150 mm NaCl, 0.2% Tween 20) containing 5% fat-free dry milk (blocking buffer) and then incubated with the indicated primary antibody for 1 h at room temperature in blocking buffer, washed three times for 5 min each, and incubated with a horseradish peroxidase-conjugated secondary antibody (dilution 1:5000) for 1 h at room temperature in blocking buffer. After all antibody incubations, membranes were washed three times with TBS-T buffer, and immunoreactive bands were visualized using the ClarityTM Western ECL Substrate (Bio-Rad).
Surface DAT determinations
HEK cells transfected with DAT and Kv2.1 were cultured in 4-well plates washed three times with ice-cold PBS, and then each well was incubated with gentle agitation for 30 min at 4 °C with 1 ml of 1.5 mg/ml sulfo-NHS-SS-biotin prepared in biotinylation buffer (150 mm NaCl, 2 mm CaCl2, 10 mm triethanolamine, pH 7.8). The reaction was quenched by incubating the cells for an additional 15 min at 4 °C with 50 mm glycine in PBS. Cells were then washed three times with ice-cold PBS and solubilized at 4 °C for 1 h in ice-cold lysis buffer containing 1% Triton X-100 and protease inhibitors. The protein lysates were then divided into two aliquots: one for pulldown biotinylated proteins (400 μl), and the other to determine total DAT and Kv2.1 (100 μl). The biotinylated proteins were precipitated incubating the biotinylated protein lysates for 1 h at 4 °C with 80 μl of ultralink-immobilized avidin beads (50% slurry in lysis buffer, Pierce). Finally, 40 μl of 2× sample buffer was added to each protein sample to analyze DAT and Kv2.1 expression by SDS-PAGE on 10% Tris-HCl polyacrylamide gels and immunoblotting using antibodies against DAT and Kv2.1 as outlined in Table 3.
Live-cell FRET
Kv2.1/DAT cells were plated in 35-mm glass bottom dishes (MatTek, Ashland, MA) 24–48 h before imaging. Prior to imaging, cells were briefly washed three times with imaging buffer, the constituents of which can be found in Table 1. All cells were imaged at a single confocal plane near the basal membrane. For nomifensine pretreatment, cells were incubated in 10 μm nomifensine in imaging buffer for 10 min at 37 °C prior to imaging. For drug treatment, cells were selected a priori, and 200 μl of external solution with or without METH was added to 800 μl of external solution in the dish to achieve the desired final concentration. METH or vehicle was allowed to diffuse for 40 s before cells were imaged throughout the following 7 min. To measure FRET, three frames were imaged prior to photobleaching to determine the basal GFP–Kv2.1 intensity. Next, RFP–DAT (photoacceptor) was bleached at least 80% in a target region containing GFP–Kv2.1 clusters. Three subsequent images were taken, and the following formula was applied to calculate the level of FRET: (GFPF, post − GFPFpre)/GFPF, post, where GFPF represents the average GFP–Kv2.1 fluorescence signal (AFU) captured in the ROI where RFP–DAT signal was bleached. Only cells that exhibited ≥80% RFP–DAT bleaching threshold were analyzed. All images were background subtracted using a locally drawn background ROI.
Live-cell FRAP
Kv2.1/DAT cells were plated and washed prior to imaging as above in FRET experiments. As described above, images were acquired at an optical plane near the basal membrane where both DAT and Kv2.1 localization were visually appreciable over the entire cell surface. Previous reports suggest a 3–5 μm circular ROI at the basal membrane reliably measures the lateral mobility of DAT within the membrane (11, 30). Therefore, a 5 μm circular ROI was selected for photobleaching with a reference ROI identical in size placed on either a region of the cell that was not bleached or a nearby cell expressing RFP–DAT that was not bleached. Five consecutive images were taken prior to photobleaching to determine the baseline level of RFP–DAT signal. The region within the ROI was then selectively photobleached, and RFP–DAT signal was then measured in the photobleached region for 3.5 min to determine the rate of fluorescence recovery. Background subtraction was carried out prior to all measurements using a local background ROI. To determine the percent of DAT in the immobile fraction, the normalized final signal was subtracted from baseline and converted to a percentage.
YFP–DAT internalization using total internal reflection fluorescent microscopy
TIRFM was conducted on a Nikon Ti Eclipse inverted microscope equipped with 445-and 514-nm solid-state lasers (Coherent Inc., Santa Clara, CA) fed through a ×60 1.49 NA Apo TIRF objective (Nikon Instruments, Melville, NY). Images were captured using a CoolSNAP HQ2 CCD camera (Photometrics, Tucson, AZ). Kv2.1/DAT cells were plated in 35-mm glass bottom dishes (MatTek, Ashland, MA) 24–48 h before imaging. Cells were briefly washed three times with external solution before being placed in the stage holder, at which point fresh external solution was continuously perfused at 37 °C. Perfusion was carried out at ∼3 ml/min using an automatic peristaltic pump (Instech Laboratories, Plymouth Meeting, PA). Cells were imaged at a rate of 0.3 Hz for 1 min to determine basal fluorescence levels for both proteins before switching to perfusion of imaging buffer containing 100 μm METH. Cells were then continually imaged at 0.3 Hz for 5 min to observe changes in fluorescence intensity. Control cells were perfused with imaging buffer and imaged as above. Analysis was carried out using Nikon Elements (Nikon Instruments, Melville, NY). Briefly, binary masks were generated using automatic fluorescence thresholding to distinguish areas of the membrane occupied by mCer3–Kv2.1 and YFP–DAT. The binary layer for Kv2.1-associated DAT was defined as regions of the YFP–DAT binary mask that also contained the mCer3–Kv2.1 binary mask. Conversely, YFP–DAT internalization in cells not expressing Kv2.1 was measured using the entirety of the basal membrane. The change in YFP–DAT fluorescence intensity in each region was normalized to the average level observed in that region during the baseline period. All images were background subtracted using a local background ROI.
Whole-cell electrophysiology
Recordings were performed on a Nikon FN-1 upright microscope (Nikon Instruments, Melville, NY) and Narishige mounting adaptor (Narishige International USA, Amityville, NY) mounted on an anti-vibration table (TMC, Peabody, MA). Gravity perfusion lines were run through an eight-channel valve controller (Warner Instruments, Hamden, CT) and set to a flow rate of ∼2 ml/min. Kv2.1/DAT cells were plated on uncoated 12-mm glass coverslips (Chemglass Life Sciences, Vineland, NJ) 48–72 h prior to recording. Once placed into the recording chamber (Warner Instruments, Hamden, CT), coverslips were continuously perfused with fresh external solution. Borosilicate pipettes (World Precision Instruments, Sarasota, FL) were pulled on a Sutter P2000 laser puller (Sutter Instrument, Novato, CA). The pipette resistance was between 1.5 and 3.5 megohms. The constituents of the internal recording solution are listed in Table 1. All currents were recorded from cells with a high-resistance seal (>600 megohms in whole-cell mode), and currents were acquired using an Axopatch 200B amplifier and Digidata 1440A digitizer run through Axon pCLAMP 10 (Molecular Devices, Sunnyvale, CA).To determine the DAT-mediated inward current, a voltage-current (I/V) curve was generated from −120 to −40 mV in 10-mV steps (250 μs) from a holding potential of −100 mV. Current values were calculated during the final 100 ms of each voltage, and I/Vs were generated for cells under basal conditions and 2.5 min after perfusion with 10 μm METH. All traces shown are following subtraction of current in the presence of a DAT blocker (nomifensine, 10 μm) as described previously (53).
IDT-307 uptake imaging
YFP–DAT cells were transiently transfected with mCer3–Kv2.1 as above and plated onto uncoated 12-mm glass coverslips. Coverslips were placed into an imaging chamber (Warner Instruments RC-26G) mounted on a Nikon Eclipse FN-1 and visualized with a Nikon ×40 0.8NA NIR APO objective (Nikon Instruments, Melville, NY). Solution exchange was achieved using a Warner VC-8 automated perfusion system at a rate of ∼2 ml/min (Warner Instruments, Hamden, CT). Solution was maintained at 37 °C using a dual-channel temperature controller (Warner Instruments, Hamden, CT). Excitation was achieved using a SpectraX light engine (Lumencor, Beaverton, OR) controlled by Nikon Elements (Nikon Instruments, Melville, NY). Images were acquired at 1 Hz using an Andor Xyla 4.2 PLUS with a constant exposure time of 100 ms and a conversion gain of 4 (Andor Technology, Belfast, UK). All videos were captured with a constant pixel size (0.16 μm per pixel), but the field of view was cropped to minimize the final image size. For IDT-specific signal, the 488-nm LED was used, and cells were imaged for 30 s to determine the basal fluorescence signal detected. Solution was then changed to imaging buffer containing 1 μm IDT307 (Sigma) and imaged for 2.5 min. As a control, cells were imaged identically as described with the addition of 10 μm nomifensine (Sigma) to the imaging buffer. Analysis was conducted in Nikon Elements (Nikon Instruments, Melville, NY), and data are shown as the full-time series or the final IDT307 signal measured at 3 min.
Live-cell JHC1-064 imaging
Cells were handled and plated as described above for FRET and TIRF imaging. To label the outwardly-facing conformation of DAT molecules at the membrane, cells were incubated in 100 nm of JHC1-064, a fluorescent cocaine analog (44). JHC1-064 incubation was carried out at 4 °C to prevent transporter internalization as described previously (9). Cells were washed three times with 4 °C external solution and imaged at room temperature using a ×60 1.4 NA oil-immersion objective (Nikon Instruments, Melville, NY). To acquire images, a random point was chosen, and the z-plane was set (using Nikon perfect focus) to capture the cells' stacked membrane. Image scans containing 16 surrounding fields of view were generated and stitched together to make one large image (field of view overlap 0.1%). Cells expressing Kv2.1 and DAT or DAT alone were cropped into individual images and deconvolved using the Nikon Elements automatic 2D deconvolution plugin. For JHC1-064-binding quantification, an ROI was drawn around the stacked membrane of the cell, and the ratio of YFP–DAT signal (AFU) to JHC1-064 signal was calculated for each cell.
Statistics
Statistical analysis was run on Prism 8.0 (Graphpad Software, La Jolla, CA). An α of 0.05 was used to determine statistical significance. Specific tests used for each figure, including the n and p values, are described in the figure legends and under the “Results.” All tests were run under the assumptions of a normal distribution and similar variance among experimental groups. Data are presented as the mean ± S.E.
Author contributions
J. J. L., G. E. T., and H. K. conceptualization; J. J. L., J. A. P., P. M. M., M. L., C. H., K. D., A. T. C., and D. N. K. data curation; J. J. L., J. A. P., P. M. M., M. L., C. H., K. D., and A. T. C. formal analysis; J. J. L. and M. L. methodology; J. J. L. writing-original draft; J. A. P., P. M. M., G. E. T., and H. K. writing-review and editing; M. L. supervision; G. E. T. and H. K. funding acquisition.
Supplementary Material
Acknowledgments
We thank Jim Trimmer for Kv2.1 plasmids and advice and suggestions on this work, Jeremy McIntyre and Kalene Jasso for assistance with the generation of the mCer3–Kv2.1 used within, and Amy Hauk Newman for providing JHC1-064 and for advice and suggestions on this work. The clipart displayed was obtained from Servier Medical Art under a Creative Commons Attribution 3.0 unported license.
This work was supported by National Institutes of Health NINDS Training Grants 5T32NS082168-04 (to J. J. L.) and 2R01NS071122-07A1 (to H. K.), NIDA Grant 5R01DA026947-10, National Institutes of Health Office of the Director Grant 1S10OD020026-01 (to H. K.), and NIDA Grant 5R01DA038598-05 (to G. E. T.). The authors declare that they have no conflicts of interest with the contents of this article. The content is solely the responsibility of the authors and does not necessarily represent the official views of the National Institutes of Health.
This article contains Figs. S1 and S2.
- DAT
- dopamine transporter
- RFP
- Tag-red fluorescent protein
- mCer3
- mCerulean3
- METH
- methamphetamine
- NOM
- nomifensine
- FRET
- Forster resonance energy transfer
- FRAP
- fluorescence recovery after photobleaching
- TIRFM
- total internal reflection microscopy
- HEK
- human embryonic kidney cell
- PEI
- polyethyleneimine
- ANOVA
- analysis of variance
- DA
- dopamine
- AFU
- arbitrary fluorescence unit
- ns
- not significant
- VEH
- vehicle
- PFA
- paraformaldehyde
- ROI
- region of interest
- NOMI
- nomifensine.
References
- 1. Torres G. E., Gainetdinov R. R., and Caron M. G. (2003) Plasma membrane monoamine transporters: structure, regulation and function. Nat. Rev. Neurosci. 4, 13–25 10.1038/nrn1008 [DOI] [PubMed] [Google Scholar]
- 2. Giros B., Jaber M., Jones S. R., Wightman R. M., and Caron M. G. (1996) Hyperlocomotion and indifference to cocaine and amphetamine in mice lacking the dopamine transporter. Nature 379, 606–612 10.1038/379606a0 [DOI] [PubMed] [Google Scholar]
- 3. Kurian M. A., Zhen J., Cheng S.-Y., Li Y., Mordekar S. R., Jardine P., Morgan N. V., Meyer E., Tee L., Pasha S., Wassmer E., Heales S. J., Gissen P., Reith M. E., and Maher E. R. (2009) Homozygous loss-of-function mutations in the gene encoding the dopamine transporter are associated with infantile parkinsonism-dystonia. J. Clin. Invest. 119, 1595–1603 [DOI] [PMC free article] [PubMed] [Google Scholar]
- 4. Ng J., Zhen J., Meyer E., Erreger K., Li Y., Kakar N., Ahmad J., Thiele H., Kubisch C., Rider N. L., Morton D. H., Strauss K. A., Puffenberger E. G., D'Agnano D., Anikster Y., et al. (2014) Dopamine transporter deficiency syndrome: phenotypic spectrum from infancy to adulthood. Brain 137, 1107–1119 10.1093/brain/awu022 [DOI] [PMC free article] [PubMed] [Google Scholar]
- 5. Ingram S. L., Prasad B. M., and Amara S. G. (2002) Dopamine transporter–mediated conductances increase excitability of midbrain dopamine neurons. Nat. Neurosci. 5, 971–978 10.1038/nn920 [DOI] [PubMed] [Google Scholar]
- 6. Sambo D. O., Lin M., Owens A., Lebowitz J. J., Richardson B., Jagnarine D. A., Shetty M., Rodriquez M., Alonge T., Ali M., Katz J., Yan L., Febo M., Henry L. K., Bruijnzeel A. W., et al. (2017) The σ-1 receptor modulates methamphetamine dysregulation of dopamine neurotransmission. Nat. Commun. 8, 2228 10.1038/s41467-017-02087-x [DOI] [PMC free article] [PubMed] [Google Scholar]
- 7. Melikian H. E., and Buckley K. M. (1999) Membrane trafficking regulates the activity of the human dopamine transporter. J. Neurosci. 19, 7699–7710 10.1523/JNEUROSCI.19-18-07699.1999 [DOI] [PMC free article] [PubMed] [Google Scholar]
- 8. Hong W. C., and Amara S. G. (2010) Membrane cholesterol modulates the outward facing conformation of the dopamine transporter and alters cocaine binding. J. Biol. Chem. 285, 32616–32626 10.1074/jbc.M110.150565 [DOI] [PMC free article] [PubMed] [Google Scholar]
- 9. Richardson B. D., Saha K., Krout D., Cabrera E., Felts B., Henry L. K., Swant J., Zou M. F., Newman A. H., and Khoshbouei H. (2016) Membrane potential shapes regulation of dopamine transporter trafficking at the plasma membrane. Nat. Commun. 7, 10423 10.1038/ncomms10423 . [DOI] [PMC free article] [PubMed] [Google Scholar]
- 10. Cremona M. L., Matthies H. J., Pau K., Bowton E., Speed N., Lute B. J., Anderson M., Sen N., Robertson S. D., Vaughan R. A., Rothman J. E., Galli A., Javitch J. A., and Yamamoto A. (2011) Flotillin-1 is essential for PKC-triggered endocytosis and membrane microdomain localization of DAT. Nat. Neurosci. 14, 469–477 10.1038/nn.2781 [DOI] [PMC free article] [PubMed] [Google Scholar]
- 11. Butler B., Saha K., Rana T., Becker J. P., Sambo D., Davari P., Goodwin J. S., and Khoshbouei H. (2015) Dopamine transporter activity is modulated by α-synuclein. J. Biol. Chem. 290, 29542–29554 10.1074/jbc.M115.691592 [DOI] [PMC free article] [PubMed] [Google Scholar]
- 12. Misonou H., Mohapatra D. P., and Trimmer J. S. (2005) Kv2.1: a voltage-gated K+ channel critical to dynamic control of neuronal excitability. NeuroToxicology 26, 743–752 10.1016/j.neuro.2005.02.003 [DOI] [PubMed] [Google Scholar]
- 13. Deutsch E., Weigel A. V., Akin E. J., Fox P., Hansen G., Haberkorn C. J., Loftus R., Krapf D., and Tamkun M. M. (2012) Kv2.1 cell surface clusters are insertion platforms for ion channel delivery to the plasma membrane. Mol. Biol. Cell 23, 2917–2929 10.1091/mbc.e12-01-0047 [DOI] [PMC free article] [PubMed] [Google Scholar]
- 14. Fox P. D., Haberkorn C. J., Akin E. J., Seel P. J., Krapf D., and Tamkun M. M. (2015) Induction of stable ER–plasma-membrane junctions by Kv2.1 potassium channels. J. Cell Sci. 128, 2096–2105 10.1242/jcs.166009 [DOI] [PMC free article] [PubMed] [Google Scholar]
- 15. Shah N. H., and Aizenman E. (2014) Voltage-gated potassium channels at the crossroads of neuronal function, ischemic tolerance, and neurodegeneration. Transl. Stroke Res. 5, 38–58 10.1007/s12975-013-0297-7 [DOI] [PMC free article] [PubMed] [Google Scholar]
- 16. Misonou H., Mohapatra D. P., Menegola M., and Trimmer J. S. (2005) Calcium- and metabolic state-dependent modulation of the voltage-dependent Kv2.1 channel regulates neuronal excitability in response to ischemia. J. Neurosci. 25, 11184–11193 10.1523/JNEUROSCI.3370-05.2005 [DOI] [PMC free article] [PubMed] [Google Scholar]
- 17. Kimm T., Khaliq Z. M., and Bean B. P. (2015) Differential regulation of action potential shape and burst-frequency firing by BK and Kv2 channels in substantia nigra dopaminergic neurons. J. Neurosci. 35, 16404–16417 10.1523/JNEUROSCI.5291-14.2015 [DOI] [PMC free article] [PubMed] [Google Scholar]
- 18. Feinshreiber L., Singer-Lahat D., Friedrich R., Matti U., Sheinin A., Yizhar O., Nachman R., Chikvashvili D., Rettig J., Ashery U., and Lotan I. (2010) Non-conducting function of the Kv2.1 channel enables it to recruit vesicles for release in neuroendocrine and nerve cells. J. Cell Sci. 123, 1940–1947 10.1242/jcs.063719 [DOI] [PubMed] [Google Scholar]
- 19. Cotella D., Hernandez-Enriquez B., Wu X., Li R., Pan Z., Leveille J., Link C. D., Oddo S., and Sesti F. (2012) Toxic role of K+ channel oxidation in mammalian brain. J. Neurosci. 32, 4133–4144 10.1523/JNEUROSCI.6153-11.2012 [DOI] [PMC free article] [PubMed] [Google Scholar]
- 20. Frazzini V., Guarnieri S., Bomba M., Navarra R., Morabito C., Mariggiò M. A., and Sensi S. L. (2016) Altered Kv2.1 functioning promotes increased excitability in hippocampal neurons of an Alzheimer's disease mouse model. Cell Death Dis. 7, e2100 10.1038/cddis.2016.18 [DOI] [PMC free article] [PubMed] [Google Scholar]
- 21. Maiya R., Ponomarev I., Linse K. D., Harris R. A., and Mayfield R. D. (2007) Defining the dopamine transporter proteome by convergent biochemical and in silico analyses. Genes Brain Behav. 6, 97–106 10.1111/j.1601-183X.2006.00236.x [DOI] [PubMed] [Google Scholar]
- 22. Torres G. E. (2006) The dopamine transporter proteome. J. Neurochem. 97, 3–10 10.1111/j.1471-4159.2006.03719.x [DOI] [PubMed] [Google Scholar]
- 23. Dufour M. A., Woodhouse A., and Goaillard J.-M. (2014) Somatodendritic ion channel expression in substantia nigra pars compacta dopaminergic neurons across postnatal development. J. Neurosci. Res. 92, 981–999 10.1002/jnr.23382 [DOI] [PubMed] [Google Scholar]
- 24. Gantz S. C., Ford C. P., Morikawa H., and Williams J. T. (2018) The evolving understanding of dopamine neurons in the substantia nigra and ventral tegmental area. Annu. Rev. Physiol. 80, 219–241 10.1146/annurev-physiol-021317-121615 [DOI] [PubMed] [Google Scholar]
- 25. Antonucci D. E., Lim S. T., Vassanelli S., and Trimmer J. S. (2001) Dynamic localization and clustering of dendritic Kv2.1 voltage-dependent potassium channels in developing hippocampal neurons. Neuroscience 108, 69–81 10.1016/S0306-4522(01)00476-6 [DOI] [PubMed] [Google Scholar]
- 26. Jensen C. S., Watanabe S., Stas J. I., Klaphaak J., Yamane A., Schmitt N., Olesen S. P., Trimmer J. S., Rasmussen H. B., and Misonou H. (2017) Trafficking of Kv2.1 channels to the axon initial segment by a novel nonconventional secretory pathway. J. Neurosci. 37, 11523–11536 10.1523/JNEUROSCI.3510-16.2017 [DOI] [PMC free article] [PubMed] [Google Scholar]
- 27. Justice J. A., Schulien A. J., He K., Hartnett K. A., Aizenman E., and Shah N. H. (2017) Disruption of Kv2.1 somato-dendritic clusters prevents the apoptogenic increase of potassium currents. Neuroscience 354, 158–167 10.1016/j.neuroscience.2017.04.034 [DOI] [PMC free article] [PubMed] [Google Scholar]
- 28. Fox P. D., Loftus R. J., and Tamkun M. M. (2013) Regulation of Kv2.1 K+ conductance by cell surface channel density. J. Neurosci. 33, 1259–1270 10.1523/JNEUROSCI.3008-12.2013 [DOI] [PMC free article] [PubMed] [Google Scholar]
- 29. O'Connell K. M., Loftus R., and Tamkun M. M. (2010) Localization-dependent activity of the Kv2.1 delayed-rectifier K+ channel. Proc. Natl. Acad. Sci. U.S.A. 107, 12351–12356 10.1073/pnas.1003028107 [DOI] [PMC free article] [PubMed] [Google Scholar]
- 30. Adkins E. M., Samuvel D. J., Fog J. U., Eriksen J., Jayanthi L. D., Vaegter C. B., Ramamoorthy S., and Gether U. (2007) Membrane mobility and microdomain association of the dopamine transporter studied with fluorescence correlation spectroscopy and fluorescence recovery after photobleaching. Biochemistry 46, 10484–10497 10.1021/bi700429z [DOI] [PubMed] [Google Scholar]
- 31. Binda F., Dipace C., Bowton E., Robertson S. D., Lute B. J., Fog J. U., Zhang M., Sen N., Colbran R. J., Gnegy M. E., Gether U., Javitch J. A., Erreger K., and Galli A. (2008) Syntaxin 1A interaction with the dopamine transporter promotes amphetamine-induced dopamine efflux. Mol. Pharmacol. 74, 1101–1108 10.1124/mol.108.048447 [DOI] [PMC free article] [PubMed] [Google Scholar]
- 32. Wouters F. S., Bastiaens P. I., Wirtz K. W., and Jovin T. M. (1998) FRET microscopy demonstrates molecular association of non-specific lipid transfer protein (nsL-TP) with fatty acid oxidation enzymes in peroxisomes. EMBO J. 17, 7179–7189 10.1093/emboj/17.24.7179 [DOI] [PMC free article] [PubMed] [Google Scholar]
- 33. Gu Y., Di W. L., Kelsell D. P., and Zicha D. (2004) Quantitative fluorescence resonance energy transfer (FRET) measurement with acceptor photobleaching and spectral unmixing. J. Microsc. 215, 162–173 10.1111/j.0022-2720.2004.01365.x [DOI] [PubMed] [Google Scholar]
- 34. Stryer L. (1978) Fluorescence energy transfer as a spectroscopic ruler. Annu. Rev. Biochem. 47, 819–846 10.1146/annurev.bi.47.070178.004131 [DOI] [PubMed] [Google Scholar]
- 35. Plant L. D., Dowdell E. J., Dementieva I. S., Marks J. D., and Goldstein S. A. (2011) SUMO modification of cell surface Kv2.1 potassium channels regulates the activity of rat hippocampal neurons. J. Gen. Physiol. 137, 441–454 10.1085/jgp.201110604 [DOI] [PMC free article] [PubMed] [Google Scholar]
- 36. Misonou H., Mohapatra D. P., Park E. W., Leung V., Zhen D., Misonou K., Anderson A. E., and Trimmer J. S. (2004) Regulation of ion channel localization and phosphorylation by neuronal activity. Nat. Neurosci. 7, 711–718 10.1038/nn1260 [DOI] [PubMed] [Google Scholar]
- 37. Shah N. H., Schulien A. J., Clemens K., Aizenman T. D., Hageman T. M., Wills Z. P., and Aizenman E. (2014) Cyclin E1 regulates Kv2.1 channel phosphorylation and localization in neuronal ischemia. J. Neurosci. 34, 4326–4331 10.1523/JNEUROSCI.5184-13.2014 [DOI] [PMC free article] [PubMed] [Google Scholar]
- 38. Lim S. T., Antonucci D. E., Scannevin R. H., and Trimmer J. S. (2000) A novel targeting signal for proximal clustering of the Kv2.1 K+ channel in hippocampal neurons. Neuron 25, 385–397 10.1016/S0896-6273(00)80902-2 [DOI] [PubMed] [Google Scholar]
- 39. Hong W. C., and Amara S. G. (2013) Differential targeting of the dopamine transporter to recycling or degradative pathways during amphetamine- or PKC-regulated endocytosis in dopamine neurons. FASEB J. 27, 2995–3007 10.1096/fj.12-218727 [DOI] [PMC free article] [PubMed] [Google Scholar]
- 40. Khoshbouei H., Wang H., Lechleiter J. D., Javitch J. A., and Galli A. (2003) Amphetamine-induced dopamine efflux. A voltage-sensitive and intracellular Na+-dependent mechanism. J. Biol. Chem. 278, 12070–12077 10.1074/jbc.M212815200 [DOI] [PubMed] [Google Scholar]
- 41. Kahlig K. M., Javitch J. A., and Galli A. (2004) Amphetamine regulation of dopamine transport. Combined measurements of transporter currents and transporter imaging support the endocytosis of an active carrier. J. Biol. Chem. 279, 8966–8975 10.1074/jbc.M303976200 [DOI] [PubMed] [Google Scholar]
- 42. Karpowicz R. J. Jr., Dunn M., Sulzer D., and Sames D. (2013) APP+, a fluorescent analogue of the neurotoxin MPP+, is a marker of catecholamine neurons in brain tissue, but not a fluorescent false neurotransmitter. ACS Chem. Neurosci. 4, 858–869 10.1021/cn400038u [DOI] [PMC free article] [PubMed] [Google Scholar]
- 43. Hong W. C., Yano H., Hiranita T., Chin F. T., McCurdy C. R., Su T.-P., Amara S. G., and Katz J. L. (2017) The σ-1 receptor modulates dopamine transporter conformation and cocaine binding and may thereby potentiate cocaine self-administration in rats. J. Biol. Chem. 292, 11250–11261 10.1074/jbc.M116.774075 [DOI] [PMC free article] [PubMed] [Google Scholar]
- 44. Cha J. H., Zou M.-F., Adkins E. M., Rasmussen S. G., Loland C. J., Schoenenberger B., Gether U., and Newman A. H. (2005) Rhodamine-labeled 2β-carbomethoxy-3β-(3,4-dichlorophenyl)tropane analogues as high-affinity fluorescent probes for the dopamine transporter. J. Med. Chem. 48, 7513–7516 10.1021/jm050431y [DOI] [PubMed] [Google Scholar]
- 45. Eriksen J., Rasmussen S. G. F., Rasmussen T. N., Vaegter C. B., Cha J. H., Zou M.-F., Newman A. H., and Gether U. (2009) Visualization of dopamine transporter trafficking in live neurons by use of fluorescent cocaine analogs. J. Neurosci. 29, 6794–6808 10.1523/JNEUROSCI.4177-08.2009 [DOI] [PMC free article] [PubMed] [Google Scholar]
- 46. Reith M. E., Berfield J. L., Wang L. C., Ferrer J. V., and Javitch J. A. (2001) The uptake inhibitors cocaine and benztropine differentially alter the conformation of the human dopamine transporter. J. Biol. Chem. 276, 29012–29018 10.1074/jbc.M011785200 [DOI] [PubMed] [Google Scholar]
- 47. Loland C. J., Norregaard L., Litman T., and Gether U. (2002) Generation of an activating Zn2+ switch in the dopamine transporter: mutation of an intracellular tyrosine constitutively alters the conformational equilibrium of the transport cycle. Proc. Natl. Acad. Sci. U.S.A. 99, 1683–1688 10.1073/pnas.032386299 [DOI] [PMC free article] [PubMed] [Google Scholar]
- 48. Rahbek-Clemmensen T., Lycas M. D., Erlendsson S., Eriksen J., Apuschkin M., Vilhardt F., Jørgensen T. N., Hansen F. H., and Gether U. (2017) Super-resolution microscopy reveals functional organization of dopamine transporters into cholesterol and neuronal activity-dependent nanodomains. Nat. Commun. 8, 740 10.1038/s41467-017-00790-3 [DOI] [PMC free article] [PubMed] [Google Scholar]
- 49. Buffington S. A., and Rasband M. N. (2011) The axon initial segment in nervous system disease and injury. Eur. J. Neurosci. 34, 1609–1619 10.1111/j.1460-9568.2011.07875.x [DOI] [PMC free article] [PubMed] [Google Scholar]
- 50. Sarmiere P. D., Weigle C. M., and Tamkun M. M. (2008) The Kv2.1 K+ channel targets to the axon initial segment of hippocampal and cortical neurons in culture and in situ. BMC Neurosci. 9, 112 10.1186/1471-2202-9-112 [DOI] [PMC free article] [PubMed] [Google Scholar]
- 51. Chao R.-Y., Cheng C.-H., Wu S.-N., and Chen P.-C. (2018) Defective trafficking of Kv2.1 channels in MPTP-induced nigrostriatal degeneration. J. Neurochem. 144, 483–497 10.1111/jnc.14282 [DOI] [PubMed] [Google Scholar]
- 52. Torres G. E., Yao W.-D., Mohn A. R., Quan H., Kim K.-M., Levey A. I., Staudinger J., and Caron M. G. (2001) Functional interaction between monoamine plasma membrane transporters and the synaptic PDZ domain–containing protein PICK1. Neuron 30, 121–134 10.1016/S0896-6273(01)00267-7 [DOI] [PubMed] [Google Scholar]
- 53. Goodwin J. S., Larson G. A., Swant J., Sen N., Javitch J. A., Zahniser N. R., De Felice L. J., and Khoshbouei H. (2009) Amphetamine and methamphetamine differentially affect dopamine transporters in vitro and in vivo. J. Biol. Chem. 284, 2978–2989 10.1074/jbc.M805298200 [DOI] [PMC free article] [PubMed] [Google Scholar]
- 54. Saha K., Sambo D., Richardson B. D., Lin L. M., Butler B., Villarroel L., and Khoshbouei H. (2014) Intracellular methamphetamine prevents the dopamine-induced enhancement of neuronal firing. J. Biol. Chem. 289, 22246–22257 10.1074/jbc.M114.563056 [DOI] [PMC free article] [PubMed] [Google Scholar]
- 55. Gabriel L. R., Wu S., Kearney P., Bellvé K. D., Standley C., Fogarty K. E., and Melikian H. E. (2013) Dopamine transporter endocytic trafficking in striatal dopaminergic neurons: differential dependence on dynamin and the actin cytoskeleton. J. Neurosci. 33, 17836–17846 10.1523/JNEUROSCI.3284-13.2013 [DOI] [PMC free article] [PubMed] [Google Scholar]
- 56. Rizzo M. A., Springer G., Segawa K., Zipfel W. R., and Piston D. W. (2006) Optimization of pairings and detection conditions for measurement of FRET between cyan and yellow fluorescent proteins. Microsc. Microanal. 12, 238–254 10.1017/S14319276 [DOI] [PubMed] [Google Scholar]
Associated Data
This section collects any data citations, data availability statements, or supplementary materials included in this article.


