Abstract
The mortality rate has risen due to the increase in number of cardiac patients in recent times due to the lack of unawareness of the symptoms. This work mainly aims to detect the anomalies of the rhythmic conditions of the pulse derived from the electrocardiogram (ECG) pattern based on correlation and the method of mapping. As this device is a programmable one and a real-time application wearable system on the wrist which is physically connected to the veins, it continuously monitors the photoplethysmography (PPG) pattern based on certain parameters and rhythmic conditions, it ensures whether the patient is under the safe condition or not. The salient features of PPG waveform are extracted with respect to various abnormal categories of ECG beats subdivided into various time durations of one, two and three. The PPG pattern using various feature extraction and the correlation transforms with the signal processing application. The extracted features help to find the skipped beat with irregularities of the rhythm will activate the emergency condition protocol in the device. The location of the patient with a critical condition is sent to the nearest health centre. This innovation is a portable one and a user-friendly application which can save many lives in the society.
Keywords: electrocardiography, medical signal detection, medical signal processing, photoplethysmography, feature extraction, diseases, patient diagnosis, health care
Keywords: pulse rhythmic rate, efficient diagnosing, heartbeat, mortality rate, cardiac patients, recent times, rhythmic conditions, electrocardiogram pattern, real-time application wearable system, photoplethysmography pattern, patient, safe condition, salient features, PPG waveform, time durations, PPG pattern, feature extraction, correlation transforms, emergency condition protocol, user-friendly application
1. Introduction
As deaths due to heart attacks are increasing drastically every year, we need to find a new way to detect the heart attack earlier to save more lives. This Letter is a new innovation which intimates the warning of an heart attack earlier to the user based on some parameters. This system consists of a wrist wearable device with a microcontroller which is connected through a Bluetooth. The microcontroller consists of a pulse sensor which continuously monitors the rhythm of the pulse rate. The microcontroller is programmed in such a way that it reads the rate of every user's pulse. This system also helps to convert the following pulse into waveforms by using signal processing algorithm. These waveforms are again processed using the methodology of the discrete signal processing, which converts the waveform into cross-correlated signals and divides them into phase and the magnitude plots individually to classify the rhythm [1]. These waveforms are plotted based on the international standard waveform based on the pattern of electrocardiogram (ECG) pulse. The pulse sensor takes only within the QRS complex plot. These plots are compared with arrhythmia of the pulse rate. Here the abnormal beats are again classified into nine different categories which are LBBB, RBBB, VPC, APC, NORMAL-RBBB, NORMAL-VPC, NORMAL-APC, LBBB-VPC and RBBB-APC. Here the beats are considered only within the QRS complex duration. Each abnormal beat has different waveforms. The microcontroller also checks for the continuous variation on the beats such us skipping of the beat and the irregularities. If the arrhythmia of the pulse is matched with the user's pulse rate, then the warning sign is indicated to the user and also to the nearest hospital [2]. The person's personal location is also transferred through the phone to the hospital for sending an ambulance for the rescue purpose. This Letter will be very useful to save many lives in this society. However, in this world, the death rate due to heart attack is dramatically increasing, this means the world is now experiencing a high rate of heart attack patients. A heart attack is the blockage of the flow of blood in the muscles of the heart. The heart attack takes place as the blood clot in the veins leads to blockage of the flow of blood in it. This Letter mainly aims to detect the heart attack earlier based on the symptoms of the heart before the attack using the pulse rate. Usually, more heart attacks take place during the age of 45+, [3] this due to their lifestyle they are living right now. According to the World Health Organisation, one-third of the death is caused due to heart diseases. According to the survey, the people in India are experiencing more related to the heart diseases. From the source of the Apollo hospital, heart attacks can be detected by symptoms such as discomfort in the arms and the neck, with vomiting and indigestion. According to our research, these symptoms are not common to everyone [4]. During or before a heart attack the blood flow will definitely change, due to this the heartbeat will also change to parallel lines. Hence to detect a heart attack there are two ways-one is by ECG and the other is based on the pulse (refer Fig. 1).
Fig. 1.

Based on the pulse rate (wearable device)
As shown in Figs. 1 and 2, the devices will show similar results for the movement in the heart, more details about the device are mentioned below. Here the ECG works based on the electrical signals in the heart activity. Fig. 3 shows the pulse rate device works on the principle of the photoplethysmography (PPG). Our main aim is to detect the heart attack based on the pulse rate because it can be used either as a portable device or an ECG [5]. In this, the device checks for the symptoms and compares the values with the normal set of values which are stored in it. The wearable device is directly connected to the mobile with the Bluetooth only for the alarm purpose. As deaths due to heart attacks is increasing, this device helps to detect the heart attack earlier. With the help of the abnormal beats, skipping beats and the irregular beats from this we can be able to decide the heart attack earlier. Here this device is a wrist wearable which is connected to the mobile consisting of Bluetooth and GPS module. It is been programmed in such a way to read the pulse beats of the user. These beats are converted into a graph and regulated in the phase and the magnitude plot [6]. If the heart attack is identified the device is able to transmit the data to the mobile phone, when the mobile phone receives the data, it gives the alarm signal to the user and sends the location of the patient to the nearest hospital and the nearest ambulance. This device will be very helpful to save many lives in this society. It will be very helpful for the people who are staying alone at home and the people who are travelling. This device helps to save their life earlier.
Fig. 2.
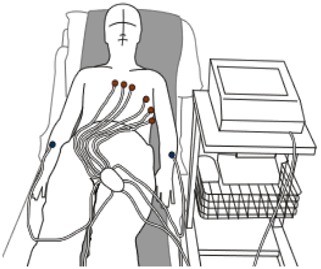
Based on the electrocardiogram (ECG)
Fig. 3.
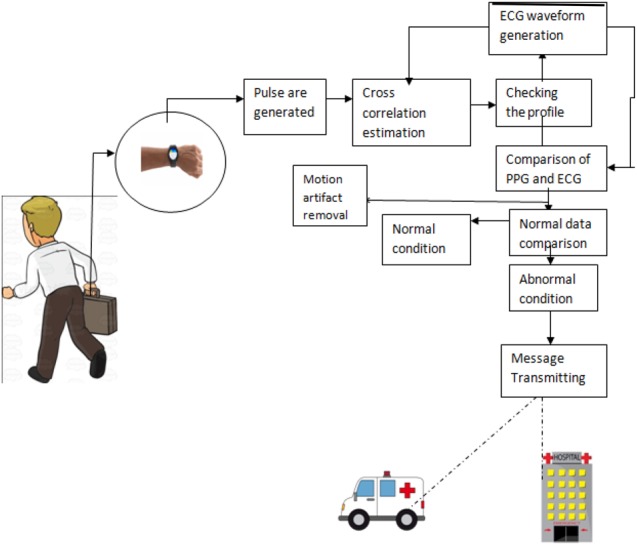
Proposed model
2. Architecture model
2.1. Generation and capture of the PPG
Pulses detected on the PPG use the change in the reflected light as this is due to the change in the flow of the blood in the heart. In PPG the timing is controlled based on the external oscillator crystal to get the data accurately. Here the resulted output is compared with the output of the ECG to obtain the major result. It also detects the electrical signals generated in the heart due to the activities of the rhythms but it is detected using the reflected light. PPG waveform is detected in two ways based on the alternating current and also the direct current. PPG waveform is calculated based on the change in the volume of the blood cells and also the tissues in it. The waveform of the PPG will much differ from the ECG waveform. PPG has very useful advantages in day-to-day life it can be used as a portable device and used for monitoring the cardiac cycles and also the respiratory moments.
This Letter mainly aims to detect heart attack based on the pulse, here pulse waveform obtained will be compared with the waveform of the ECG obtained parallelly, if the abnormal conditions are satisfied with respect to the normal data then the patient has a chance of heart attack.
The principle behind the generation of the pulse is based on the PPG. It is nothing but sending the infrared light radiation to the skin to see the changes of the tissues will reflect the light back to the photodetector. Based on the variation of the reflected light gives various information based on the cardiovascular activates in the heart. Variation of the reflected light with respect to the time gives rise to the PPG waveform. Whatever change in cardio activities will also reflect the pulse rate which can be found using PPG.
2.2. Feature extraction of the abnormal rhythm
From the normal beat derived from the PPG can be normal as well as the abnormal criteria too. To derive the abnormal criteria of the abnormal rhythm some parameters has to be considered based on the abnormal beats of the ECG. Beats are classified and are kept in the processing unit with are biological for the system to understand, but the compiler plays a major role on the various compilation techniques which are employed in the process. From the normal beats using the digital signal processing and each particular time interval of the beat will be extracted in various forms as per the abnormal criteria of the ECG wave pattern (Table 1).
Table 1.
Abnormal criteria of the ECG wave pattern
| Waveform segment | Very high | High | Low | Very low | Normal |
|---|---|---|---|---|---|
| PR, ms | >250 | >200 | <120 | <60 | 200–60 |
| QRS, ms | >350 | >300 | <200 | <120 | 350–120 |
| QT, ms | >450 | >310 | <250 | <100 | 310–60 |
| ST, s | >1.2 | >1 | <0.4 | <0.2 | l.2–0.6 |
| RR, ms | >550 | >200 | <120 | <60 | 200–60 |
For ECG abnormal beat extraction see Fig. 4.
Fig. 4.

ECG abnormal beat extraction
Using a similiar process as above, most of the abnormal waves of the ECG are classified based on the QRS wave pattern.
The data shown above are classified based on the ECG features. These are the different forms of the QRS complex neglecting the physical condition of the patients shown in Fig. 5. Waveforms in the brackets are the QRS complex waveform in the heart. These are the different types of the QRS complex which is generated using the electrical pulses in the ECG. In Fig. 6, the filter helps to separate the QRS complex parts separately for the extraction of the PPG data evenly and easily.
Fig. 5.
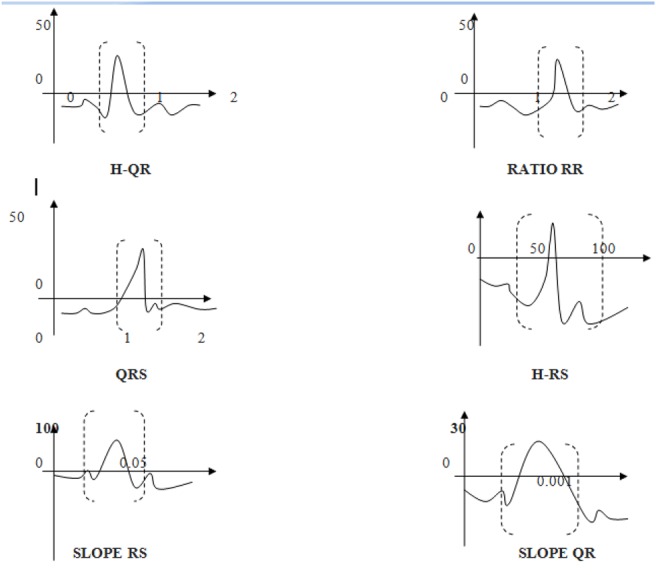
Classification of QRS curve
Fig. 6.
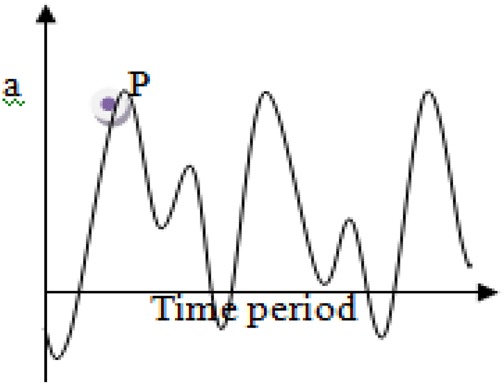
Generated PPG signal
2.3. Cross-correlation-based PPG and ECG data abstraction
Cross-correlation helps to differentiate the beats and give clear information about the activities in the heart and also the pulse rate. It helps to compare and find the similarities between the signals. Normal PPG rate and the normal ECG rate are taken as the reference for analysing the cross-correlation. The various processing units in each category has various levels of extraction to show the process of improvising the various units of r(m). As the filtration of the artefacts in the signal have to be cleared. Each signal generated will be cross-correlated with the reference signal with respect to the Fourier transform to produce the cross-spectral density, which gives further features for the extraction of the data. Extraction of data based on the cross-correlation is done by considering the generated data as a finite sequence [7]
Each data of the PPG is configured based on the above equation to extract various other activities of the heart. Each signal is the power spectral of the above data which is a reference to that of the normal pulse and ECG rate
Each signal is split based on their characteristics. Whatever signal is generated is differentiated on phase as well as the magnitude based on the power spectral value.
At point P let us consider the amplitude to be 2 and the time period to be 3 s, based on the equation stated above and the power spectral density finding for the all the remaining part of the signal we can generate a new characteristic power spectral extraction to get various function of the heart [7] (see Fig. 7).
Fig. 7.
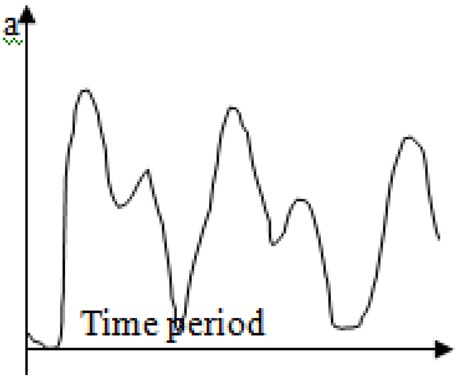
Power spectral of the signal
From the above data using the formula below, we can generate the phase and magnitude of the signal (Fig. 8).
Fig. 8.
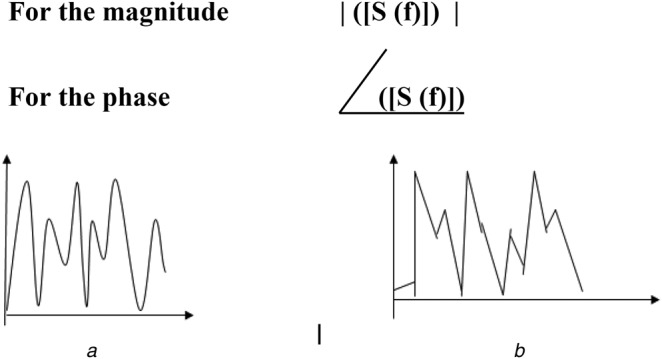
Various Norms of PPG Signal
a Magnitude of the signal
b Phase of the signal
As many papers were based on the abnormal conditions of the heart rate based on the ECG extracted readings. Our proposal is based on deriving the abnormal conditions of the PPG from the ECG data.
2.4. Abnormal PPG extraction
Based on the matching established mapping methodology and using the correlation factor, basic five anomalies of the PPG have been extracted from the ECG pattern; similarly, all the abnormal conditions can be derived using the same way. As from the basic abnormal criteria, all the beats can be easily extracted from the microcontroller based on the above innovation.
The sample ECG waveform. From the above graph, we have peak time and the peak interval as well as the pulse height and also the pulse interval, falling time and also the rising time gives the complete extraction of the PPG waveform data to the complete accuracy of the detection interval in the ECG. From the above data, the PPG waveform is derived based on the give features below. Here Vpo, Vpp, Vp1, are the assumed to be the amplitudes. Tp1, Tp2, Tpp, Ts1, Ts2 are the time periods and also the time interval of the waveform. From the given parameters and also using the sufficient identities, we can derive the abnormal conditions of the PPG curves. Tp1–Tp2 gives the pulse interval between the segments P. Tpp–(Tp1–Tp2) gives the whole peak interval of the R segment. Based on the comparison from both the waveform, the beat points is same, but have different amplitude with various abnormal sectors which can be succeeded for any other beat which varies same that of the normal reference data which is extracted as above [8]. From the PPG the selectivity and predictivity is based on the true positive (tp). Here the false positive and also the false negative will give the complete accuracy of the beat based on the classification of the methodology
2.5. Mapping methodology and artefacts
PPG and ECG have the same beat point, from the correlation coefficient the constant of the Fourier transform will not vary much as that of the PPG wave. To extract the data from the ECG to the PPG we get lots of distortion and noise kind of variation in it, which is actually called as the artefacts, when it is used as a kind of wearable's then the noise produced will be motion artefacts. Some filters can neglect the motion artefacts by sending the high-frequency wave and it is demodulated by neglecting the high frequency hence the motion artefacts will get neglected through the high-frequency wave. Artefacts re periodic in nature as the various roots of errors occur in the various degrading process in the recursion environment. In Fig. 9, the interval of the Tmax is the same as that of the two times of the Pmax, where the total time interval is the same as that in both ECG and PPG [9].
Fig. 9.
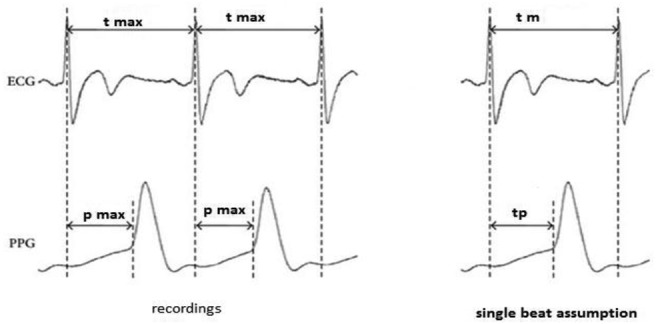
ECG and PPG relation
To extract the abnormal conditions of the PPG, we used the reference ECG and PPG waveform in Fig. 9. Here A, B, C, D, E, F, G, H, I, J, K, L, M, N and O are the split points in ECG which is assumed similarly a, b, c, d, e and f are the different points in the PPG waveform. On considering a point in A, and comparing Fig. 9, we can say that the point will definitely fall in the interval between ‘a’ and ‘b’ of the PPG. We can take the probability of each point in the interval between ‘a’ and ‘b’ by taking the sum of all the probability. From [2] the sum of all the probabilities is taken as 1 which is taken over the integral of the density in waveform (Fig. 10)
Fig. 10.
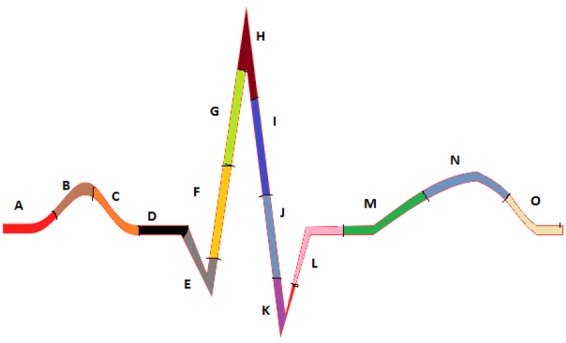
ECG split derivative
Fig. 11 shows the normal PPG where a, b, c, d, e, f and g are the peak intervals of the curve, the slope of the curve can also be found by the derivative of the following above ejected wave with respect to the PPG, where h, i, j, k and l are the reflected wave intervals here the main aim is to derive the PPG from the ECG wave where the ejected wave and also the reflected waves are much different to each other comparing Fig. 5 in the above based on the matching techniques [10] each point of the ECG can lie anywhere in the PPG based on the interval points of the curve. Extracting the minimum possibilities of the curve we can derive the PPG data from the curve using the ECG waveform interval
where h(x) is the ECG data with respect to that of they (x) which is the predictivity of the ECG signal which is accurate as that of the detection inaccuracy is accurate. Where some of the values can be wrongly detected which causes the outlier which can be so large and small based on the range which is extracted in the table (see, Fig. 12), here the standard deviation and mean can be linear which depends on the value of p. Here the np and nb are the total number of beats as well as the number of errors detected in the beat classification
Fig. 11.
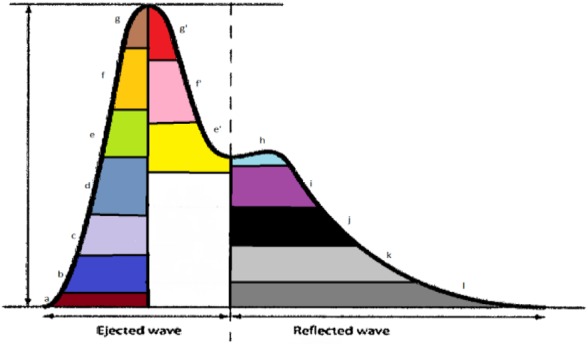
PPG differentiate
Fig. 12.
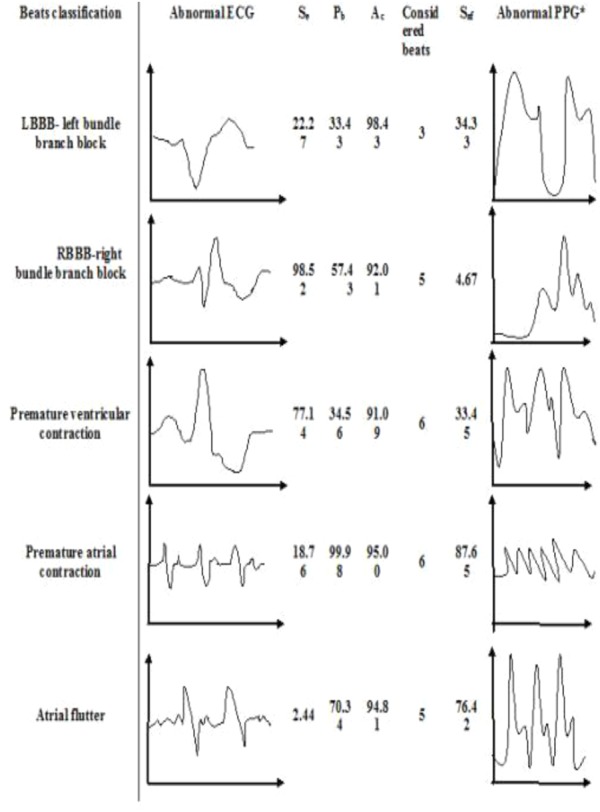
Extraction of PPG segment from the ECG recordings
2.6. Duration-based PPG extraction
The strength of the pulse is determined based on the weak and strong pulses and the rhythm of the pulse is determined based on the regular and irregular beats. For the abnormal conditions, it is classified based on the tachycardia and also the bradycardia [4].
To get more data from the above classification if very difficult, hence the detection of the heart attack from the above-mentioned classification is also impossible [11]. So to detect the heart attack and also to get more data based on the abnormal condition of the pulse we have to look into various different directions.
To detect the abnormal beats and the plot of the pulse each pulse has to be converted into ECG waveform based on the standard nomenclature. From the pulse rate waveform, the abnormal conditions can be derived from the heart waveform of the ECG. From the classification of the abnormal pulse, it is difficult to obtain much data hence from the waveform of the ECG it is very easy to obtain the various abnormal beats.
So to derive the abnormal conditions of a pulse rate, we have to look the ECG pattern. From [12] we can get to know about the abnormal heart rate based on the ECG pattern. Our proposed work requires the abnormal conditions of PPG. So in order to extract the abnormal conditions from Fig. 13 we can say any change in the heart also affects the PPG values due to the change in the blood flow in the radial nerve. Hence the abnormal conditions of the PPG can be derived from the ECG based on the mapping tracking methodology which is stated as below.
Fig. 13.
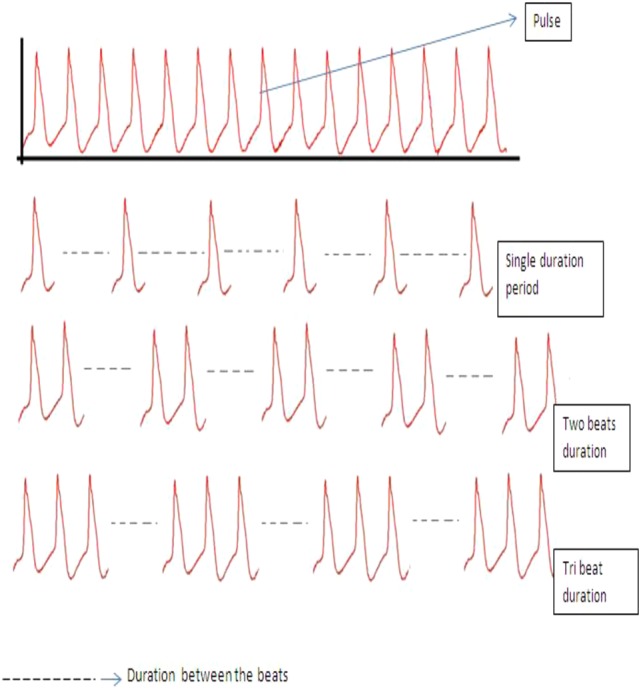
PPG derived from ECG based on map tracking
From the experimental form of PPG, the program is written based on the duration of the beats, which gives a complete idea of the factors of myocardial infarction, as the ventricular side of the heart produced electrical signals to form the ECG which in turn gives the apical blood flow in the veins [13]. The most threatening situation is the motion of the body in the various categories. The Internet of Things (IOT) has a huge play in this Letter which has not been considered. This Letter focuses on the feature-extracting model of this level. As this Letter gives the outcome of the pre-duration of the heart attack, it aims to find the exact duration of the heart attack based on the rhythmic conditions of the pulse over the conditions of the heart. Tri,2 single of the beats gives the complete idea of the duration of the strike occurs in the muscles. The above-shown diagram is programmed based on the mapping features of the beat and other motion artefacts.
2.7. Filtering-based artefact removal
Filtering can be done easily but the main aim of it that should not disturb the original signal, without disturbing the reference signal distortion and noise has to remove [9]. The final stage of this methodology is to filter the extracted PPG without disturbing the original signal. As the following work is implemented in the filtration process, it is much helpful for the classification of the PPG and ECG waves based on the abnormalities from the patients. When the above methodology is practically implemented there will be lots of noise with respect to the environment which make use of the adaptive filter to take away the higher order frequency with respect to the modulated signal [1], as the following signal is dependent upon the patients’ skin structure and temperature [14], without overlapping it is passed to the nth order of the Butterworth filter to remove the noise and distortion component, the nth order can be changed depending upon the correlation factor for the estimation of the PPG.
3. Conclusions
This system designed to diagnose the PPG result from the ECG-based pattern extraction. This Letter is based on the embedded programming and real-time monitoring of the signal and the feature extraction done immediately based on the delay specified. As the abnormal beats conditions satisfied in it, the emergency conditions will be activated. The modules send emergency alert service to the nearest hospital. Even the patient can wear a pacemaker to avoid the worst situation in it. As the experimental result produced shows extraction of the feature from the ECG to the PPG improves the entire system performance, as the beat accuracy is accurately obtained. By further adding the person's age, height, weight gives the system a more enhanced model and more diverse monitoring with a user-friendly application.
4. Funding and declaration of interests
Conflict of interest: none declared.
5 References
- 1.Banerjee R., Sinha A., Pal A., et al. : ‘Estimation of ECG parameters using photoplethysmography’. 13th IEEE International Conference on BioInformatics and BioEngineering, Chania, Greece, 2013 [Google Scholar]
- 2. https://en.wikipedia.org/wiki/Wave_function .
- 3. https://en.wikipedia.org/wiki/Heart .
- 4. https://en.wikipedia.org/wiki/Electrocardiography .
- 5.Kappirarukudil K.J., Ramesh M.: ‘Real-time monitoring and detection of ‘heart attack’ using wireless sensor networks’. Fourth Int. Conf. on Sensor Technologies and Applications, Venice, Italy, 2010 [Google Scholar]
- 6. https://en.wikipedia.org/wiki/Cardiac_arrhythmia .
- 7.Saibaldutta A., Munshi S.: ‘Correlation technique and least square support vector machine combine for the frequency domain based ECG beat classification’, Medical Eng. Phys., 2010, 32, pp. 1161–1169 (doi: 10.1016/j.medengphy.2010.08.007) [DOI] [PubMed] [Google Scholar]
- 8.Leijdekkers P., Gay V.: ‘A self- test to detect a heart attack using a mobile phone and wearable sensors’. IEEE Symp. on Computer-Based Medical Systems, Jyvaskyla, Finland, July 2008 [Google Scholar]
- 9.Lee H.-W., Lee J.-W., Jung W.-G., et al. : ‘The periodic moving average filter for removing motion artifacts from PPG signals’, Int. J. Control Autom. Syst., 2007, 5, (6), pp. 701–706 [Google Scholar]
- 10.Nitzan M., Babchenko A., Khanokh B., et al. : ‘The variability of the photoplethysmography signal – a potential method for the evaluation of the autonomic nervous system’, Physiol. Meas., 1998, 19, pp. 93–102 (doi: 10.1088/0967-3334/19/1/008) [DOI] [PubMed] [Google Scholar]
- 11.Cooley R.L., Montano N., Cogliati C., et al. : ‘Evidence for a central origin of the low frequency oscillation in R-R- interval variability’, Circulation, 1998, 98, pp. 556–561 (doi: 10.1161/01.CIR.98.6.556) [DOI] [PubMed] [Google Scholar]
- 12.Malliani A., Pagani M., Lombardi F., et al. : ‘Cardiovascular neural regulation explored in the frequency domain’, Circulation, 1991, 84, (2), pp. 482–491 (doi: 10.1161/01.CIR.84.2.482) [DOI] [PubMed] [Google Scholar]
- 13.MukundaRao M., Murthy V.S., Ramamoorthy S.: ‘Non invasive study of rhythms and arrhythmia using optical sensors and their biological implications’. Int. Conf. on Biomedical Engineering and Medical Physics, World Medical Congress, Chicago, USA, July 2000 [Google Scholar]
- 14.Palani S., Kalaiyarasi D.: ‘Principles of digital signal processing: for ECE’ (Ane Books Pvt. Ltd, India, 2016) [Google Scholar]


