

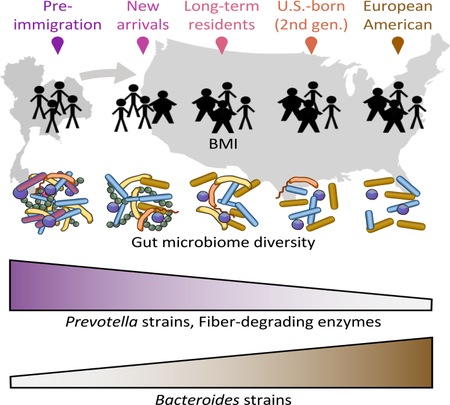
Summary
Many United States immigrant populations develop metabolic diseases post-immigration, but the causes are not well understood. Although the microbiome plays a role in metabolic disease, there have been no studies measuring the effects of U.S. immigration on the gut microbiome. We collected stool, dietary recalls, and anthropometrics from 514 Hmong and Karen individuals living in Thailand and the U.S., including first- and second-generation immigrants and 19 Karen individuals sampled before and after immigration, as well as from 36 U.S.-born European American individuals. Using 16S and deep shotgun metagenomic DNA sequencing, we found that migration from a non-Western country to the U.S. is associated with immediate loss of gut microbiome diversity and function, in which U.S.-associated strains and functions displace native strains and functions. These effects increase with duration of U.S. residence, and are compounded by obesity and across generations.
Graphical Abstract
Introduction
Previous work has established that diet and geographical environment are two principal determinants of microbiome structure and function (De Filippo et al., 2010; Febinia, 2017; Gomez et al., 2016; Kwok et al., 2014; Obregon-Tito et al., 2015; Rothschild et al., 2018; Schnorr et al., 2014; Yatsunenko et al., 2012). Rural indigenous populations have been found to harbor substantial biodiversity in their gut microbiomes, including novel microbial taxa not found in industrialized populations (Clemente et al., 2015; Gomez et al., 2016; Obregon-Tito et al., 2015; Schnorr et al., 2014; Smits et al., 2017; Yatsunenko et al., 2012). This loss of indigenous microbes or “disappearing microbiota” (Blaser and Falkow, 2009) may be critical in explaining the rise of chronic diseases in the modern world. Despite the frequent migration of people across national borders in an increasingly interconnected world, little is known about how human migration affects the human microbiome.
The United States (U.S.) hosts the largest number of immigrants in the world (49.8 million or 19% of the world’s total immigrants and approximately 21% of the U.S. population) (Department of Economic and Social Affairs, Population Division, 2017). Epidemiological evidence has shown that residency in the U.S. increases the risk of obesity and other chronic diseases among immigrants relative to individuals of the same ethnicity that continue to reside in their country of birth, with some groups experiencing up to a four-fold increase in obesity after 15 years (Goel et al., 2004; Lauderdale and Rathouz, 2000). Refugees, in particular, appear to be more vulnerable to rapid weight gain (Heney et al., 2014; Hervey et al., 2009), with Southeast Asian refugees exhibiting the highest average increases in body mass index (BMI) after relocation to the U.S. (Careyva et al., 2015). The Hmong, a minority ethnic group from China who also reside in Southeast Asia, make up the largest refugee group in Minnesota (22,033 total refugees as of 2014) (Minnesota Department of Health; Pfeifer and Thao, 2013). The Karen, an ethnic minority from Burma, have been arriving in large numbers in more recent years (Minnesota Department of Health). Overweight status and obesity rates are highest among Hmong and Karen compared to other Asian ethnic groups in Minnesota (Arcan et al., 2014; Franzen and Smith, 2009; Mulasi-Pokhriyal et al., 2012; Dawson-Hahn et al., 2016). Western diet acculturation, previous exposure to food insecurity, and physical inactivity have been identified as contributing factors (Franzen and Smith, 2009; Mulasi-Pokhriyal et al., 2012) although they do not fully explain risk of obesity.
The gut microbiome plays a critical role in host metabolism and is heavily influenced by an individual’s long-term diet (Hildebrandt et al., 2009; Wu et al., 2011), and can also respond quickly to dramatic dietary changes (David et al., 2014; Turnbaugh et al., 2009a). Hence, the gut microbiome offers an important window into the consequences of diet and lifestyle changes associated with human migration. To study the short- and long-term impact of migration on the microbiome, we measured gut microbiomes and dietary intake from Hmong and Karen immigrants and refugees (henceforth referred to as immigrants) in cross-sectional and longitudinal cohorts undergoing relocation to the U.S., stratified by BMI (high, ≥25 and low, <25). A first-generation immigrant group (foreign-born U.S. residents) included individuals with duration of U.S. residence ranging from a few days to more than 40 years., allowing us to test for changes in the gut microbiome associated with long-term U.S. residence. We included second-generation Hmong immigrants (born in the U.S. to first-generation immigrants) to determine whether the effects of U.S. immigration were compounded across generations by birth in the U.S. Finally, we followed a unique longitudinal cohort of 19 Karen refugees for up to 9 months beginning immediately before or after arrival in the U.S to measure the short-term effects of U.S. immigration.
Results
Assembly of a multi-generational Asian-American immigrant cohort
We recruited 514 healthy Hmong and Karen female individuals (aged 18–78, see Methods for full exclusion criteria) who either (1) were living in Thailand (HmongThai, KarenThai; n = 179), (2) were born in Southeast Asia and had moved to the U.S. (Hmong1st, Karen1st; n = 281), or (3) were born in the U.S. and whose parents were born in Southeast Asia (Hmong2nd; n = 54) (Figure 1A). We also recruited healthy European American female individuals to serve as U.S. controls (Controls; n = 36) (Figure 1A). We limited our study to women based on insight from our Hmong community advisory board that substantially more Hmong women than men were relocating to U.S. Participants in each sample group were recruited into lean or overweight/obese body mass index (BMI) class stratifications (BMI < 25 or BMI ≥ 25, respectively) (Table S1). We recruited eligible individuals throughout the Minneapolis-St. Paul metropolitan area in Minnesota, and at two locations in Thailand: a rural village in Chiang Mai province (Khun Chang Khian), and a refugee camp in Tak province (Mae La) (Figure S1A) in 2016 and 2017.
Figure 1. Assembly of a multi-generational Asian American cohort.

(1A) Experimental design for cross-sectional and longitudinal cohorts. See also Figure S1A.
(1B) Ratios of overweight-to-obese individuals across sample groups and over time in the U.S., separated by ethnicity due to differences in time in years.
(1C) Hmong in Thailand (n = 43) and second-generation Hmong (n = 41) (ages 20–40) diet diversity, displayed on a tree that groups related foods together. Bars denote unique foods, with darkness of the bar showing prevalence of foods reported averaged within HmongThai or Hmong2nd. Items highlighted in red denote the most prevalent vegetables, sweets and beverages, grains, and meats reported within sample groups. Full descriptions of foods highlighted in red: Coffee, brewed, regular; Carbonated citrus fruit drink; Chinese cabbage or Bok Choy family, raw; Rice, white, no salt or fat added; Pork chop, broiled, baked, or grilled, lean only eaten; Chicken breast, roasted, skin not eaten. See also Figure S1B.
Bilingual-bicultural research teams collected migration and medical histories (Table S2), anthropometrics (weight, height, waist circumference), 24-hour dietary recalls, and a single stool sample from all participants. Karen participants who were about to leave Thailand for the U.S. or who had arrived in the U.S. within 2 months were invited to participate in a longitudinal sub-study in which 24-hour dietary recalls and stool samples were collected monthly for 6 months (Figure 1A). We collected a total of 673 stool samples comprising 531 single- and 142 multiple-time-point collections. Consistent with the previously observed high rate of obesity in U.S. immigrants (see Introduction), obesity prevalence relative to overweight status in our cohort increased after a decade in the U.S. in the Hmong1st group (Chi-square test statistic = 5.23, P = 0.022) (Figure 1B). There was not a sufficient number of Karen subjects with long-term U.S. residence to test for changes in prevalence of obesity.
To be able to associate gut microbiome variation with dietary intake, we collected 24-hour dietary recalls from all participants and analyzed macronutrient content using the United States Department of Agriculture (USDA) SuperTracker food record system (Britten, 2013; United States Department of Agriculture Agricultural Research Service) and published literature. We utilized the hierarchical format of food codes derived from the USDA’s Food Nutrient and Database for Dietary Studies (FNDDS) to categorize foods into a tree structure where more closely related foods were grouped together (Figure 1C). These groupings allowed us to share statistical strength across closely related foods to complement dietary analysis of macronutrients, much in the way that phylogenetic beta-diversity analysis complements taxonomy-based profiles of microbiomes. Foods reported by participants that were not found in any USDA database (n = 72, Table S3) were manually inserted into the hierarchical food tree, allowing us to account for all foods reported by all participants. We confirmed our ability to discriminate between the Karen1st, Hmong1st, and Hmong2nd group diets using tree-based distances (Figure S1B), identifying a stark increase in the variety of foods eaten by second-generation Hmong relative to Hmong in Thailand (Figure 1C) (t-test of phylogenetic diversity P = 4.828e-10).
U.S. immigration is associated with loss of native gut microbiome species
We performed amplicon-based sequencing of the 16S rRNA gene V4 region on 550 stool samples (one sample per participant). Principal coordinates analysis (PCoA) of unweighted UniFrac distances (Lozupone et al., 2011) revealed that Hmong and Karen harbor distinct gut microbial compositions regardless of country of residence, yet their microbiomes converge toward European American microbiomes after relocating to the U.S. (ANOSIM R=0.25, P=0.001), with second-generation Hmong and European American microbiomes sharing nearly identical cluster centroids (Figure 2A). Interestingly, all U.S. immigrant groups had higher interindividual variation than their Thai counterparts (t-test Hmong1st vs. HmongThai P = 1.2e-12; Hmong1st vs. HmongThai P = 6.5e-4; Karen1st vs. KarenThai P = 4.9e-37). The first-generation immigrants with the most perturbed microbiomes (most distant tertile from Thai groups) had both higher age (t-test P = 0.0013) and longer time in the U.S. (t-test P = 0.00079) than those with the least perturbed microbiomes (least distant tertile from Thai groups).
Figure 2. Loss of diversity and native bacterial taxa with time spent in the U.S.

(2A) Principal coordinate analysis (PCoA) of unweighted UniFrac distances between bacterial communities of cross-sectional participants revealed that phylogenetic variation was differentiated by sample group (ANOSIM R=0.25, P=0.001). 95% standard error ellipses are shown around Hmong and Karen in Thailand, second-generation Hmong, and Controls.
(2B) Alpha diversity of obese and lean individuals across sample groups, in Shannon’s Diversity index and Faith’s Phylogenetic Distance (PD). P-values denote significantly different groups using pairwise tests of sample groups without stratification by BMI (Tukey’s HSD, p < 0.01). Microbiome diversity is significantly lower in obese individuals across all sample groups (unbalanced two-way ANOVA analysis with BMI class and sample group as covariates, P = 0.0044). See also Figure S2A.
(2C) Prevalence of operational taxonomic units (OTUs) in HmongThai and Hmong1st, with OTUs sorted by prevalence in HmongThai and samples sorted by richness within sample group. OTUs shown are found in at least 75% of HmongThai samples (See Table S4 for taxonomic assignments, mean group prevalence, and statistics).
(2D) Prevalence-abundance curves of all OTUs present in at least 75% of HmongThai samples, plotted separately for the Hmong1st and HmongThai sample groups. See also Figure S2B.
Microbial diversity and richness were highest in Thailand and decreased with each generation of residence in the U.S. (Tukey’s HSD, p < 0.01, Figure 2B). As in other studies (Sze and Schloss, 2016; Turnbaugh and Gordon, 2009), we found that lower phylogenetic diversity was associated with obesity across all major study groups (unbalanced two-way ANOVA, P = 0.0044, Figure 2B), even after stratification by ethnicity (Tukey’s HSD, p < 0.01, Figure S2A). Furthermore, we observed a consistent loss of certain native bacterial operational taxonomic units (OTUs) among first-generation Hmong (Figure 2C). Although 7 of the 10 most prevalent OTUs found in HmongThai were also found at similar levels in Hmong1st, others such as otu1812
(Faecalibacterium prausnitzii) incurred a 45% loss in prevalence (Fisher’s exact test, FDR-corrected q = 3.05E-14) (Table S4). Prevalence-abundance curve analysis showed that many OTUs that were highly prevalent (> 75% prevalence) in Thai-resident individuals had both decreased abundance and prevalence in 1st-generation U.S. residents (paired t-test, area under the prevalence-log-abundance curve, HmongThai vs. Hmong1st, P < 2.2×10⁻¹⁶) (Figure 2D). 28 OTUs incurred at least a 50% loss in prevalence among first-generation Hmong, with more than half of them belonging to the genus Prevotella (Table S4).
Bacteroides strains displace Prevotella strains across generations in the U.S.
The Western-associated genus Bacteroides increasingly displaced the non-Western-associated genus Prevotella across generations in the U.S. (Figure 3A). The ratio of Bacteroides to Prevotella was lowest in Thailand-resident individuals, highest in U.S.-born European Americans, and increased in a stepwise fashion from first-generation Karen, to first-generation Hmong, to second-generation Hmong (unbalanced two-way ANOVA, Resident Continent P=3.4e−13, Birth Continent P=0.00085, Ethnicity P=5.5e−12). This progression corresponded with the time that these groups had spent in the U.S.
Figure 3. Bacteroides and Prevotella strain diversity and abundances.

(3A) Log-transformed ratio of Bacteroides to Prevotella (B/P) relative abundances. U.S. residence, U.S. birth, and ethnicity were all significantly associated with B/P ratio (unbalanced two-way ANOVA P=3.4e−13, P=0.00085, P=5.5e−12, respectively). (KT=KarenThai; HT=HmongThai; K1=Karen1st; H1=Hmong1st; H2=Hmong2nd; C=Controls).
(3B) Coverage and relative abundance of Bacteroides and Prevotella strains in 44 samples across HmongThai, Hmong1st (who have lived in the U.S. for more than 30 years), and Controls. Strains with genomic coverage > 50% in at least one sample were included. Hierarchical clustering of strains and samples within group is based on relative abundances. Strains with genome coverage of < 1% within a person are considered not present (not plotted). See Table S5 for strain names.
(3C) CAZymes with significantly different relative abundances across HmongThai, Hmong1st (who have lived in the U.S. for more than 30 years), and Controls (Kruskal-Wallis test, FDR-corrected q < 0.05). See also Figure S3.
Using deep shotgun metagenomics on 55 samples (mean 22,406,875 reads/sample) from Hmong in Thailand, newly arrived Karen, long-term (> 30 years) U.S. resident Hmong, and Controls, we profiled strain-level variation within Bacteroides and Prevotella. We aligned shotgun metagenomic sequences against all 256 Bacteroides genomes and 153 Prevotella genomes in RefSeq version 87 (O’Leary et al., 2016), retaining any strains with at least 50% genome coverage in at least one sample. We found that U.S. Controls had varied Bacteroides strain profiles, while those with Prevotella had only a single strain of P. copri (Figure 3B). Conversely, Thailand-based individuals carried up to 4 strains of Prevotella, with low abundance and generally low genomic coverage of Bacteroides strains, possibly due to lack of related strains in the database. Long-term U.S.-resident Hmong displayed an intermediate profile, carrying a variety of Bacteroides strains and, in several individuals, multiple Prevotella strains. Prevalence-abundance curves for the Bacteroides and Prevotella strains with the largest change in overall prevalence between HmongThai and Hmong1st showed marked loss of Prevotella strains accompanied by an expansion of pre-existing low-abundance Bacteroides strains following U.S. immigration (Figure S2B).
U.S. immigrants lose enzymes associated with plant fiber degradation
We identified differences in functional pathways (Abubucker et al., 2012) between HmongThai and long-term U.S. resident Hmong1st (> 30 years residence) using shotgun metagenomics data (ANOVA, FDR-corrected q < 0.10, Figure S3A). First-generation Hmong harbored microbiomes with increased capacity for sucrose degradation, glycerol degradation, glucose/xylose degradation, and glucose fermentation to lactate, potentially related to increased consumption of more sugary foods, although most sucrose and glucose would not be expected to reach the lower GI tract (Dahlqvist and Thomson, 1963). In HmongThai, we found an enrichment of pathways relating to the degradation of complex carbohydrates, including β-(1,4)-mannan degradation and starch degradation (Flint et al., 2012). In order to better understand the substrates degraded by these pathways that either are lost or below the detection limit in U.S. immigrants, we assembled the shotgun data into scaffolds and annotated carbohydrate-degrading enzymes (CAZymes) (Lombard et al., 2014; Yin et al., 2012). We found significant shifts in abundance of 58 CAZymes across the HmongThai, Hmong1st, and Control groups (Kruskal-Wallis test, FDR-corrected q < 0.05, Figure 3C), including three beta-glucan-targeting glycoside hydrolases (GH17, GH64, GH87) that were highly abundant in the Thailand group but almost entirely unobserved in the U.S. groups. Loss of these glycoside hydrolases may be associated with loss of dietary fiber sources that promote persistence of the organisms that harbor these enzymes, reducing the ability of the microbiota to degrade these dietary fibers.
These 3 glycoside hydrolases predominantly originated from Prevotella copri (42 ± 11.1%, Figure S3B), supporting the hypothesis that loss of Prevotella strains following U.S. immigration drove loss of plant fiber degradation capability. We also observed a loss of GH5 and GH26 glycoside hydrolases from HmongThai to Hmong1st and U.S. controls, which indicates a loss of cellulose, beta-mannan and possible xyloglucan degradative potential. Beta-mannans are present in seeds, kernels, and corms, such as palm (Subrahmanyan et al., 1956), coconut (Kooiman, 1971), and konjac (Pangsri et al., 2015), and xyloglucan is found most abundantly in tamarind (Mishra and Malhotra, 2009), which, interestingly, are food ingredients prevalent in Southeast Asia. The loss of glycoside hydrolases for degrading cellulose, a plant cell-wall component, ws another indication that the microbiota of post-immigration individuals had lost some of their ability to degrade plant-derived fibers (El Kaoutari et al., 2013). These findings parallel previous findings in a mouse model demonstrating that the microbiomes of mice deprived of dietary fiber lost the capability to produce certain glycoside hydrolases (Sonnenburg et al., 2016).
Dietary acculturation partly explains microbiome acculturation
We observed significant differences across study groups in the consumption of macronutrients commonly associated with a Western diet: sugars, fats, and protein (unbalanced two-way ANOVA, p < 0.01, Figure 4A, Figure S4). There were no significant associations between fiber content and the microbiome, possibly due to the many uncharacterized polysaccharides present in different foods. PCoA of diet-based unweighted UniFrac (Lozupone et al., 2011) revealed distinct separation by sample group (ANOSIM R=0.29, P=0.001, Figure 4B) and a gradient of dietary acculturation along PC1 (Table S6). First- and second-generation Hmong had similar food choice profiles (Figure 4B), while U.S. controls shared few foods with other groups and consumed almost tenfold less white rice than other groups (Figure S5). Although the microbiomes of U.S. control and second-generation Hmong clustered together (Figure 2A), their diets did not (Figure 4B).
Figure 4. Dietary acculturation partially explains microbiome variation.

(4A) Comparison of macronutrient consumption across sample groups. Ethnicity is significantly associated with calories (P=3.4e−05), sugars (P=0.00023), fat (P=1.3e−07), protein (P=3.2e−07), whereas U.S. residency is associated with sugar (P=1.3e−16), fat (P=7.1e−24), and protein consumption (P=5.7e−05), and birth continent is only associated with Fat consumption (P=0.0081) (unbalanced two-way ANOVA) (HT=HmongThai; KT=KarenThai; H1=Hmong1st; K1=Karen1st; H2=Hmong2nd; C=Controls). See also Figure S4.
(4B) PCoA of unweighted UniFrac diet-based distances reveals significant clustering by sample group (ANOSIM R=0.29, P=0.001). Dietary acculturation can be seen along PC1 with Thai-resident groups on the left and European Controls on the right.
(4C) Redundancy analysis (RDA) of the unweighted UniFrac microbiome-distances constrained by the first 5 principal coordinates of the PCoA of unweighted UniFrac food-distances. The resulting RDA explains 16.8% of the total variation explained by PC1 and PC2 of the microbiome PCoA (Figure 2A). See also Figure S5.
Overall dietary profile was significantly associated with overall microbiome profile across individuals (Procrustes test P=0.001, n=999 permutations) (Figure S5C), but constrained ordination of the microbiome by the first 5 principal coordinates of diet variation revealed that diet explained a relatively small fraction (16.8%) of the total variation explained in the microbiome PCoA (Figure 4C). Thus, we found that diet was likely not the sole contributor to the observed gut microbiome changes in our cohort, although it is possible that dietary variation explains substantially more microbiome variation in this cohort than we are able to determine due to our limited knowledge of precise polysaccharide and other nutrient content of the foods, and due to complex individualized diet-microbiome interactions.
Gut biodiversity decreases according to duration of residence in the U.S.
After finding that U.S. residence was associated with a major shift in dominant taxa in the microbiome (Figure 3A), we decided to test whether U.S. residents experienced more profound changes in microbiome composition the longer they lived in the U.S. In a PCoA of unweighted UniFrac microbiome-based distances, we found that time spent in the U.S. was strongly correlated with the first principal coordinate axis (⍴ = 0.62, p < 2.2e-16, Figure 5A). Conversely, gut biodiversity, as measured by Faith’s phylogenetic diversity, was negatively correlated with PC1 (⍴ = −0.34, p < 3.19e-09, Figure 5B), even while controlling for BMI in the Hmong (multiple linear regression, Years in US β = −0.18, P = 0.0275, Figure 5C). We note that age was highly correlated with years in the U.S. in the Hmong1st group (Pearson correlation ρ = .444, P = 4.5e−9), and therefore age is also strongly correlated with loss of diversity (multiple linear regression, Age β = −.38, P = 2.2e−6). Age was not significantly correlated with diversity in any of the other groups (Pearson correlation HmongThai P = .065, Hmong2nd P = .79, Control P = .37). Thus, we found evidence that increased duration of U.S. residence is associated with decreased microbiome diversity, but that further study is needed to separate the effects of age and duration of U.S. residence.
Figure 5. Gut biodiversity decreases with time spent in the U.S.

(5A) Unweighted UniFrac PCoA of gut microbiomes of first-generation Hmong and Karen participants (N = 281), colored by years spent in the U.S. which ranges from 1 day to 40.6 years. PC1 is strongly correlated with the amount of time spent in the U.S. (⍴ = 0.62, p < 2.2e16).
(5B) Unweighted UniFrac PCoA of gut microbiomes of cross-sectional participants (N=550), colored by Faith’s Phylogenetic Diversity. PC1 is negatively correlated with phylogenetic richness (⍴ = −0.34, p < 3.19e-09).
(5C) In first-generation Hmong, diversity significantly decreases over time in the U.S. (multiple regression: Years in US β = −0.18, P = 0.0275; BMI β = −0.05, P = 0.81), but a significant association was not observed in first-generation Karen (Years in US β = −0.17, P = 0.71; BMI β = −0.27, P = 0.28).
Prevotella displacement continues for more than one decade
The longer immigrants spend living in the U.S., the more their microbiomes compositions diverge from their Thai counterparts and converge toward European Americans (Spearman correlation, ρ = −0.41, P = 1.3e−12 and ρ = 0.35, P = 1.2e−09, respectively) (Figure 6A), with continued displacement of Prevotella with Bacteroides (Spearman’s correlation, ρ = 0.44, P = 8.76e-15, Figure 6B) over time. We confirmed that this significant association persisted after stratifying the first-generation immigrants by ethnicity, despite the shorter time frame of U.S. residence in first-generation Karen (Spearman’s correlation, Hmong ρ = 0.47, P = 8.16e-19; Karen ρ = 0.19, P = 0.023, Figure 6B inset). As in the case of diversity above, we note that age is highly correlated with years in the U.S.. However, we used the European American group as a control group to test for association of age with similarity to the HmongThai reference group and found no association (P = 0.57) (Figure S6A), and the B:P ratio in first-generation immigrants was significantly associated with years in the U.S. regardless of age (multiple linear regression, Years in US β = 0.096, P = 0.0094; Age β = 0.039, P = 0.0065) (Figure S6B). These findings show that changes to the dominant members of the gut microbiome begin during the first decade of U.S. residence, and continue for multiple decades.
Figure 6. Prevotella displacement continues over decades of U.S. residence.

(6A) Similarity (1 / Aitchison’s distance) of microbiomes relative to Thai-based groups (Spearman’s correlation, ρ = −0.41, P = 1.3e−12) and to Controls (Spearman’s correlation, ρ = 0.35, P = 1.2e−09). See also Figure S6A.
(6B) Log ratio of Bacteroides to Prevotella of first-generation groups are significantly correlated to years spent in the U.S. (Spearman’s correlation, ρ = 0.44, P = 8.76e-15). Significantly correlated trends persist after stratification by ethnicity (Spearman’s correlation, Hmong ρ = 0.47, P = 8.16e-19; Karen ρ = 0.19, P = 0.023). (HT=HmongThai; KT=KarenThai; H2=Hmong2nd; C=Controls; 0–40=Years spent in the U.S. by Hmong1st and Karen1st). See also Figure S6B.
Microbiome Westernization begins within 9 months after immigration
To understand whether changes in the gut microbiome can be detected immediately after relocation to the U.S., we examined the gut microbiomes of 19 newly arrived Karen over their first 6–9 months of U.S. residence. Within this short time frame all but one participant gained weight (paired t-test, P=8.3e-05, Figure 7A), and protein consumption increased (paired t-test, FDR-adjusted q=0.048, Figure 7B), while the total variety of foods consumed decreased (paired t-test, P=0.017, Figure 7C), suggesting a period of acclimation to newly available foods. This is in contrast to the Hmong1st group whose diet diversity tended to increase following U.S. immigration (Figure S7B). Hmong participants’ diets may be more acculturated due to the longer duration of residence of the Hmong community (mean time U.S. residence 20.2 years among study participants) when compared to the Karen community (mean time U.S. residence 1.9 years among study participants). Hmong1st diets tend to be more similar on average than the Karen1st diets to the European American diets (t-test of mean tree-based diet distance to European American group P = 0.028). We again observed the displacement of Prevotella by Bacteroides (paired t-test, P=0.0013, Figure 7D) within this longitudinal cohort, in many cases involving a ten-fold increase in the Bacteroides-Prevotella ratio, indicating that microbiome westernization begins immediately after arrival to the U.S.
Figure 7. Longitudinal microbiome variation during relocation to the U.S.

(7A) Comparison of per-participant changes between first and last months of the study in BMI (paired t-test, P=8.3e-05),
(7B) protein consumption (paired t-test, macronutrients adjusted for multiple comparisons using false discovery rate < 0.05, P=0.048),
(7C) dietary diversity (Faith’s PD) (paired t-test, macronutrients adjusted for multiple comparisons using false discovery rate < 0.05, P=0.017), and
(7D) Bacteroides to Prevotella ratios (paired t-test, macronutrients adjusted for multiple comparisons using false discovery rate < 0.05, P=0.0013).
(7E) Bacteroides and Prevotella strain profiles are mostly stable after 6 months. Samples (columns) from the same participant are denoted by color, and M1 and M6 correspond to Month 1 Sample and Month 6 Sample, respectively. Selected strains are identical to Figure 3B (at least 50% coverage per sample across N=55 samples, see Table S5).
(7F) Taxonomic area charts of relative abundances of dominant genera (other taxa not shown) in 6 individuals who began the longitudinal study while in a refugee camp in Thailand and then continued after relocation to the U.S. First available samples were collected 6 to 34 days before departure, and second samples were collected 1 to 6 days after arrival to the U.S. See also Figure S7.
This longitudinal cohort also included six Karen participants from whom we collected samples in Thailand, prior to their relocation to the U.S. Using deep shotgun metagenomics sequencing on 13 samples from these 6 participants, we found that Prevotella and Bacteroides strain profiles remained largely stable over 6 months but sometimes underwent substantial changes (subject highlighted in blue, Figure 7E). We observed in general that relocating to the U.S. induced a variety of short-term gut microbiome responses including disruption to the gut microbiome immediately after arrival in two subjects (ID.273 and ID.304), expansion of opportunistic pathogens (ID.305), gut disruption several months after arrival (ID.275), and stability (ID.274, ID.308) (Figure 7F). Thus, we found that short-term responses to immigration of overall microbiome composition were variable across individuals, but the displacement of dominant native taxa with dominant U.S. taxa begins within 6 to 9 months of U.S. residence.
Discussion
This study represents the first large cohort study of the effects of migration from a non-Western country to a Western country on the human gut microbiome. In multi-ethnic, multi-generational cohorts of immigrants and refugees, we observed that gut microbiome diversity, function, and strain composition are strongly impacted by U.S. immigration and that both short-term and long-term U.S. residence as well as being born in the U.S. shift an individual’s microbiome along an axis toward a more Westernized state. Even a short period of residence in the U.S. was sufficient to induce pronounced increases, in some cases over ten-fold, in the ratio of Bacteroides to Prevotella. Metagenome assembly showed that the observed loss of Prevotella strains was associated with loss of carbohydrate-active enzymes dominant in the gut microbiota, including a near-complete loss of certain beta-glucanases and other glycoside hydrolases that break down specific dietary fibers. Previous studies have demonstrated intergenerational effects of microbiome perturbations in animal models. These include loss of microbiota carbohydrate degradation function following removal of dietary fiber (Sonnenburg et al., 2016) and intergenerational loss of diversity following antibiotic perturbation (Schulfer et al., 2018). The data presented here extend these findings to humans by providing evidence that compounded intergenerational loss of taxonomic and functional diversity is occurring in U.S. immigrant populations, supporting the model of disappearing human microbiota proposed by Blaser and Falkow (Blaser and Falkow, 2009).
We also performed extensive analysis and modeling of differences in dietary intake, as diet is known to be a strong driver of microbiome variation (Bokulich et al., 2016; David et al., 2014; Muegge et al., 2011). Although we observed clear patterns of dietary acculturation associated with U.S. residence, dietary variation only partly explained microbiome variation across individuals. Interestingly, the diets of second-generation immigrants remained quite distinct from the Controls, while their microbiomes do not. It is possible that different diets are driving the microbiome toward a similar state; an alternative explanation is that a limited set of metabolic capabilities in the microbiome are transmitted from one generation to the next, resulting in decreased overall functionality with each successive generation, consistent with the “disappearing microbiota” model.
This study has several limitations. Immigration-related microbiome changes are likely driven by a combination of diet and other factors associated with adjustment to life in the U.S, and most of these factors were not examined in the context of this study. These include changes in exposure to stress, exercise, municipal drinking water, antibiotics, and treatment with antiparasitics. In addition, our study design did not allow us to test directly whether immigration causes the observed changes in the microbiome, nor whether changes in microbiome are directly contributing to the high incidence of obesity in U.S. immigrants.
Our findings demonstrate that U.S. immigration is associated with profound perturbations to the gut microbiome, including loss of diversity, loss of native strains, loss of fiber degradation capability, and shifts from Prevotella dominance to Bacteroides dominance. These changes begin immediately upon arrival, continue over decades of U.S. residence, and are compounded in obese individuals and in second-generation immigrants born in the U.S. These results improve our fundamental understanding of how human migration affects the microbiome and underscore the importance of considering the impact of the gut microbiome in future research into immigrant and refugee health.
STAR Methods
CONTACT FOR REAGENT AND RESOURCE SHARING
Further information and requests for resources and reagents should be directed to and will be fulfilled by the Lead Contact, Dan Knights (dknights@umn.edu).
EXPERIMENTAL MODEL AND SUBJECT DETAILS
Study setting, population, and recruitment
Our inclusion criteria included individuals who were Hmong or Karen, female, at least 18 years old, and either were born and are currently living in Thailand, were born in Southeast Asia and moved to the U.S., or were born in the U.S. but whose parents were born in Southeast Asia. Our inclusion criteria for controls included European American females at least 18 years of age who were born in the U.S. and whose parents and grandparents were also born in the U.S. Our exclusion criteria consisted of use of any antibiotics in the previous 6 months, current use of probiotic supplements, known presence of gastrointestinal, cancer, immunodeficiency or autoimmune disorders, adults lacking capacity to consent, or pregnancy. Additionally, control subjects could not have traveled outside of the U.S. within the last 12 months. We recruited using multiple methods which included flyers, emails, social media, oral presentations, tabling, letters followed by phone calls to West Side Community Health Services (West Side) patients who met criteria, and by word of mouth. We recruited throughout the Minneapolis-St. Paul metro area at local community centers, faith-based organizations, adult education centers, health care centers, and health fairs. We recruited in Thailand at Khun Chang Khian (KCK), a rural Hmong village located one hour from Chiang Mai city, as well as from Mae La (ML) Camp, a Burmese refugee camp in Tak province located on the Myanmar-Thailand border (Figure S1). Interested subjects were then screened and interviewed privately or as a group, as preferred by the participants. Interviews and body measurements were conducted by trained Hmong and Karen community researchers and a graduate student researcher. This study was approved for human subject research by the University of Minnesota Institutional Review Board (1510S79446), and the Thailand-based portion of the study was additionally approved for human subject research by the Chiang Mai University Institutional Review Board (475/2015) and the Chiang Mai Public Health Office (0032.002/9930). Informed consent was obtained from all subjects.
Community-based Research methods
This project used a community-based participatory action research (CBPAR) approach, with a multidisciplinary team composed of academic researchers, Hmong and Karen community researchers, and staff from the Somali, Latino and Hmong Partnership for Health and Wellness (SoLaHmo). SoLaHmo is a multi-ethnic, community-driven CBPAR program of West Side Community Health Services, Inc., whose mission is to build upon the unique cultural strengths of ethnic communities to promote health and wellness through research, education and policy. All SoLaHmo members are trained in qualitative research processes using a previously developed training curriculum (Allen et al., 2011). In addition, all phases of our project were further guided by community advisory boards (CABs) composed of Hmong and Karen health professionals and community experts. The study design, recruitment methods and strategies, and dissemination of results were developed in partnership with both academic and community researchers, and through multiple discussions with the CABs. As noted in Results, we learned from the Hmong CAB and research team members that substantially more Hmong women than men were relocating to U.S. in recent years. Thus, to ensure feasibility of recruitment for this study we limited our population to women. In Thailand, we used a modified CPBAR approach in that Thai community researchers were members of the communities that we worked with, and were trained with qualitative research methods, recruitment, and sample and data collection, but were not directly involved with study design. We note that Hmong refugee camps have long been closed (Bureau of Population, Refugees and Migration, 2004), hence Hmong in Khun Chang Khian are not refugees but serve as acceptable pre-immigration representatives available for US-based Hmong.
Cross-sectional specimen and data collection
For U.S. sample collection, research team members obtained informed consent and conducted interviews in the participants’ preferred languages (English, Hmong, or Karen), and recorded participants’ responses onto an English paper survey. Weights were measured using standard electronic scales, heights were measured against a wall using a pre-positioned measuring tape, and waist circumferences were measured with a tape measure at the uppermost lateral border of the iliac crest (Center For Disease Control, 2014). 24-hour dietary recalls were conducted using a multiple pass system (Tippett et al., 1999) with food models and measuring cups and spoons for portion size estimations. Participants were provided with a stool collection kit and instructions describing how to collect a stool sample. Stool samples were collected into preservative (see below) and were either returned to the research staff by mail or were stored at room temperature for up to 5 days before they were collected by the research team.
Procedures for consent, interviews, anthropometrics, and stool sampling in Thailand were as described above for the cross-sectional specimen and data collection. 24-hour dietary recalls and sample collections were conducted as described previously. Stool samples from KCK were transported on dry ice then placed in a −20C freezer for 2 days then transferred to a −80C freezer. Stool samples from ML were placed in a −20C freezer for up to 8 hours then transferred to a −80C freezer. All samples collected in Thailand were shipped overnight on dry ice from Thailand to the U.S., and stored in a −80C freezer in the U.S.
Research team members instructed participants in stool collection, using an instructional video, written visual instructions, and verbal reinforcement. Participants placed their stool sample onto a FecesCatcher (Tag Hemi VOF) and 1 gram was collected using a sterile swab into a 1.5 ml cryogenic tube pre-filled with 900 ul of RNALater™ and mixed thoroughly. Larger samples (longitudinal first and last month samples) were collected using a Sarstedt Inc. 80.9924.014/CS500 tube and scoop without mixing or RNALater. Large samples collected in the U.S. were aliquoted into 1.5 ml tubes with and without 50% glycerol upon arrival and stored at - 80C. Large samples collected in Thailand were stored at −80C until arrival to the U.S., at which point they were thawed over ice, aliquoted, and stored in the same manner.
Longitudinal specimen and data collection
Procedures for consent, interviews, anthropometrics, and stool sampling were as described above for the cross-sectional specimen and data collection. Once per month over six months, 24-hour dietary recalls were conducted as described previously. Month 1 and 6 samples were stored in a home freezer and picked up within 24 hours of stool collection. These samples were transported with an ice pack and immediately placed in a −80C freezer. Month 2–5 samples were stored in preservative (see below), mailed to the research team in prepaid mailers at room temperature, and placed in a −80C freezer upon receipt.
METHOD DETAILS
Dietary data processing
De-identified survey data was entered into an electronic spreadsheet. Foods and portions from 24-hour dietary recalls were entered into the USDA SuperTracker system (Britten, 2013). Foods that were not found in the USDA database were studied individually (Speek et al., 1991) for macronutrient content and entered in as custom foods. SuperTracker macronutrient and food grouping summaries, as well as foods and their respective portions were downloaded directly from the SuperTracker website or using custom Python (van Rossum and Drake, 2011) scripts. Foods and portions were mapped to the SuperTracker and USDA databases to obtain respective food and portion identification numbers; food and portion identification numbers were used in tree-based food analysis. Custom foods not in the USDA database were manually assigned appropriate existing or new food identification numbers by group consensus. Micronutrients were excluded from dietary analyses due to the high number of custom foods with limited information on micronutrients.
16S ribosomal RNA gene DNA sequencing
All fecal samples were submitted to the University of Minnesota Genomics Center (UMGC) for DNA extraction, amplification, and sequencing. 16S ribosomal rRNA gene sequences were extracted and amplified following the UMGC-developed protocol(Gohl et al., 2016).
Shotgun metagenomics DNA sequencing
Shotgun DNA sequencing was performed on the Illumina HiSeq platform. All fecal samples were submitted to the UMN Genomics Center for DNA extraction, amplification, and sequencing. Amplification, quantification, and normalization of extracted DNA was performed using the Illumina NeoPrep Library System. A HiSeq 2×125 cycle v4 kit was used to sequence samples.
QUANTIFICATION AND STATISTICAL ANALYSIS
16S sequencing analysis
We trimmed and processed all 16S marker-gene sequencing data for quality using SHI7 (Al-Ghalith et al., 2018) and picked de novo operational-taxonomic units (OTUs) as follows. We first filtered for reads with at least 100 exact duplicates as representative sequences, and assigned taxonomy by alignment at 0% to the NCBI RefSeq 16s reference database (O’Leary et al., 2016) using the BURST (Al-Ghalith and Knights, 2017) OTU-picking algorithm in CAPITALIST mode, which ensures optimal alignment of sequences and minimizes the set of aligned reference genomes. All original sequences were then re-aligned with BURST (Al-Ghalith and Knights, 2017) in CAPITALIST mode at 98% identity against this representative set, resulting in 93.54% of all available sequences aligned. Singleton OTUs and samples with depth less than 2,143 were removed using the Quantitative Insights Into Microbial Ecology (QIIME) software package (Caporaso et al., 2010). Using QIIME, we measured within-sample biodiversity (alpha diversity) with rarefied OTU tables (at 2,143 sequences/sample) using whole-tree phylogenetic diversity (Faith, 1992) and a custom generated phylogeny constructed with the representative sequences using aKronyMer (Al-Ghalith and Knights, 2018). To quantify differences in composition between subjects, we calculated the phylogeny-based UniFrac distance (Lozupone et al., 2011) between all pairs of samples. To visualize between-subject differences (beta diversity) and to obtain principal components for subsequent statistical testing, we performed dimensionality reduction using principal coordinates analysis (Caporaso et al., 2010). Aitchison’s distances were calculated by first imputing zeros from an abundance OTU table, then applying a centered log ratio transform using the robCompositions R package (Pawlowsky-Glahn and Buccianti, 2011). To enable tests for shifts in the relative abundances of Bacteroides and Prevotella, we collapsed the reference-based OTUs according to taxonomy at the genus level. P-values, sample numbers, and names of statistical tests are provided in the main text and figure legends for Figures 2A, 2B, 3A, 3C, 4A, 4B, 5A-C, 6A-C, 7A-D.
Shotgun metagenomics analysis
Shotgun metagenomics sequences were identified at the species level via genomic alignment against a custom database created from aligning human samples from various public datasets against the comprehensive NCBI RefSeq database (Tatusova et al., 2013) release 87, and all matched bacterial species, as well as all species in matched representative genera, were included from NCBI RefSeq database (Tatusova et al., 2013) release 87. Genome coverage estimates were calculated using the bcov utility from BURST (Al-Ghalith and Knights, 2017). Functional annotations were obtained using the HUMAnN2 (Abubucker et al., 2012) pipeline with UniRef50 (Suzek et al., 2015). Resulting functional pathways were mapped to and colored by the top-level categories of the MetaCyc (Caspi et al., 2008) ontology. CAZyme annotations were obtained using metaSPAdes (Nurk et al., 2017), filtered for scaffolds with minimum 1000 bp, then further processed with Prokka (Seemann, 2014), dbCAN (Yin et al., 2012) with E-value < 1e−5, and the CAZy database (Lombard et al., 2014). Taxonomic contributions of differentiated glycoside hydrolases were identified as follows: (1) scaffolds that contributed to GH17, GH64, GH87 were identified and respective DNA sequences were obtained and used as a reference database, (2) shotgun metagenomic reads were quality filtered as described previously, (3) quality reads were aligned against the scaffold reference database using BURST (Al-Ghalith and Knights, 2017) at 95% identity, (4) quality filtered reads from step 2 were aligned with BURST at 98% identity against the previously described custom database with taxonomy assigned from the NCBI database, (5) sequences that hit both the scaffolds reference and the custom NCBI-based reference were used to construct an OTU table.
Dietary data analysis
Food tree visualizations were generated with GraPhlAn (Asnicar et al., 2015). Dietary record and food item associations were generated using custom scripts, then visualized in Cytoscape (Shannon et al., 2003). Food-Microbiome Procrustes distance association P-values are from the `vegan` implementation in function `protest ()` with 999 permutations (performed for each of the permuted data structures).
Supplementary Material
Highlights.
U.S. immigration is associated with loss of gut microbiome diversity
U.S. immigrants lose bacterial enzymes associated with plant fiber degradation
Bacteroides strains displace Prevotella strains according to time spent in the U.S.
Loss of diversity increases with obesity and is compounded across generations
Acknowledgements
We thank all of the participants of this study. We also thank the members of our community advisory boards, who provided critical feedback throughout the study: Bu Bu, Jamiey Cha, Yoha Christiansen, Pa Chua Vang, Duachi Her, Ku Ku Paw Lynn, Mayly Lochungvu, Mudah Takoni, Aye Mi San, Yeng Moua, Ko Nay Oo, Donna Vue Lee, Houa Vue-Her, Pakou Xiong, and Shoua Yang. Our work in Thailand would not have been possible without Ntxawm Lis, Yi Lis, Blooming Zion, Htoo Lay Paw, Moo Kho Paw, See Thoj, and Wirachon Yangyuenkun. We also thank Nurul Quratulaini Abd Salim Nast, Dominique Sabas, and Max Abramson for their assistance in the lab. We thank Ryan Hunter for his advice and assistance with planning. This work was supported by the Clinical and Translational Science Institute, the Healthy Foods, Healthy Lives Institute, the Office of Diversity, and the Graduate School at the University of Minnesota.
Footnotes
Declaration of Interests
D.K. serves as CEO and holds equity in CoreBiome, a company involved in the commercialization of microbiome analysis. The University of Minnesota also has financial interests in CoreBiome under the terms of a license agreement with CoreBiome. These interests have been reviewed and managed by the University of Minnesota in accordance with its Conflict-of-Interest policies.
DATA AND SOFTWARE AVAILABILITY
Software
Software used to perform statistical testing and generate figures for this manuscript are available here: https://github.com/knights-lab/IMP_analyses.
Data Resources
The 16S rRNA gene and shotgun metagenomic sequencing data have been deposited in the European Nucleotide Archive under accession number PRJEB28687.
References
- Abubucker S, Segata N, Goll J, Schubert AM, Izard J, Cantarel BL, Rodriguez-Mueller B, Zucker J, Thiagarajan M, Henrissat B, et al. (2012). Metabolic reconstruction for metagenomic data and its application to the human microbiome. PLoS Comput. Biol 8, e1002358. [DOI] [PMC free article] [PubMed] [Google Scholar]
- Al-Ghalith G, and Knights D (2017). BURST enables optimal exhaustive DNA alignment for big data (Zenodo). [Google Scholar]
- Al-Ghalith G, and Knights D (2018). aKronyMer enables database-free metagenome comparison (Zenodo). [Google Scholar]
- Al-Ghalith GA, Vangay P, and Knights D (2015). The guts of obesity: progress and challenges in linking gut microbes to obesity. Discov. Med 19, 81–88. [PubMed] [Google Scholar]
- Al-Ghalith GA, Hillmann B, Ang K, Shields-Cutler R, and Knights D (2018). SHI7 Is a Self-Learning Pipeline for Multipurpose Short-Read DNA Quality Control. mSystems 3. [DOI] [PMC free article] [PubMed] [Google Scholar]
- Allen ML, Culhane-Pera KA, Call KT, and Pergament SL (2011). Partners in research: curricula to prepare community and faculty for CBPR partnerships. CES4Health. Info [Google Scholar]
- Arcan C, Larson N, Bauer K, Berge J, Story M, and Neumark-Sztainer D (2014). Dietary and weight-related behaviors and body mass index among Hispanic, Hmong, Somali, and white adolescents. J. Acad. Nutr. Diet 114, 375–383. [DOI] [PMC free article] [PubMed] [Google Scholar]
- Asnicar F, Weingart G, Tickle TL, Huttenhower C, and Segata N (2015). Compact graphical representation of phylogenetic data and metadata with GraPhlAn. PeerJ 3, e1029. [DOI] [PMC free article] [PubMed] [Google Scholar]
- Blaser MJ, and Falkow S (2009). What are the consequences of the disappearing human microbiota? Nat. Rev. Microbiol 7, 887–894. [DOI] [PMC free article] [PubMed] [Google Scholar]
- Blin K, Wolf T, Chevrette MG, Lu X, Schwalen CJ, Kautsar SA, Suarez Duran HG, de los Santos ELC, Kim HU, Nave M, et al. (2017). antiSMASH 4.0—improvements in chemistry prediction and gene cluster boundary identification. Nucleic Acids Res. 45, W36–W41. [DOI] [PMC free article] [PubMed] [Google Scholar]
- Bokulich NA, Chung J, Battaglia T, Henderson N, Jay M, Li H, D Lieber A, Wu F, Perez-Perez GI, Chen Y, et al. (2016). Antibiotics, birth mode, and diet shape microbiome maturation during early life. Sci. Transl. Med 8, 343ra82. [DOI] [PMC free article] [PubMed] [Google Scholar]
- Britten P (2013). SuperTracker Incorporates Food Composition Data into Innovative Online Consumer Tool. Procedia Food Science 2, 172–179. [Google Scholar]
- Bureau of Population, Refugees and Migration (2004). Long Wait is Over: Hmong from Wat Tham Krabok Begin Arriving in U.S. U.S. Refugee Admissions Program News 2. [Google Scholar]
- Caporaso JG, Kuczynski J, Stombaugh J, Bittinger K, Bushman FD, Costello EK, Fierer N, Peña AG, Goodrich JK, Gordon JI, et al. (2010). QIIME allows analysis of high-throughput community sequencing data. Nat. Methods 7, 335–336. [DOI] [PMC free article] [PubMed] [Google Scholar]
- Careyva B, LaNoue M, Bangura M, de la Paz A, Gee A, Patel N, and Mills G (2015). The effect of living in the United States on body mass index in refugee patients. J. Health Care Poor Underserved 26, 421–430. [DOI] [PubMed] [Google Scholar]
- Caspi R, Foerster H, Fulcher CA, Kaipa P, Krummenacker M, Latendresse M, Paley S, Rhee SY, Shearer AG, Tissier C, et al. (2008). The MetaCyc Database of metabolic pathways and enzymes and the BioCyc collection of Pathway/Genome Databases. Nucleic Acids Res. 36, D623–D631. [DOI] [PMC free article] [PubMed] [Google Scholar]
- Center For Disease Control (2014). National Health and Nutrition Examination Survey (NHANES) anthropometry procedures manual; 2009.
- Chang JY, Antonopoulos DA, Kalra A, Tonelli A, Khalife WT, Schmidt TM, and Young VB (2008). Decreased Diversity of the Fecal Microbiome in Recurrent Clostridium difficile— Associated Diarrhea. J. Infect. Dis 197, 435–438. [DOI] [PubMed] [Google Scholar]
- Clemente JC, Pehrsson EC, Blaser MJ, Sandhu K, Gao Z, Wang B, Magris M, Hidalgo G, Contreras M, Noya-Alarcón Ó, et al. (2015). The microbiome of uncontacted Amerindians. Sci Adv 1. [DOI] [PMC free article] [PubMed] [Google Scholar]
- Dahlqvist A, and Thomson DL (1963). The digestion and absorption of sucrose by the intact rat. J. Physiol 167, 193–209. [DOI] [PMC free article] [PubMed] [Google Scholar]
- David LA, Maurice CF, Carmody RN, Gootenberg DB, Button JE, Wolfe BE, Ling AV, Devlin AS, Varma Y, Fischbach MA, et al. (2014). Diet rapidly and reproducibly alters the human gut microbiome. Nature 505, 559–563. [DOI] [PMC free article] [PubMed] [Google Scholar]
- Dawson-Hahn E, Pak-Gorstein S, Matheson J, Zhou C, Yun K, Scott K, Payton C, Stein E, Holland A, Grow HM, et al. (2016). Growth Trajectories of Refugee and Nonrefugee Children in the United States. Pediatrics 138. [DOI] [PMC free article] [PubMed] [Google Scholar]
- De Filippo C, Cavalieri D, Di Paola M, Ramazzotti M, Poullet JB, Massart S, Collini S, Pieraccini G, and Lionetti P (2010). Impact of diet in shaping gut microbiota revealed by a comparative study in children from Europe and rural Africa. Proc. Natl. Acad. Sci. U. S. A 107, 14691–14696. [DOI] [PMC free article] [PubMed] [Google Scholar]
- Department of Economic and Social Affairs, Population Division (2017). International Migration Report 2017 (United Nations).
- El Kaoutari A, Armougom F, Gordon JI, Raoult D, and Henrissat B (2013). The abundance and variety of carbohydrate-active enzymes in the human gut microbiota. Nat. Rev. Microbiol 11, 497–504. [DOI] [PubMed] [Google Scholar]
- Faith DP (1992). Conservation evaluation and phylogenetic diversity. Biol. Conserv 61, 1–10. [Google Scholar]
- Febinia CA (2017). The Gut Microbiota of Bali among the World Populations: Connecting Diet, Urbanisation, and Obesity. University of Sydney. [Google Scholar]
- Flint HJ, Scott KP, Duncan SH, Louis P, and Forano E (2012). Microbial degradation of complex carbohydrates in the gut. Gut Microbes 3, 289–306. [DOI] [PMC free article] [PubMed] [Google Scholar]
- Franzen L, and Smith C (2009). Acculturation and environmental change impacts dietary habits among adult Hmong. Appetite 52, 173–183. [DOI] [PubMed] [Google Scholar]
- Fu BC, Randolph TW, Lim U, Monroe KR, Cheng I, Wilkens LR, Le Marchand L, Hullar MAJ, and Lampe JW (2016). Characterization of the gut microbiome in epidemiologic studies: the multiethnic cohort experience. Ann. Epidemiol 26, 373–379. [DOI] [PMC free article] [PubMed] [Google Scholar]
- Gevers D, Kugathasan S, Denson LA, Vázquez-Baeza Y, Van Treuren W, Ren B, Schwager E, Knights D, Song SJ, Yassour M, et al. (2014). The treatment-naive microbiome in new-onset Crohn’s disease. Cell Host Microbe 15, 382–392. [DOI] [PMC free article] [PubMed] [Google Scholar]
- Goel MS, McCarthy EP, Phillips RS, and Wee CC (2004). Obesity among US immigrant subgroups by duration of residence. JAMA 292, 2860–2867. [DOI] [PubMed] [Google Scholar]
- Gohl DM, Vangay P, Garbe J, MacLean A, Hauge A, Becker A, Gould TJ, Clayton JB, Johnson TJ, Hunter R, et al. (2016). Systematic improvement of amplicon marker gene methods for increased accuracy in microbiome studies. Nat. Biotechnol 34, 942–949. [DOI] [PubMed] [Google Scholar]
- Gomez A, Petrzelkova KJ, Burns MB, Yeoman CJ, Amato KR, Vlckova K, Modry D, Todd A, Jost Robinson CA, Remis MJ, et al. (2016). Gut Microbiome of Coexisting BaAka Pygmies and Bantu Reflects Gradients of Traditional Subsistence Patterns. Cell Rep. 14, 2142–2153. [DOI] [PubMed] [Google Scholar]
- Heney JH, Dimock CC, Friedman JF, and Lewis C (2014). Pediatric refugees in Rhode Island: increases in BMI percentile, overweight, and obesity following resettlement. R. I. Med. J 98, 43–47. [PubMed] [Google Scholar]
- Hervey K, Vargas D, Klesges L, Fischer PR, Trippel S, and Juhn YJ (2009). Overweight among refugee children after arrival in the United States. J. Health Care Poor Underserved 20, 246–256. [DOI] [PubMed] [Google Scholar]
- Hildebrandt MA, Hoffmann C, Sherrill-Mix SA, Keilbaugh SA, Hamady M, Chen Y-Y, Knight R, Ahima RS, Bushman F, and Wu GD (2009). High-fat diet determines the composition of the murine gut microbiome independently of obesity. Gastroenterology 137, 1716–1724.e1–e2. [DOI] [PMC free article] [PubMed] [Google Scholar]
- Karlsson FH, Tremaroli V, Nookaew I, Bergström G, Behre CJ, Fagerberg B, Nielsen J, and Bäckhed F (2013). Gut metagenome in European women with normal, impaired and diabetic glucose control. Nature 498, 99–103. [DOI] [PubMed] [Google Scholar]
- Kooiman P (1971). Structures of the galactomannans from seeds of Annona muricata, Arenga saccharifera, Cocos nucifera, Convolvulus tricolor, and Sophora japonica. Carbohydr. Res 20, 329–337. [DOI] [PubMed] [Google Scholar]
- Kwok L-Y, Zhang J, Guo Z, Gesudu Q, Zheng Y, Qiao J, Huo D, and Zhang H (2014). Characterization of fecal microbiota across seven Chinese ethnic groups by quantitative polymerase chain reaction. PLoS One 9, e93631. [DOI] [PMC free article] [PubMed] [Google Scholar]
- Lauderdale DS, and Rathouz PJ (2000). Body mass index in a US national sample of Asian Americans: effects of nativity, years since immigration and socioeconomic status. Int. J. Obes. Relat. Metab. Disord 24, 1188–1194. [DOI] [PubMed] [Google Scholar]
- Le Chatelier E, Nielsen T, Qin J, Prifti E, Hildebrand F, Falony G, Almeida M, Arumugam M, Batto J-M, Kennedy S, et al. (2013). Richness of human gut microbiome correlates with metabolic markers. Nature 500, 541–546. [DOI] [PubMed] [Google Scholar]
- Lombard V, Golaconda Ramulu H, Drula E, Coutinho PM, and Henrissat B (2014). The carbohydrate-active enzymes database (CAZy) in 2013. Nucleic Acids Res. 42, D490–D495. [DOI] [PMC free article] [PubMed] [Google Scholar]
- Lozupone C, Lladser ME, Knights D, Stombaugh J, and Knight R (2011). UniFrac: an effective distance metric for microbial community comparison. ISME J. 5, 169–172. [DOI] [PMC free article] [PubMed] [Google Scholar]
- Minnesota Department of Health MDH Primary Refugee Arrival Data.
- Mishra A, and Malhotra AV (2009). Tamarind xyloglucan : a polysaccharide with versatile application potential. J. Mater. Chem 19, 8528–8536. [Google Scholar]
- Montassier E, Al-Ghalith GA, Ward T, Corvec S, Gastinne T, Potel G, Moreau P, de la Cochetiere MF, Batard E, and Knights D (2016). Pretreatment gut microbiome predicts chemotherapy-related bloodstream infection. Genome Med. 8, 49. [DOI] [PMC free article] [PubMed] [Google Scholar]
- Muegge BD, Kuczynski J, Knights D, Clemente JC, González A, Fontana L, Henrissat B, Knight R, and Gordon JI (2011). Diet drives convergence in gut microbiome functions across mammalian phylogeny and within humans. Science 332, 970–974. [DOI] [PMC free article] [PubMed] [Google Scholar]
- Mulasi-Pokhriyal U, Smith C, and Franzen-Castle L (2012). Investigating dietary acculturation and intake among US-born and Thailand/Laos-born Hmong-American children aged 9–18 years. Public Health Nutr. 15, 176–185. [DOI] [PubMed] [Google Scholar]
- Nurk S, Meleshko D, Korobeynikov A, and Pevzner PA (2017). metaSPAdes: a new versatile metagenomic assembler. Genome Res. 27, 824–834. [DOI] [PMC free article] [PubMed] [Google Scholar]
- Obregon-Tito AJ, Tito RY, Metcalf J, Sankaranarayanan K, Clemente JC, Ursell LK, Zech Xu Z, Van Treuren W, Knight R, Gaffney PM, et al. (2015). Subsistence strategies in traditional societies distinguish gut microbiomes. Nat. Commun 6, 6505. [DOI] [PMC free article] [PubMed] [Google Scholar]
- O’Leary NA, Wright MW, Brister JR, Ciufo S, Haddad D, McVeigh R, Rajput B, Robbertse B, Smith-White B, Ako-Adjei D, et al. (2016). Reference sequence (RefSeq) database at NCBI: current status, taxonomic expansion, and functional annotation. Nucleic Acids Res. 44, D733–D745. [DOI] [PMC free article] [PubMed] [Google Scholar]
- Pangsri P, Piwpankaew Y, Ingkakul A, Nitisinprasert S, and Keawsompong S (2015). Characterization of mannanase from Bacillus circulans NT 6.7 and its application in mannooligosaccharides preparation as prebiotic. Springerplus 4, 771. [DOI] [PMC free article] [PubMed] [Google Scholar]
- Pawlowsky-Glahn V, and Buccianti A (2011). Compositional Data Analysis: Theory and Applications (John Wiley & Sons; ). [Google Scholar]
- Pfeifer ME, and Thao BK (2013). State of the Hmong American Community (Hmong National Development; ). [Google Scholar]
- Rashidi A, Ebadi M, Shields-Cutler RR, DeFor TE, Al-Ghalith GA, Ferrieri P, Young J-AH, Dunny GM, Knights D, and Weisdorf DJ (2018). Pretransplant Gut Colonization with Intrinsically Vancomycin-Resistant Enterococci (E. gallinarum and E. casseliflavus) and Outcomes of Allogeneic Hematopoietic Cell Transplantation. Biol. Blood Marrow Transplant 24, 1260–1263. [DOI] [PMC free article] [PubMed] [Google Scholar]
- van Rossum G, and Drake FL (2011). The Python Language Reference Manual (Network Theory Ltd.). [Google Scholar]
- Rothschild D, Weissbrod O, Barkan E, Kurilshikov A, Korem T, Zeevi D, Costea PI, Godneva A, Kalka IN, Bar N, et al. (2018). Environment dominates over host genetics in shaping human gut microbiota. Nature 555, 210–215. [DOI] [PubMed] [Google Scholar]
- Schnorr SL, Candela M, Rampelli S, Centanni M, Consolandi C, Basaglia G, Turroni S, Biagi E, Peano C, Severgnini M, et al. (2014). Gut microbiome of the Hadza huntergatherers. Nat. Commun 5, 3654. [DOI] [PMC free article] [PubMed] [Google Scholar]
- Schulfer AF, Battaglia T, Alvarez Y, Bijnens L, Ruiz VE, Ho M, Robinson S, Ward T, Cox LM, Rogers AB, et al. (2018). Intergenerational transfer of antibiotic-perturbed microbiota enhances colitis in susceptible mice. Nat Microbiol 3, 234–242. [DOI] [PMC free article] [PubMed] [Google Scholar]
- Seemann T (2014). Prokka: rapid prokaryotic genome annotation. Bioinformatics 30, 2068–2069.24642063 [Google Scholar]
- Shannon P, Markiel A, Ozier O, Baliga NS, Wang JT, Ramage D, Amin N, Schwikowski B, and Ideker T (2003). Cytoscape: a software environment for integrated models of biomolecular interaction networks. Genome Res. 13, 2498–2504. [DOI] [PMC free article] [PubMed] [Google Scholar]
- Shields-Cutler RR, Hillmann B, Al-Ghalith G, and Knights D (2018). Predicted secondary metabolite profiles for microbiome datasets. [Google Scholar]
- Smits SA, Leach J, Sonnenburg ED, Gonzalez CG, Lichtman JS, Reid G, Knight R, Manjurano A, Changalucha J, Elias JE, et al. (2017). Seasonal cycling in the gut microbiome of the Hadza hunter-gatherers of Tanzania. Science 357, 802–806. [DOI] [PMC free article] [PubMed] [Google Scholar]
- Sonnenburg ED, Smits SA, Tikhonov M, Higginbottom SK, Wingreen NS, and Sonnenburg JL (2016). Diet-induced extinctions in the gut microbiota compound over generations. Nature 529, 212–215. [DOI] [PMC free article] [PubMed] [Google Scholar]
- Snijder MB, Galenkamp H, Prins M, Derks EM, Peters RJG, Zwinderman AH, and Stronks K (2017). Cohort profile: the Healthy Life in an Urban Setting (HELIUS) study in Amsterdam, The Netherlands. BMJ Open 7, e017873. [DOI] [PMC free article] [PubMed] [Google Scholar]
- Speek AJ, Speek-Saichua S, and Schreurs WHP (1991). Determination of macronutrient and micronutrient levels in thai foods: An evaluation of the Thai Food Composition Table. Food Chem. 40, 251–262. [Google Scholar]
- Subrahmanyan V, Bains GS, Natarajan CP, and Bhatia DS (1956). The carbohydrates of tender kernel of palmyra palm (Borassus flabellifer, L.). Arch. Biochem. Biophys 60, 27–34. [DOI] [PubMed] [Google Scholar]
- Suzek BE, Wang Y, Huang H, McGarvey PB, Wu CH, and UniProt Consortium (2015). UniRef clusters: a comprehensive and scalable alternative for improving sequence similarity searches. Bioinformatics 31, 926–932. [DOI] [PMC free article] [PubMed] [Google Scholar]
- Sze MA, and Schloss PD (2016). Looking for a Signal in the Noise: Revisiting Obesity and the Microbiome. MBio 7. [DOI] [PMC free article] [PubMed] [Google Scholar]
- Tatusova T, DiCuccio M, Badretdin A, Chetvernin V, Ciufo S, and Li W (2013). The NCBI handbook. National Center for Biotechnology Information. [Google Scholar]
- Tippett KS, Enns CW, and Moshfegh AJ (1999). Food consumption surveys in the US Department of Agriculture. Nutr. Today 34, 33–46. [Google Scholar]
- Turnbaugh PJ, and Gordon JI (2009). The core gut microbiome, energy balance and obesity. J. Physiol 587, 4153–4158. [DOI] [PMC free article] [PubMed] [Google Scholar]
- Turnbaugh PJ, Ridaura VK, Faith JJ, Rey FE, Knight R, and Gordon JI (2009a). The effect of diet on the human gut microbiome: a metagenomic analysis in humanized gnotobiotic mice. Sci. Transl. Med 1, 6ra14. [DOI] [PMC free article] [PubMed] [Google Scholar]
- Turnbaugh PJ, Hamady M, Yatsunenko T, Cantarel BL, Duncan A, Ley RE, Sogin ML, Jones WJ, Roe BA, Affourtit JP, et al. (2009b). A core gut microbiome in obese and lean twins. Nature 457, 480–484. [DOI] [PMC free article] [PubMed] [Google Scholar]
- United States Department of Agriculture Agricultural Research Service USDA Food Composition Databases.
- Weber T, Blin K, Duddela S, Krug D, Kim HU, Bruccoleri R, Lee SY, Fischbach MA, Müller R, Wohlleben W, et al. (2015). antiSMASH 3.0—a comprehensive resource for the genome mining of biosynthetic gene clusters. Nucleic Acids Res. 43, W237–W243. [DOI] [PMC free article] [PubMed] [Google Scholar]
- Wu GD, Chen J, Hoffmann C, Bittinger K, Chen Y-Y, Keilbaugh SA, Bewtra M, Knights D, Walters WA, Knight R, et al. (2011). Linking long-term dietary patterns with gut microbial enterotypes. Science 334, 105–108. [DOI] [PMC free article] [PubMed] [Google Scholar]
- Yatsunenko T, Rey FE, Manary MJ, Trehan I, Dominguez-Bello MG, Contreras M, Magris M, Hidalgo G, Baldassano RN, Anokhin AP, et al. (2012). Human gut microbiome viewed across age and geography. Nature 486, 222–227. [DOI] [PMC free article] [PubMed] [Google Scholar]
- Yin Y, Mao X, Yang J, Chen X, Mao F, and Xu Y (2012). dbCAN: a web resource for automated carbohydrate-active enzyme annotation. Nucleic Acids Res. 40, W445–W451. [DOI] [PMC free article] [PubMed] [Google Scholar]
- Zhang X-S, Li J, Krautkramer K, Badri M, Battaglia T, Ng S, Sibley RA, Koh H, Li Y, Borbet TC, et al. (2018). Antibiotic-induced acceleration of Type 1 diabetes alters intestinal innate pathway maturation. Elife. [DOI] [PMC free article] [PubMed] [Google Scholar]
Associated Data
This section collects any data citations, data availability statements, or supplementary materials included in this article.