

Abstract
Human hepatocellular carcinoma (HCC) is one of the most common cancers worldwide. In this work, we report on a comprehensive characterization of gene expression profiles of hepatitis B virus-positive HCC through the generation of a large set of 5′-read expressed sequence tag (EST) clusters (11,065 in total) from HCC and noncancerous liver samples, which then were applied to a cDNA microarray system containing 12,393 genes/ESTs and to comparison with a public database. The commercial cDNA microarray, which contains 1,176 known genes related to oncogenesis, was used also for profiling gene expression. Integrated data from the above approaches identified 2,253 genes/ESTs as candidates with differential expression. A number of genes related to oncogenesis and hepatic function/differentiation were selected for further semiquantitative reverse transcriptase–PCR analysis in 29 paired HCC/noncancerous liver samples. Many genes involved in cell cycle regulation such as cyclins, cyclin-dependent kinases, and cell cycle negative regulators were deregulated in most patients with HCC. Aberrant expression of the Wnt-β-catenin pathway and enzymes for DNA replication also could contribute to the pathogenesis of HCC. The alteration of transcription levels was noted in a large number of genes implicated in metabolism, whereas a profile change of others might represent a status of dedifferentiation of the malignant hepatocytes, both considered as potential markers of diagnostic value. Notably, the altered transcriptome profiles in HCC could be correlated to a number of chromosome regions with amplification or loss of heterozygosity, providing one of the underlying causes of the transcription anomaly of HCC.
Hepatocellular carcinoma (HCC) ranks the eighth in frequency among human cancers worldwide, mainly in Asia, Africa, and southern Europe. HCC usually develops on a background of chronic inflammatory liver disease caused by viral infection that induces cirrhosis and exposure to chemical carcinogens (1). At the molecular level, structural alterations of oncogenes/tumor suppressor genes as a result of hepatitis B virus (HBV) insertion were reported in isolated cases, whereas the mutation of codon 249 of the p53 gene was suggested to be induced by aflatoxin B1 (AFB1) with an Arg-to-Ser substitution and abnormality of the folding of the DNA-binding domain (2). However, the frequency of p53 mutations is only 10–20%. Recently somatic mutations of the β-catenin gene and AXIN1 gene were found among less than 30% patients with HCC (3, 4). Somatic mutations of other known tumor suppressor genes and functional alteration of oncogenes in primary HCC were reported rarely as primary events. Therefore, the molecular mechanisms underlying HCC in most patients remain unclear.
Over the past few years, systematic efforts have been made to approach the genetic abnormalities of human cancers mainly in two ways: screening for chromosomal regions with frequent allelic imbalance using microsatellite analysis (MSA) genotyping and comparative genomic hybridization (CGH), suggestive of tumor suppressor genes or oncogenes, respectively (5, 6), and analysis of gene expression profiles (7). Previously, aberrant trans-activation properties of the HBV-X gene products were postulated to play a role in the transformation in HCC. Nevertheless, only very recently systematic survey of the overall gene transcripts expressed in a given cell/tissue type, or transcriptome, became feasible because of the Human Genome Project. In the present work, a large amount of expressed sequence tags (ESTs) from HCC and corresponding noncancerous liver with HBV infection (hereafter termed paired HCC/liver) samples was generated and compared. The gene expression profiles also were analyzed with cDNA arrays both homemade and commercially available.
Materials and Methods
Patients and Tissue Specimens.
The paired HCC/liver specimens for cDNA library construction, EST sequencing, cDNA microarray analysis, MSA, and CGH were obtained from four patients with HBV-positive and α-fetal protein-expressing primary HCC during surgery. Particular attention was paid to obtain the “core” part of the tumor to avoid the adjacent noncancerous tissue, as proved by histopathological examination. Additional paired HCC/liver specimens were derived from 29 patients with HCC. All the HCC samples corresponded with differentiation grades II–III of the disease according to the Edmondson grading system. All sample collections were obtained with informed consent. Tissues were kept frozen at −80°C immediately after separation.
DNA and RNA Extraction.
Genomic DNA was prepared by SDS-proteinase K and the phenol-chloroform extraction method (8). Total RNA was extracted from frozen tissues by using TRIzol reagent following the protocols of the manufacturer (GIBCO/BRL). The selection of poly(A)+ RNA from total RNA was performed by using oligo(dT) according to protocol (Qiagen, Chatsworth, CA).
cDNA Library Construction.
An equal quantity of poly(A)+ RNA from four primary HCC, and the four corresponding noncancerous liver specimens were mixed into two separate pools (HCC and noncancerous liver). The cDNA library construction was performed by using Uni-ZAP XR vector system by oligo(dT)-primed and directionally cloned procedure according to the recommended protocol from Stratagene.
DNA Sequencing and Bioinformatics Analysis.
DNA sequencing, quality assessment, and bioinformatics analysis were performed as described (9). Clustering of the 5′ ESTs was performed by using CAT 3.5 from Pangea (Oakland, CA) with default parameters.
cDNA Microarrays.
Nylon membrane-based cDNA microarrays were prepared by using Spotter (BioRobotics, Cambridge, U.K.) containing clones from the present work and other tissue resources and the internal controls (9–12). The procedures for probe preparation, hybridization, washing, scanning, and signal intensity normalization of the spots were performed also using a previously described method (10). The hybridization experiments were quadruplicated for each specimen, and the results were combined. The differential expression was considered as significant between HCC and noncancerous liver when the ratio of signals between the same spots on different membranes was greater than 2. The Atlas human cancer 1.2 array from CLONTECH containing 1,176 genes was used also to approach the gene expression profiling.
MSA and CGH.
MSA was performed according to the method described by Wang et al. (13). CGH was carried out with modified methods described by Kallioniemi et al. (14) and analyzed with CYTOVISION software (Applied Image, Ltd., U.K.). The signals detected were considered as with high level amplification or significant loss if there were imbalanced ratios of cancerous to reference DNA either greater than 1.5 or less than 0.5.
Semiquantitative Reverse Transcriptase (RT)-PCR.
To confirm and further address the differential display at transcription levels among paired HCC/liver samples, the semiquantitative RT-PCRs for a selected number of genes/ESTs (Fig. 1) were performed according to a previously described method (15).
Figure 1.

The results of semiquantitative RT-PCR against 54 genes/ESTs in 29 paired HCC/noncancerous liver samples. The markers were selected either because of their possible relationship to cell proliferation, apoptosis, and angiogenesis or on the basis of their differential expressions between HCC and noncancerous liver. The total RNAs were extracted from the above tissues and used for gene-specific RT-PCR with coamplification of β-actin as internal control. The expression levels of specific genes/ESTs in HCC were folded according to the ratio of the band density of HCC to that of non-HCC after the quantity of β-actin control was normalized as 1. The values given are the averages of results from three experiments. The clustering analysis was performed by using the software CLUSTER, kindly provided by Dr. Eisen.
Chromosome Mapping.
A number of genes/ESTs of interest were mapped to chromosomes by searching UniGene, GeneMap 99, and the human genome database (http://www.ncbi.nlm.nih.gov).
Statistical Analysis.
The statistical analysis was performed as described previously (ref. 16; http://igs-server.cnrs-mrs.fr) for comparing gene expression profiles based on EST data of our own, and of human fetal (Lib.168 and Lib.1026, 2,172 clusters in total) and adult (Lib.155, 2,636 clusters generated) livers published in GenBank.
Results
Overview of EST Sequencing and cDNA Microarray Analysis for the Gene Expression Profiles of Paired HCC/Liver.
After eliminating repetitive elements, mitochondrial DNA, and ambiguous sequences, a total of 33,474 sequences from paired HCC/liver samples were analyzed further and grouped into known genes (21,625, 64.6%), known ESTs (7,253, 21.7%), and previously uncharacterized ESTs (4,596, 13.7%) by searching GenBank and human database of ESTs (data may be accessed by going to http://www.ncbi.nlm.nih.gov or http://www.chgc.sh.cn). Those sequences were integrated into 11,065 clusters, of which 3,695 (33%), 3,740 (34%), and 3,630 (33%) corresponded to known genes, database of ESTs, and previously undescribed ESTs, respectively. The gene expression profiles, based on EST data from either HCC or liver, reflected well the functional characteristics of liver, because the majority of the 20 genes with the highest expression level according to EST copy numbers were hepatocyte-specific markers (Table 1). For a number of gene/EST species with relatively high expression in either HCC or liver, the copy numbers were used to evaluate the up- or down-regulation status (P < 0.05). Then, a homemade cDNA microarray format with 12,393 clusters, including 11,065 of HCC/liver origin and 1,328 from other tissue resources (10–12), was used in four independent experiments with probes derived from the four paired HCC/liver samples. Similar experiments were performed by using the Atlas human cancer 1.2 array containing 1,176 known genes related to oncogenesis. When all data from the above three resources (13,210 clusters) were integrated, a catalog of candidate genes/ESTs was generated containing a total of 884 (6.7%) up-regulated and 1,369 (10.4%) down-regulated in HCC (see Tables 4–6 and Fig. 3, which are published as supporting information on the PNAS web site, www.pnas.org).
Table 1.
First 20 known genes expressed highly in HCC and corresponding noncancerous liver (non-HCC), respectively, from EST sequencing
| HCC
|
Non-HCC
|
||
|---|---|---|---|
| Gene name | Copies, %* | Gene name | Copies, %* |
| Hs.75442 (serum albumin)†‡ | 1,007 (5.87) | Hs.75442 (serum albumin)†‡ | 1,226 (7.51) |
| Hs.75621 (α1-antitrypsin)† | 180 (1.05) | Hs.75431 (fibrinogen, γ polypeptide)†‡ | 275 (1.68) |
| Hs.76177 (inter-α-trypsin inhibitor)†‡ | 125 (0.73) | Hs.75621 (α-1-antitrypsin)† | 202 (1.24) |
| Hs.237658 (apolipoprotein AII)‡ | 102 (0.60) | Hs.234234 (aldolase B)†‡ | 194 (1.19) |
| Hs.75431 (fibrinogen, γ-polypeptide)†‡ | 86 (0.50) | Hs.3314 (selenoprotein P)†‡ | 167 (1.02) |
| Hs.278693 (TI-227H)†‡ | 86 (0.50) | Hs.7645 (fibrinogen β-chain)†‡ | 138 (0.84) |
| Hs.75615 (apolipoprotein C-II)†‡ | 85 (0.50) | Hs.278693 (TI-227H)†‡ | 120 (0.73) |
| Hs.3314 (selenoprotein P)†‡ | 78 (0.46) | Hs.1219 (ADH4 gene for class II alcohol dehydrogenase)‡ | 100 (0.61) |
| Hs.7645 (fibrinogen β-chain)†‡ | 67 (0.39) | Hs.1870 (phenylalanine hydroxylase)‡ | 87 (0.53) |
| Hs.234234 (aldolase B)†‡ | 66 (0.39) | Hs.76177 (inter-α-trypsin inhibitor)†‡ | 87 (0.53) |
| Hs.76415 (PK-120)‡ | 57 (0.33) | Hs.75183 (cytochrome P-450j)†‡ | 79 (0.48) |
| Hs.75430 (α-2-HS-glycoprotein)†‡ | 55 (0.32) | Hs.4 (alcohol dehydrogenase β-1-subunit)‡ | 68 (0.42) |
| Hs.73742 (ribosomal protein, large, P0)†‡ | 54 (0.32) | Hs.75335 (L-arginine:glycine amidinotransferase)‡ | 66 (0.40) |
| Hs.156110 (IgG)‡ | 50 (0.29) | Hs.75155 (transferrin)† | 57 (0.35) |
| Hs.118162 (fibronectin)† | 49 (0.29) | Hs.1252 (apolipoprotein H)† | 54 (0.33) |
| Hs.111334 (ferritin, light polypeptide)‡ | 48 (0.29) | Hs.75615 (apolipoprotein C-II)†‡ | 52 (0.32) |
| Hs.155421 (α-fetoprotein)‡ | 45 (0.26) | Hs.118162 (fibronectin)† | 51 (0.31) |
| Hs.79037 (chaperonin 10)‡ | 42 (0.25) | Hs.50966 (carbamyl phosphate synthetase I)‡ | 47 (0.29) |
| Hs.169401 (apolipoprotein E)‡ | 41 (0.24) | Hs.1504 (hemopexin)‡ | 46 (0.28) |
| Hs.75155 (transferrin)† | 40 (0.23) | Hs.76053 (RNA helicase p68)‡ | 45 (0.27) |
Percentage of a given EST in all ESTs obtained from that of cDNA libraries.
The gene was hit concurrently in the list of the first 50 genes expressed highly in both HCC and non-HCC from EST sequencing.
Significant differences of gene expression (P < 0.05) between HCC and non-HCC by statistical analysis (http://igs-server.cnrs-mrs.fr).
Expression of HBV Genes in HCC Versus Liver.
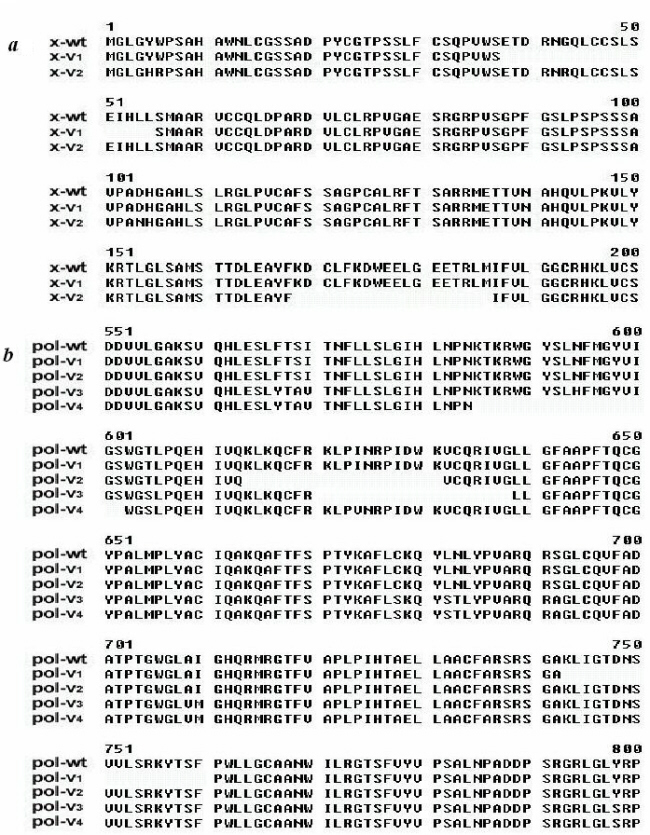
Forty-one ESTs matched to the DNA sequence of HBV. Seventeen ESTs corresponding to X protein and 21 corresponding to DNA polymerase were found in noncancerous liver, whereas only 1 hit of X protein and 2 hits of DNA polymerase were found from HCC, implying that HBV tends to be down-regulated at the transcriptional level in hepatocarcinogenesis. With semiquantitative RT-PCR, 14 of 29 patient samples had X protein expression over 2-fold higher in noncancerous liver than in HCC, whereas only 2 of 29 showed significantly higher expression in HCC tissues (Fig. 1, P < 0.01). In addition six transcripts, four of DNA polymerase and two of X protein, exhibited sequence variations. All these were deletions of 18-aa residues (54 bp) located in different sites of the genes (for detail, see Tables 4–6 and Fig. 3).
Change of Liver Function/Differentiation in HCC.
Table 2 shows a catalog of genes involved in hepatic functions but with altered expression in HCC. 6-Phosphofructokinase-1, the rate-limiting enzyme in the glycolysis pathway, was increased as in most human cancers. In contrast, a majority of the enzymes involved in respiratory chain, glycogen synthesis, amino acid, and lipid metabolism were down-regulated. A number of liver-synthesized functional proteins such as albumin, transferrin, and coagulation factors were decreased. Of note, some enzymes implicated in biotransformation such as CYP family members and the glutathione S-transferases were decreased. When the gene expression profiles of HCC/liver were compared with human fetal liver (Lib.168 and Lib.1026) and adult liver (Lib.155), published in GenBank, a number of genes from HCC such as α-fetal protein, fetal liver CYP450, and CYP450IID were found expressed in fetal liver but not in normal adult liver. Genes such as CD34, erythropoietin receptor, myeloid cell nuclear differentiation antigen (MNDA), early development regulator 2, and placental protein 15 (PP15), which are associated with hematopoiesis or embryonic development and hence are markers of fetal liver, also were encountered in HCC.
Table 2.
Alteration of hepatocellular function at the transcript level in HCC*
| Categories | Key enzyme/protein | Alteration |
|---|---|---|
| Glysometabolism | ||
| Glycolysis | 6-phosphofructokinase-1 | ↑ |
| Glyconeogenesis | Glucose-6-phosphatase | ↓ |
| Pyruvate carboxy kinase 1 | ↓ | |
| Fructose-1,6-biphosphatase | ↓ | |
| Respiratory chain | NADH dehydrogenase Fe-S protein 8 | ↓ |
| NADH dehydrogenase 1 α subcomplex | ↓ | |
| NADH dehydrogenase Fe-S protein 6 | ↓ | |
| Pyruvate dehydrogenase 1 | ↓ | |
| Glycogen synthesis | Galactokinase 1 | ↓ |
| Galactokinase 2 | ↓ | |
| Aldolase B, fructose-bisphosphate | ↓ | |
| Uridine diphospho glucose pyrophosphorylase 2 | ↓ | |
| Glycogen synthase 2 | ↓ | |
| Amino acid metabolism | Leucine aminopeptidase | ↑ |
| Alanine:glyoxylate aminotransferase | ↑ | |
| Carbamyl phosphate synthetase I | ↓ | |
| Phenylalanine hydroxylase | ↓ | |
| Kynurenine 3-hydroxylase | ↓ | |
| Ornithine decarboxylase | ↓ | |
| Protein metabolism | Prealbumin | ↓ |
| Serum albumin | ↓ | |
| Transferrin | ↓ | |
| Fibrinogen α chain | ↓ | |
| Fibrinogen β chain | ↓ | |
| α-1 type XVI collagen | ↓ | |
| α-1 type XVI collagen | ↓ | |
| Antithrombin III | ↓ | |
| Coagulation factor XIII | ↓ | |
| Ceruloplasmin | ↓ | |
| C-reactive protein | ↓ | |
| Ferritin H | ↑ | |
| α-fetoprotein | ↑ | |
| Lipid metabolism | Acyl-coenzyme A:cholesterol acyltransferase 1 | ↓ |
| 7-Dehydrocholesterol reductase | ↓ | |
| CTP:phosphocholinecytidyl transferase | ↓ | |
| Acyl-CoA dehydrogenase | ↓ | |
| Fatty acid synthase | ↓ | |
| Nucleic acid metabolism | Adenosine deaminase | ↑ |
| Biotransformation | Cytochrome P450-IIB | ↓ |
| Cytochrome P450 IIC | ↓ | |
| Cytochrome P450c 17 | ↓ | |
| Cytochrome P450 IIE1 | ↓ | |
| P450 mRNA encoding nifedipine oxidase | ↓ | |
| Cholesterol side chain cleavage enzyme P450 | ↓ | |
| Lanosterol 14-demethylase cytochrome P450 | ↓ | |
| Glutathione S-transferase θ1 | ↓ | |
| Glutathione S-transferase | ↓ | |
| Glutathione S-transferase μ3 | ↓ | |
| Glutathione S-transferase θ2 | ↓ | |
| Monoamine oxidase A | ↓ | |
| Chlordecone reductase | ↓ | |
| Dihydropteridine reductase | ↓ | |
| ζ-crystallin/quinone reductase | ↓ | |
| Ubiquinol-cytochrome c reductase subunit | ↓ |
The data were integrated from ESTs and cDNA array data with statistically significant differences or more than 2-fold between HCC and non-HCC.
Deregulated Signal Pathways Associated with Oncogenesis.
According to EST and cDNA array data, a number of genes (oncogenes and tumor suppressor genes) and signal pathways associated with cell proliferation, cell cycle, apoptosis, and angiogenesis were deregulated in hepatocarcinogenesis (Table 3). A relatively large scale semiquantitative RT-PCR then was performed in 29 additional paired HCC/liver samples (Fig. 1). Increased expression was observed on genes involved in DNA replication, such as topoisomerase 2a and replication protein A3. Of note, some cyclins (A2, B1, E1, and G1) and cyclin-dependent kinases (CDK1, -8, -9, and -10) were found to be overexpressed. However, cyclin D1, another key component, was down-regulated in most patients. The expression levels of several cell cycle negative regulators, namely p27, p53, and Pten, were decreased in a significant number of patients. In the Wnt-β-catenin pathway, an expression of β-catenin and Wnt 2b was seen in some patients, whereas E-cadherin was under-expressed in most patients. Deregulated apoptosis also might be involved in hepatocarcinogenesis. For example, growth arrest-specific 2 was down-regulated remarkably in a some patients with HCC. Angiogenesis may be enhanced in hepatocarcinogenesis, because vascular endothelial growth factor was highly expressed in HCC cells, whereas thrombospondin-1 and -2, both inhibitors of angiogenesis, were down-regulated. Notably, several ESTs (AV698527, AV681468, AV652699, and AV697773) showed significant expression in most HCCs, whereas others (AV683086 and AV649564) were down-regulated. Whether these ESTs represent genes playing a role in HCC pathogenesis is worth further study. As shown in Fig. 1, gene expression profiles may reveal two clusters. In one cluster a significant up-regulation was observed in XPR-1, AV652699, AV697773, p38, MAPK6, c-jun, Rb, and p15, whereas in the other N-ras overexpression was more prominent. A stepwise regression analysis was performed to distinguish those genes with most characteristic expression profiles of HCC. When the selection level was 0.05 (i.e., the probability of genes related to hepatocarcinogenesis is 95%), the multiple regression analyses [y = 0.5967 − 0.3825 × (growth arrest-specific 2) − 1.3986 × (myeloid cell leukemia sequence 1) + 2.3162 × (topoisomerase 2a) − 0.7668 × (AV683086) + 0.7232 × (cyclin A2)] indicated that over-regulated topoisomerase 2a and cyclin A2 as well as down-regulated growth arrest-specific 2, myeloid cell leukemia sequence 1, and EST AV683086 might contribute to hepatocarcinogenesis.
Table 3.
The changes of known genes associated possibly with oncogenesis at transcript level in HCC*
| Growth factors, cytokines, chemokines and receptors |
| Hs.55173 epidermal growth factor receptor (EGFR) |
| Hs.251664 insulin-like growth factor 2 (IGF2) |
| Hs.85087 LTBP4 |
| Hs.74615 PDGFRA |
| Hs.76144 PDGFRB |
| Hs.278426 PDGF-associated protein (PAP) |
| G proteins and receptors |
| Hs.6838 ras homolog gene family, member E (ARHE) |
| Hs.173466 p21-rac2 |
| Oncogene, kinase, and transcription factors |
| NM 003392 Wnt-5A |
| Hs.74101 protein tyrosine kinase (Syk) |
| Hs.5947 mel transforming oncogene |
| Hs.3446 MAP kinase kinase 1 (MAPKK 1) |
| Hs.72241 MAP kinase kinase 2 (MAPKK 2) |
| Hs.250870 MAP kinase kinase 5 (MAPKK 5) |
| Hs.861 p44-MAPK |
| Hs.271980 p97-MAPK |
| Hs.181390 casein kinase I γ 2 (CKI-γ 2) |
| Hs.144477 casein kinase I α isoform (CSNK1A1) |
| Hs.60679 transcriptional activation factor TAFII32 |
| NM 000905 NOTCH1 |
| AF026816 putative oncogene protein |
| Hs.82919 cullin homolog 2 (CUL2) |
| Hs.177415 fau |
| Hs.2021 SP1 |
| Hs.78442 nuclear protein SKIP |
| Hs.192861 transcription factor Spi-B |
| Hs.61796 transcription factor erf-1 |
| Hs.101047 transcription factor (E2A) |
| Hs.168005 TIF1 |
| Cell cycle regulators |
| Hs.79101 G2/mitotic-specific cyclin G1 (CCNG1) |
| Hs.25283 CDK8 |
| Hs.150423 CDK9 |
| Hs.77313 CDK10 |
| Hs.184326 CDC10 |
| Hs.270845 mitotic kinesin-like protein-1 (MKLP-1) |
| Hs.77550 CKS1 |
| Hs.83758 CKS2 |
| Hs.2869 CDK5 activator |
| Hs.59498 CDC2-related protein kinase CHED |
| Hs.1592 CDC16 |
| Tumor suppressor and related proteins |
| Hs.75862 mothers against dpp homolog 4 (SMAD4) |
| Hs.65029 GAS1 |
| Hs.226133 GAS7 |
| Apoptosis and associated proteins |
| Hs.75263 IAP homologB (MIHB)(API1) |
| Hs.41714 BCL-2 binding athanogene-1 (BAG-1) |
| Hs.93213 BCL-2 homologous antagonist/killer (BAK) |
| Hs.166468 programmed cell death 5 (PDCD5) |
| Hs.99120 dead box. Y isoform (DBY) |
| Hs.83429 TNF-related apoptosis inducing ligand (TRAIL) |
| Hs.90957 TNF receptor associated factor 6 (TRAF6) |
| Hs.129844 decoy receptor 2 |
| Hs.18720 programmed cell death 8 |
| Hs.20191 HSIAH2 |
| DNA replication, DNA damage, and repair and related proteins |
| Hs.77602 DDB2 |
| Hs.11393 RAD51C |
| Hs.180455 RAD23A |
| Hs.59544 ERCC1 |
| Hs.54418 ABH |
| Hs.1770 LIG1 |
| Hs.100555 Myc-regulated dead box protein |
| Hs.88556 histone deacetylase 1 (HD1) |
| Angiogenesis activators and inhibitors |
| Hs.78781 VEGFB |
| Hs.87409 thrombospondin 1 precursor (THBS2) |
The deregulated genes associated with oncogenesis were integrated from EST data with statistical significance and cDNA array with 2-fold difference, not including data confirmed by RT-PCR. Genes in bold type were up-regulated, and those in roman type were down-regulated. Each gene given has its UniGene number or accession number on the left.
Correlation Between Gene Expression Profiles and the Genomic Imbalance.
To investigate the relationship between genomic imbalance and transcript levels, CGH and MSA were performed for four paired HCC/liver samples, of which the gene expression levels were examined by using EST cataloging and cDNA microarray. The results revealed that there are genomic gain/amplification on chromosomes 1q, 8q, and 13q, whereas a loss of heterozygosity is revealed on chromosomes 4q, 8p, 16q, and 17p by CGH and MSA analysis (data not shown). Then, genes/ESTs that might be up- or down-regulated in HCC according to the EST copy number and cDNA microarray data were mapped to different chromosomes by searching UniGene, the human genome database, and GeneMap 99 (http://www.ncbi.nlm.nih.gov; Fig. 2). The results indicated that on chromosomes 1q, 8q, and 13q with genomic gain/amplification a high proportion of genes/ESTs was found with significant overexpression (46.8, 32.6, and 39.5%), whereas the number of genes with significant down-regulation was low (6.4, 6.9, and 5.2%; P < 0.01 to <0.05, as compared with the average percentages of genes with up- and down-regulation, respectively). The situation on chromosomal regions 4q, 8p, 16q, and 17p with potential loss of heterozygosity was just the opposite in that they harbored a much higher number of down-regulated genes (35.5, 60.0, 47.9, and 27.1%) but a significantly lower percentage of overexpressed genes (6.5, 2.5, 8.3, and 1.7%; P < 0.01 to <0.05 when compared with average control levels). A selected number of genes on these regions of interest also were subject to semiquantitative RT-PCR, and the expression levels of all of them were confirmed to correlate with the imbalanced genomic status of the chromosomal regions.
Figure 2.

The localization map of up- or down-regulated genes/ESTs with statistical significance of EST copy numbers or more than 2-fold differences between HCC and non-HCC based on cDNA arrays or RT-PCR. (a) Genes on amplified chromosome regions. (b) Genes located on chromosomes with allelic deletion. Chromosomal localizations of the genes were determined by searching the UniGene database, GeneMap99, and the human genome database (http://www.ncbi.nlm.nih.gov/genome/guide/human/). Up- or down-regulated genes/ESTs confirmed by semiquantitative RT-PCR in HCC patient samples are boxed.
Expression Levels of Transcription Factors.
The fact that the expression levels of some genes in chromosomes with genomic imbalance were not in line with the DNA copies suggested existence of regulation at a distinct level such as the transcriptional control. We therefore checked all transcription factors with altered expression levels (for detail, see Tables 4–6 and Fig. 3). Of note, hepatic tissue-specific transcription factors such as hepatocyte nuclear factor 4γ were found lowly expressed.
Discussion
It is generally accepted that although the number of genes with mutation is limited in a cancer, a great number of genes in related pathways may be affected at the expression level, and this aberrant gene transcriptional expression network should be essential in the initiation/maintenance of the malignant phenotype. The transcriptome analysis of human cancer by using EST strategy, cDNA microarray, oligonucleotide microarray, as well as serial analysis of gene expression, known as the cancer genome anatomy project, thus may provide important clues for understanding oncogenesis. In this work, the differences in gene expression profiles between HCC and noncancerous liver were characterized in large scale to explore the potential HCC molecular pathogenesis. Our data basically showed two categories of gene expression profile modification. The first one mainly affects those genes involved in the liver function and/or differentiation status of hepatocytes. Although 6-phosphofructokinase-1 was increased, which is in agreement with increased glycolysis as seen in many cancers, a large number of genes participating in the metabolism of glucose, lipids, and amino acids and those responsible for the liver-synthesized proteins were down-regulated. In addition to the overexpression of α-fetal protein, also found among most HCC patients in the present study, dozens of gene/EST markers reminiscent of embryonization or dedifferentiation of hepatocytes were noted. Although most of those features may reflect the consequences of the liver cell transformation and thus are unlikely to play an essential role in carcinogenesis, some of them may be used as clinical diagnostic markers, especially when combined with the proteomics analysis (17). An interesting finding was that many enzymes for biotransformation were down-regulated, leaving the question open of whether this phenomena simply represents an altered liver function or whether it could be involved in the HCC pathogenesis. A second type of gene expression alteration, in contrast, may cover a number of regulatory pathways responsible for the control of cell proliferation, differentiation, and apoptosis. The abnormality of these pathways therefore may represent a network required for the multistep process in HCC development. Previously, analysis on several individual signal transducers was reported and genes such as p53-p21waf1/cip1 (18), MAPK, Jak/Stat (19), TGF-β (20), and Wnt pathways (4) were considered as being potentially implicated in mechanisms associated with HCC. It may be interesting to note that all these features were revealed in the present work. Importantly, more components were related to these crucial pathways through our comprehensive analysis. For example, around the cell cycle control, not only negative regulators such as p27, p53, and Pten were found with reduced expression, but also many cyclins and cyclin-dependent kinases were identified as being overexpressed. The combination of these events may drive the hepatocytes into a cell proliferation. However, cyclin D1, another key component of the cell cycle, was down-regulated in majority of HCC samples while significantly overexpressed in most of breast cancers (21). The activation of the Wnt-β-catenin pathway is also worth noting, because mutations of two mutually interactive components of this pathway, β-catenin and AXIN1, have been reported in some patients with HCC (3, 22). It has been shown that the accumulation of β-catenin in the presence of Wnts or caused by slowed degradation of the mutant protein may give cells a growth advantage. Moreover, down-regulation of E-cadherin, a membrane protein that binds and thereby blocks the biological activity of β-catenin, results in an increased release of β-catenin into cytoplasm. Of note, increased expression of β-catenin, Wnt2b, and Wnt5a as well as decreased expression of E-cadherin was found in some HCC samples, whereas the pattern wasn't observed in other tumors such as prostate cancer (23). Hence, it is possible that the disturbance of the Wnt-β-catenin pathway also is generated through aberrant transcriptional expression. On the other hand, the clustering analysis of the expression profiles in our study suggests that some pathways such as mitogen-activated protein kinase could be involved only in a subset of patients, indicating the presence of the heterogeneity in the molecular pathogenesis of HCC. Interestingly, in addition to a long list of known genes with aberrant expression profiles, we found that a number of ESTs were deregulated in most HCC samples. The genes represented by them might be contributed to hepatocarcinogenesis. AV698527, a potential oncogene candidate harboring on chromosomal amplification region, was overexpressed in most HCC samples. Conversely, AV683086, with down-regulation in HCC, was mapped to a chromosomal loss of heterozygosity region in which a tumor suppressor gene candidate might be localized. Therefore, molecular cloning of the corresponding genes and characterization of their functions should be a logical task in the next step of the work.
Several factors may cause aberrant gene transcriptional abnormalities in HCC. Previously, HBV-X gene products with aberrant trans-activation properties were postulated to play an important role in malignant transformation (24). The mutation of HBV-X protein, possibly accumulated during chronic viral infection in hepatic cells, as also found in this study might change its trans-activation properties and antiproliferative activity (25). However, the fact that the expression level of HBV-X was lower in HCC than in the noncancerous liver among most cases suggests that this protein could play a role in hepatocellular carcinogenesis in a hit-and-run manner. Recently many groups including our own identified nonrandom chromosomal regions with amplification or loss of heterozygosity in HCC, which may cause a change of gene dosage (13, 26). We therefore attempted to integrate gene expression data with MSA and CGH evaluation. Indeed, on amplified chromosomes such as 1q, 8q, and 13q the percentages of genes/ESTs with above 2-fold overexpression were significantly higher (32.6–46.8%) than that of the average level (6.7%), whereas on regions with allelic deletion (4q, 8p, 16q, and 17p) those with obvious down-regulation were higher (27.1–60.0%) as compared with the general figure (10.4%). In addition, aberrant gene expression profiles may also be ascribed to the change of the transcriptional regulation. In this work we found a low expression level of the hepatocyte nuclear factor 4γ, a relatively hepatic-specific transcription factor. This may explain the decreased level of a number of CYP450 family members, which are known as target genes of hepatocyte nuclear factor 4γ (27). In short, an overview of the transcriptome status of hepatocellular carcinogenesis may lay a foundation for the further research on the mechanisms of this cancer of utmost clinical and biological significance.
Supplementary Material
Acknowledgments
This work was supported by Chinese National Key Program on Basic Research (973), National Natural Science Foundation of China (30070852 and 39970370), National Foundation for Excellence Doctoral Project (200058), Chinese High Tech R&D Program (863), and Shanghai Commission for Science and Technology.
Abbreviations
- HCC
hepatocellular carcinoma
- HBV
hepatitis B virus
- MSA
microsatellite analysis
- CGH
comparative genomic hybridization
- EST
expressed sequence tag
- RT
reverse transcriptase
Footnotes
References
- 1.Schafer D F, Sorrell M F. Lancet. 1999;353:1253–1257. doi: 10.1016/S0140-6736(98)09148-X. [DOI] [PubMed] [Google Scholar]
- 2.Montesano R, Hainaut P, Wild C P. J Natl Cancer Inst. 1997;89:1844–1851. doi: 10.1093/jnci/89.24.1844. [DOI] [PubMed] [Google Scholar]
- 3.de La Coste A, Romagnolo B, Billuart P, Renard C A, Buendia M A, Soubrane O, Fabre M, Chelly J, Beldjord C, Kahn A, et al. Proc Natl Acad Sci USA. 1998;95:8847–8851. doi: 10.1073/pnas.95.15.8847. [DOI] [PMC free article] [PubMed] [Google Scholar]
- 4.Seidensticker M J, Behrens J. Biochim Biophys Acta. 2000;1490:168–182. doi: 10.1016/s0167-4889(99)00158-5. [DOI] [PubMed] [Google Scholar]
- 5.Fujimoto Y, Hampton L L, Wirth P J, Wang N J, Xie J P, Thorgeirsson S S. Cancer Res. 1994;54:281–285. [PubMed] [Google Scholar]
- 6.Nagai H, Pineau P, Tiollais P, Buendia M A, Dejean A. Oncogene. 1997;14:2927–2933. doi: 10.1038/sj.onc.1201136. [DOI] [PubMed] [Google Scholar]
- 7.Golub T R. N Engl J Med. 2001;344:601–602. doi: 10.1056/NEJM200102223440809. [DOI] [PubMed] [Google Scholar]
- 8.Maniatis T, Fritsch J, Sambrook J. Molecular Cloning: A Laboratory Manual. Plainview, NY: Cold Spring Harbor Lab. Press; 1989. pp. 37–57. [Google Scholar]
- 9.Hu R M, Han Z G, Song H D, Peng Y D, Huang Q H, Ren S X, Gu Y J, Huang C H, Li Y B, Jiang C L, et al. Proc Natl Acad Sci USA. 2000;97:9543–9548. doi: 10.1073/pnas.160270997. . (First Published August 8, 2000; 10.1073/pnas.160270997) [DOI] [PMC free article] [PubMed] [Google Scholar]
- 10.Xu L, Hui L, Wang S, Gong J, Jin Y, Wang Y, Ji Y, Wu X, Han Z, Hu G. Cancer Res. 2001;61:3176–3181. [PubMed] [Google Scholar]
- 11.Mao M, Fu G, Wu J S, Zhang Q H, Zhou J, Kan L X, Huang Q H, He K L, Gu B W, Han Z G, et al. Proc Natl Acad Sci USA. 1998;95:8175–8180. doi: 10.1073/pnas.95.14.8175. [DOI] [PMC free article] [PubMed] [Google Scholar]
- 12.Gu J, Zhang Q H, Huang Q H, Ren S X, Wu X Y, Ye M, Huang C H, Fu G, Zhou J, Han Z G, et al. The Hematology Journal. 2000;1:206–217. doi: 10.1038/sj.thj.6200020. [DOI] [PubMed] [Google Scholar]
- 13.Wang G, Zhao Y, Liu X, Wang L, Wu C, Zhang W, Liu W, Zhang P, Cong W, Zhu Y, et al. Genes Chromsomes Cancer. 2001;31:221–227. doi: 10.1002/gcc.1138. [DOI] [PubMed] [Google Scholar]
- 14.Kallioniemi A, Visakorpi T, Karhu R, Pinkel D, Kallioniemi O P. Methods. 1996;9:113–121. doi: 10.1006/meth.1996.0015. [DOI] [PubMed] [Google Scholar]
- 15.Han Z G, Zhang Q H, Ye M, Kan L X, Gu B W, He K L, Shi S L, Zhou J, Fu G, Mao M, et al. J Biol Chem. 1999;274:35741–35748. doi: 10.1074/jbc.274.50.35741. [DOI] [PubMed] [Google Scholar]
- 16.Audic S, Claverie J M. Genome Res. 1997;7:986–995. doi: 10.1101/gr.7.10.986. [DOI] [PubMed] [Google Scholar]
- 17.Abelev G I, Eraiser T L. Semin Cancer Biol. 1999;9:95–107. doi: 10.1006/scbi.1998.0084. [DOI] [PubMed] [Google Scholar]
- 18.Park U S, Park S K, Lee Y I, Park J G, Lee Y I. Oncogene. 2000;19:3384–3394. doi: 10.1038/sj.onc.1203674. [DOI] [PubMed] [Google Scholar]
- 19.Arbuthnot P, Capovilla A, Kew M. J Gastroenterol Hepatol. 2000;15:357–368. doi: 10.1046/j.1440-1746.2000.02069.x. [DOI] [PubMed] [Google Scholar]
- 20.Matsuzaki K, Date M, Furukawa F, Tahashi Y, Matsushita M, Sakitani K, Yamashiki N, Seki T, Saito H, Nishizawa M, et al. Cancer Res. 2000;60:1394–1402. [PubMed] [Google Scholar]
- 21.Yu Q Y, Geng Y, Sicinski P. Nature (London) 2001;411:1017–1021. doi: 10.1038/35082500. [DOI] [PubMed] [Google Scholar]
- 22.Satoh S, Daigo Y, Furukawa Y, Kato T, Miwa N, Nishiwaki T, Kawasoe T, Ishiguro H, Fujita M, Tokino T, et al. Nat Genet. 2000;24:245–250. doi: 10.1038/73448. [DOI] [PubMed] [Google Scholar]
- 23.Waghray A, Schober M, Feroze F, Yao F, Virgin J, Chen Y Q. Cancer Res. 2001;61:4283–4286. [PubMed] [Google Scholar]
- 24.Yeh C T, Shen C H, Tai D I, Chu C M, Liaw Y F. Oncogene. 2000;19:5213–5220. doi: 10.1038/sj.onc.1203903. [DOI] [PubMed] [Google Scholar]
- 25.Sirma H, Giannini C, Poussin K, Paterlini P, Kremsdorf D, Brechot C. Oncogene. 1999;18:4848–4859. doi: 10.1038/sj.onc.1202867. [DOI] [PubMed] [Google Scholar]
- 26.Piao Z, Park C, Park J H, Kim H. Int J Cancer. 1998;5:29–33. doi: 10.1002/(sici)1097-0215(19980105)75:1<29::aid-ijc5>3.0.co;2-3. [DOI] [PubMed] [Google Scholar]
- 27.Jover R, Bort R, Gomez-Lechon M J, Castell J V. Hepatology. 2001;33:668–675. doi: 10.1053/jhep.2001.22176. [DOI] [PubMed] [Google Scholar]
Associated Data
This section collects any data citations, data availability statements, or supplementary materials included in this article.