

Summary
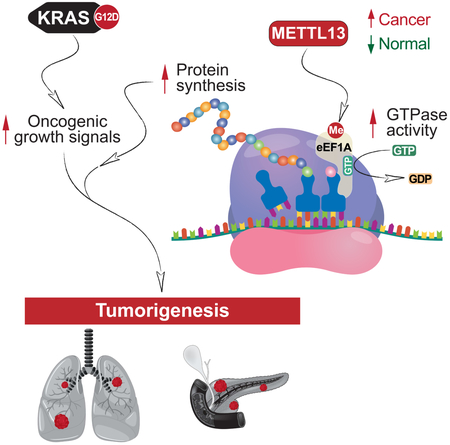
Increased protein synthesis plays an etiologic role in diverse cancers. Here we demonstrate that METTL13 (methyltransferase-like 13) dimethylation of eEF1A (eukaryotic elongation factor 1A) lysine 55 (eEF1AK55me2) is utilized by Ras-driven cancers to increase translational output and promote tumorigenesis in vivo. METTL13-catalyzed eEF1A methylation increases eEF1A’s intrinsic GTPase activity in vitro and protein production in cells. METTL13 and eEF1AK55me2 levels are upregulated in cancer and negatively correlate with pancreatic and lung cancer patient survival. METTL13 deletion and eEF1AK55me2 loss dramatically reduce Ras-driven neoplastic growth in mouse models and in patient-derived xenografts (PDX) from primary pancreatic and lung tumors. Finally, METTL13 depletion renders PDX tumors hypersensitive to drugs that target growth-signaling pathways. Together, our work uncovers a mechanism by which lethal cancers become dependent on the METTL13-eEF1AK55me2 axis to meet their elevated protein synthesis requirement and suggests that METTL13 inhibition may constitute a targetable vulnerability of tumors driven by aberrant Ras-signaling.
Keywords: METTL13, eEF1A, lysine methylation, RAS, protein methylation, translation, translation elongation, pancreatic cancer, lung cancer
Graphical Abstract:
Introduction
Lysine methylation is the addition of one, two or three methyl groups to the ε-nitrogen of a lysine sidechain, forming mono-, di-, and tri-methylated derivatives (referred to here as me1, me2, and me3, respectively). The chemical addition of methyl moieties to lysine residues is catalyzed by lysine methyltransferases (KMTs). Biological functions for lysine methylation is best characterized on histone proteins and the regulation of epigenetics and chromatin biology (Chi et al., 2010). Beyond histones, there is a growing appreciation that a number of non-histone proteins (e.g. p53, RB, RelA) are modulated by lysine methylation (Carlson and Gozani, 2016). In the human proteome there are predicted to be greater than 100 KMTs that belong to one of two protein methylase families: SET (Su(var)3–9, Enhancer-of-zeste, Trithorax) domain enzymes and 7bS (seven-β-strand) enzymes (Clarke, 2013). All of the validated histone KMTs reside within the SET domain family with the exception of the H3K79 KMT hDOT1L, which belongs to the 7βS family. Several additional SET and 7βS enzymes methylate non-histone proteins to influence different nuclear and cytoplasmic activities; however, the biological function, catalytic activity and substrate specificity for the majority of the large family of 7βS KMTs remains to be elucidated (Carlson and Gozani, 2016).
The GTPase eEF1A (eukaryotic elongation factor 1 alpha) is an evolutionarily conserved and fundamental non-ribosomal component of the translational machinery and one of the most abundant proteins found in eukaryotic proteomes (Schuller and Green, 2018). Methylation of eEF1A occurs at several lysine residues, many of which are conserved from yeast to humans (Hamey and Wilkins, 2018; Jakobsson et al., 2018a). Further, it has been suggested that akin to the extensive role histone methylation plays in chromatin regulation, eEF1A methylation may likewise regulate distinct eEF1A-mediated biology, including translation elongation. In humans, there are two eEF1A paralogs, eEF1A1 and eEF1A2, which are 90% identical and 98% similar. The expression of eEF1A1 is ubiquitous while eEF1A2 expression is limited largely to post-mitotic cells (e.g. neurons and cardiomyocytes) (Lee and Surh, 2009). However, eEF1A2 expression is re-activated in cancers and eEF1A1 levels are generally higher in neoplastic relative to normal tissues (Lee and Surh, 2009). Furthermore, cancers that are driven by PI3K-AKT activation show increased sensitivity to eEF1A inhibitors (Lee and Surh, 2009). Connections between mRNA translation and cancer are well-established whereby it is postulated that alterations in the components of the translation apparatus, including eEF1A1/2 overexpression, may be required to fuel neoplastic growth downstream of oncogenic RAS-MAPK and PI3K-AKT signaling, which frequently drive lethal neoplasms including lung and pancreatic cancer (Bhat et al., 2015; Robichaud et al., 2018; Truitt and Ruggero, 2016).
Lung cancer is the most common cause of global cancer-related mortality, leading to over a million deaths each year, and lung adenocarcinoma (LAC) is the most common histological type. Most LAC cases are due to oncogenic KRAS and/or additional mutations that are to date unfortunately not clinically actionable. Pancreatic cancer is also a lethal malignancy. More than 75% of patients die within the first twelve months of diagnosis; the five-year survival rate is below 5%. Pancreatic ductal adenocarcinoma (PDAC) is the most prevalent pancreatic cancer subtype. It typically presents at an advanced stage and is refractory to most treatment modalities. The vast majority of PDAC cases express oncogenic mutant KRAS (Almoguera et al., 1988). Due to the lethality of LAC and PDAC, the fundamental role of the KRAS pathway, and the difficulty in directly inhibiting KRAS, drug discovery efforts have turned to inhibiting downstream kinase targets (e.g. RAF, MEK1/2 and ERK1/2) and Ras-activated pathways (e.g. PI3K). While compounds that inhibit these kinases have shown promise in cell culture and animal experiments, clinical studies have been less encouraging due to toxicity and the development of therapy resistance (Infante et al., 2014). Thus, there is great interest in identifying factors that cooperate with the canonical KRAS pathway to drive cancer with the hope that a therapeutic strategy hitting multiple pathways will hinder resistance development, while also mitigating toxicity by lowering the overall dose needed for each medicine.
In this work, we find that di-methylation of eEF1A at lysine 55 (eEF1AK55me2) is a high stoichiometry species that is upregulated in pancreatic and lung cancers and associated with poor clinical outcomes. In a genetic screen we identify the orphan protein METTL13 as the physiologic enzyme specifically tasked with generating eEF1AK55me2. Notably, METTL13 expression is also upregulated in cancer wherein it negatively correlates with patient survival. We demonstrate that METTL13, via eEF1AK55 methylation, regulates protein synthesis in cancer cells. Further, METTL13 depletion inhibits proliferation of several cancer cell lines and significantly reduces tumorigenesis in vivo in Ras-driven pancreatic and lung cancer mouse models and in patient-derived xenograft models from human pancreatic and lung cancers. Finally, we show that METTL13 depletion markedly sensitizes cancer cells and xenograft tumors to drugs that target growth-signaling pathways. Together, our data support a model in which regulation of translation elongation by the METTL13-eEF1AK55me2 axis serves as a mechanism utilized by malignancies to adapt to their increased translational requirements.
RESULTS
Identification of the orphan gene METTL13 as a candidate eEF1A lysine 55 dimethyltransferase
The methylation of eEF1A is conserved from yeast to humans, suggesting that akin to histone methylation, a modification network may regulate specific eEF1A functions (Hamey and Wilkins, 2018; Jakobsson et al., 2018a). While several conserved enzymes that methylate different residues on eEF1A have been identified, the KMT responsible for generating methylation of eEF1A at lysine 55 (eEF1AK55me), a modification that is present in humans but not detected in yeast, is not known (Figure 1A). We analyzed methylation of eEF1A purified from seven cell lines by liquid chromatography tandem mass spectrometry (LC-MS/MS) and found that >98% of eEF1A1/2 molecules harbor di-methylation at K55, with a small fraction of K55 being unmodified or bearing mono-methylation (Figure 1B and S1A-B). Next, we raised state-specific eEF1AK55me1–3 antibodies and found that each antibody selectively recognized its own state of methylation on eEF1A peptides (Figure 1C and S1C). In addition, the anti-eEF1AK55me2 antibody selectively recognized eEF1AK55me2 peptides, as it did not bind to 19 different peptides from other proteins that harbour a dimethyl lysine (Figure S1D).
Figure 1. Identification of METTL13 as a Candidate eEF1A Lysine 55 Methyltransferase.

(A) Schematic of human eEF1A with the indicated major lysine methylation sites and protein domains. Methylated lysine residues are indicated by grey dots. Arrows connect the enzyme responsible for methylation with the indicated lysine residue. The “?” indicates that the enzyme for generating K55 methylation is unknown.
(B) eEF1AK55 is primarily di-methylated in human cell lines. Quantitative analysis of endogenous eEF1AK55 methylation levels in the indicated cell lines by mass spectrometry.
(C) Specific recognition of eEF1AK55me2 peptides by the anti-eEF1AK55me2 antibody. Dot blot analysis with αeEF1AK55me2 antibody (K55me2) using the indicated biotinylated peptides. Blots probed with HRP-conjugated streptavidin (strep-HRP) shown as loading controls.
(D) Schematic of gene editing-coupled biochemical screening strategy to discover candidate KMT/s responsible for eEF1AK55 methylation. See Table S1 for list of the 322 sgRNAs.
(E) Identification of METTL13 as a putative eEF1AK55 methyltransferase. Western analysis with the indicated antibodies of U2OS whole cell lysates expressing CRISPR/Cas9 and three independent sgRNAs targeting METTL13 (as in Figure S1F) and the control sgRNA (as in Figure S1E). Total eEF1A levels do no change and tubulin is shown as a loading control.
To discover the enzyme that generates the eEF1AK55me2 mark, we used a gene editing coupled biochemical screening strategy (see schematic, Figure 1D). 107 known and putative KMTs in the human genome were identified and a focused CRISPR/Cas9 knockout collection was generated consisting of 3 independent small guide RNAs (sgRNA) per KMT gene and one control sgRNA for a total of 322 sgRNAs (Table S1). The collection was used to generate 322 individual U2OS cell lines, each expressing a single sgRNA from the collection. Lysates were prepared from each individual cell line to generate a collection of 322 unique lysates, which were systematically probed with the eEF1AK55me2 antibody to determine gene(s) whose deletion results in loss of the eEF1A methylation signal (Figure 1D; for control lysate see Figure S1E). Strikingly, out of the 107 potential KMTs that were targeted by sgRNAs, abrogating METTL13 expression was the only intervention that reduced eEF1AK55me2 signal (Figure S1E-F). Notably, two sgRNAs (METTL13-b and -c) reduced METTL13 protein levels, which was paralleled by a decrease in eEF1AK55me2 signal, whereas cells expressing the METTL13-a sgRNA retained METTL13 expression and failed to reduce eEF1AK55me2 signal (Figure 1E). These results suggest that out of 107 potential KMTs in the human genome, only METTL13, an uncharacterized member of the 7βS family, regulates eEF1AK55 dimethylation in U2OS cells.
The principal physiologic activity of METTL13 is generation of eEF1AK55me2
In in vitro methylation assays using recombinant proteins with 3H-SAM (S-adenosyl-methionine) as the methyl donor, METTL13 methylated GST-eEF1A1 and GST-eEF1A2, but not eEF1A1/2 proteins harboring a K55R substitution (Figure 2A). We also performed in vitro methylation reactions with non-radiolabeled SAM and observed METTL13 mono- and dimethylation (but not tri-methylation) of eEF1A1/2 at K55 by Western blotting (Figure 2B) and LC-MS/MS (Figure S2A-B).
Figure 2. In vitro Methylation of eEF1A at Lysine 55 by METTL13.

(A) In vitro methylation assay with recombinant METT13 and recombinant wild-type GST-eEF1A1/2 or K55R mutants as indicated. Top panel, 3H-SAM is the methyl donor and methylation visualized by autoradiography. Bottom panel, Coomassie stain of proteins in the reaction. Asterisk in (A-C, E) indicates METTL13 breakdown product.
(B) In vitro methylation assay as in (A) with non-radiolabeled SAM. Top panel, Western analysis with anti-eEF1AK55me2. Bottom panel, Coomassie stain of proteins in the reaction.
(C) The N-terminal MT1 domain of METTL13 is necessary for eEF1AK55 methylation. In vitro methylation assay on GST-eEF1A1 with recombinant wild-type METTL13 or the indicated domain deletion fragments. Top panel, schematic diagram of putative methyltransferase (MT) domains of METTL13 and the truncated fragments used in methylation assays. Middle panel, autoradiogram of methylation assay. Bottom panel, Coomassie stain of proteins in the reaction.
(D) Amino acids 1-401 of METTL13 are sufficient for eEF1AK55 methylation. In vitro methylation assay on GST-eEF1A1 with wild-type METTL13 or the indicated METTL13 truncated proteins. Top panel, autoradiogram of methylation assay. Bottom panel, Coomassie stain of proteins in the reaction.
(E) Identification of METTL13 catalytic mutant. In vitro methylation assay on GST-eEF1A1 with wild-type METTL13 or METTL13 G58R mutant. Top panel, autoradiogram of methylation assay. Bottom panel, Coomassie stain of proteins in the reaction.
See also Figure S2
METTL13 contains two putative methyltransferase (MTase) domains, one at the N-terminus and one at the C-terminus (top panel, Figure 2C). The N-terminal MTase 1 domain is necessary for METTL13 methylation of GST-eEF1AK55, whereas the C-terminal domain is dispensable for this activity (Figure 2C). Structure-function analysis identified residues 1-401 of METTL13 as sufficient for eEF1AK55 methylation activity, as further C-terminal deletions were not tolerated (Figure 2D). Using a combination of structural modelling (Figure S2C) and sequence homology to other 7βS KMTs (Figure S2D), we identified several specific substitutions that abrogated METTL13’s catalytic activity (Figure S2D), including G58R, which is predicted to interfere with SAM binding (Figure 2E and S2C).
In addition to U2OS cells (see Figure 1E), we found that depletion of METTL13 by two independent sgRNAs (targeting exon-intron junctions and named METTL13-1 and METTL13-2) resulted in loss of eEF1AK55me2 in six additional cell lines as determined by Western blotting (Figure 3A; LC-MS/MS shown in Figure S3A). Complementation of METTL13-depleted NCI-H2170 cells with CRISPR-resistant wild-type METTL13, but not the catalytic-dead METTL13G58R, restored eEF1AK55me2 levels (Figure 3B). Collectively, these results identify METTL13 as a bona fide KMT that methylates eEF1A at K55 in vitro and is required for maintenance of physiologic levels of eEF1AK55me2 in cells in a catalytic activity-dependent manner.
Figure 3. The Principal Physiologic Activity of METTL13 is eEF1AK55 Methylation.

(A) METTL13 is required for eEF1AK55 methylation in multiple human cell lines. Western analysis with the indicated antibodies of whole cell extracts (WCEs) from the indicated cell lines (see methods) expressing two independent sgRNAs targeting METTL13 or a control sgRNA.
(B) Reconstitution with wild-type METTL13 but not the inactive mutant restores EF1AK55me2 in cells. Western analysis with the indicated antibodies of WCEs from wild-type or METTL13-deficient NCI-H2170 cells complemented with CRISPR-resistant METTL13 (WT or G58R), or control as indicated.
(C) Histones and nucleosomes are not methylated by METTL13. In vitro methylation assay as in Figure 2 on recombinant GST-eEF1A1, core histones (H2A, H2B, H3, and H4) or recombinant nucleosome (rNuc) with METTL13. eEF1A breakdown products containing K55 are seen below full-length with long exposure. Top panel, autoradiogram of methylation assay. Bottom panel, Coomassie stain of proteins in the reaction.
(D) Purified ribosomes are not methylated by METTL13. In vitro methylation assay as in (C) on recombinant GST-eEF1A1, 40S and 60S ribosomal subunits, and 80S ribosomes isolated from cytoplasmic extracts of T3M4 cells with indicated METTL13 protein.
(E) Methylation of eEF1AK55 is the only change out of >1000 methylated events detected upon METTL13 depletion in cells. Top panel, Western analysis with the indicated antibodies of WCEs from control or METTL13-depleted T3M4 cells maintained in SILAC media. Bottom panel, SILAC-based quantitative proteomic analysis of methylated peptides in cells ±METTL13. Methylated peptides are plotted by their SILAC ratios in two independent experiments in the forward (x axis) and reverse (y axis) experiments. Any methylated peptide that is dependent upon METTL13 will reside in the top right quadrant. Of the >1000 methylated peptides detected in the analysis (see Table S2), only the two eEF1A peptides harboring K55me1 and K55me2 are present in the top right quadrant as indicated in red. L/H, light over heavy fraction ratio.
eEF1A is one of the more abundant proteins in the human proteome and K55me2 is a high-stoichiometry event (Hamey and Wilkins, 2018; Jakobsson et al., 2018a) (Figure 1B). Based on our screen (Figure S1F) and cellular depletion studies (Figure 3A), our data argue that METTL13 is the principal enzyme tasked with generating physiologic eEF1AK55me2. This raises the question of whether the converse is true: is eEF1AK55 the only METTL13 substrate or one of many relevant substrates? Histones are heavily methylated and there are many enzymes that function as histone KMTs (Mum and Shi, 2017). However, in vitro, METTL13 does not methylate the four core histones (H3, H2A, H2B, and H4) or nucleosomes (Figure 3C). In addition, METTL13 does not methylate any proteins present in the 40S and 60S ribosomal subunits and 80S ribosomes that lack eEF1A (Figures 3D and S3B). To investigate METTL13 catalytic specificity in a physiologic and unbiased setting, we used quantitative proteomics to compare the methylome of the PDAC cell line T3M4 ±METTL13 (Figure 3E). Of the >1000 methylation events detected in the analysis, eEF1AK55 methylation (me1 and me2) were the only modifications quantitatively altered upon METTL13 depletion; no changes were observed in histone methylation or for other eEF1A methylated residues (Figure 3E; Table S2). Structural modeling of the METTL13 catalytic core showed a distinct substrate recognition domain (Figure S2C), which is reminiscent of PrmA, a bacterial lysine methyltransferase that achieves substrate specificity through a conformation-specific enzyme-substrate interaction (Demirci et al., 2007). Indeed, METTL13 requires full-length eEF1A and is not active on an eEF1A peptide spanning K55 of eEF1A (Figure S3C), suggesting that it employs a three-dimensional topological substrate recognition mechanism similar to that of PrmA. Taken together, these results indicate that the principal physiologic catalytic activity of METTL13 is eEF1AK55 methylation (see Discussion).
METTL13 and eEF1AK55me2 are highly expressed in pancreatic cancer and promote proliferation of pancreatic cancer cells.
A meta-analysis of six publicly available human PDAC datasets showed consistent up-regulation of METTL13 mRNA levels and a significant negative correlation between high METTL13 expression and PDAC patient survival (Figures S4A-B). Moreover, while METTL13 protein expression was largely undetected by immunohistochemistry (IHC) in the normal pancreas, it was clearly observed in sections from murine and human PDAC samples (Figure 4A and S4C). IHC analysis of eEF1AK55me2 signal also showed a similar pattern, with low signal in normal pancreas and a strong signal in adjacent malignant tissue (Figure 4A and S4C). Further, both METTL13 and eEF1AK55me2 immunostaining signals on PDAC patient tissue arrays showed significant correlation with poor patient survival (Figure 4B-C). Similar results were observed for METTL13 expression and eEF1AK55me2 signal in lung cancer (Figures S4D-F). Consistent with these results, there is a strong correlation between METTL13 and eEF1AK55me2 protein levels in both cancer types (Figure 4D). Finally, METTL13 and eEF1AK55me2 (and total eEF1A) levels are all elevated in pancreatic and lung cancer cell lines compared to the non-transformed IMR-90 and RPE-1 cell lines (Figure 4E).
Figure 4. METTL13 and eEF1AK55me2 Promote Cancer Cell Proliferation.

(A) Representative IHC images showing METTL13 and eEF1AK55me2 expression in pancreatic cancer lesions (arrowheads) but not in adjacent normal acini (asterisk) in human tissue samples (representative of 12 independent samples). Scale bars, 100 μm. The area marked with dotted lines is presented at higher magnification in the insets.
(B and C) Analysis of correlation of METTL13 (B) and eEF1AK55me2 (C) staining and PDAC patient survival assessed by IHC. ***P < 0.001, log-rank test, 72 different samples were stained in total for each antibody, a representative staining presented on the right. Scale bars: 100 μm.
(D) Correlation analysis of METTL13 and eEF1AK55me2 IHC signal (from B-C and S4E-F). Spearman correction r = 0.715, P-value < 0.0001, data presented as percent of samples in each category (see Methods).
(E) Upregulation of METTL13 expression and eEF1AK55me2 levels in pancreatic and lung cancer cells compared to non-transformed cell lines. Western analysis with the indicated antibodies of WCEs from the indicated cell lines. IMR90 are normal human fibroblasts, RPE-1 are immortalized non-transformed human epithelial cells. Tubulin is shown as a loading control.
(F and G) METTL13 depletion inhibits cell proliferation in a PDAC cell line but not in non-transformed cells. Western analysis (top pane) of WCEs and cell proliferation rates (bottom panel) of the non-transformed cell line RPE-1 (F) and human PDAC cell line T3M4 (G) expressing two independent METTL13 sgRNAs or a control sgRNA. Error bars represent S.D. from three independent experiments. **P < 0.01, n.s., not significant, two-tailed unpaired Student’s t-test.
(H) METTL13 catalytic activity is required for METTL13-dependent proliferation of T3M4 cells. Western analysis and cell proliferation rates as in (G) of control or METTL13-depleted T3M4 cells complemented with CRISPR-resistant METTL13WT, METTL13G58R or control. Error bars represent S.D. from three independent experiments. *P < 0.05, **P < 0.01, ***P < 0.001, n.s., not significant, two-tailed unpaired Student’s t-test.
(I) Role for intact K55 on eEF1A2 in promoting T3M4 proliferation. Western analysis and cell proliferation rates as in (G) of eEF1A2-depleted T3M4 cells complemented with CRISPR-resistant eEF1A2WT, eEF1A2K55R or control. Error bars represent S.D. from three independent experiments. **P < 0.01, ***P < 0.001, n.s., not significant, two-tailed unpaired Student’s t-test.
See also Figure S4
Our observations suggest a potential role for METTL13 and eEF1AK55me2 in oncogenesis. In this regard, depletion of METTL13 had no impact on proliferation of the non-transformed RPE-1 cell line (Figure 4F) but inhibited proliferation of the PDAC T3M4 cell line (Figure 4G) and six additional pancreatic, lung and other cancer cell lines (Figure S4G). The reduction in proliferation upon METTL13 depletion in T3M4 cells was rescued by complementation with CRISPR-resistant ectopic wild-type METTL13, but not by complementation with catalytically inactive METTL13G58R (Figure 4H). Our results implicate METTL13 methylation of eEF1AK55 in PDAC cell proliferation. We next wanted to independently test the role of eEF1AK55 in the regulation of T3M4 cell proliferation. Since the highly abundant eEF1A1 isoform of eEF1A is essential for mRNA translation and eEF1A2 expression is re-activated in cancers, we focused on testing K55 in the context of eEF1A2 function in proliferation. Depletion of eEF1A2 led to a moderate reduction in overall eEF1AK55me2 levels (with the likely remaining signal being chiefly eEF1A1K55me2) and moderately attenuated proliferation of T3M4 cells (Figure 4I). Complementation with wild-type eEF1A2, but not eEF1A2 harboring a K55R substitution (eEF1A2K55R), was able to fully restore cancer cell proliferation (Figure 4I). Together these data argue that METTL13 regulates the proliferation of pancreatic cancer cells via di-methylation of eEF1AK55.
Methylation regulates eEF1A GTPase activity and mRNA translation in cells
Since K55 of eEF1A is located on the catalytic surface of the eEF1A GTPase domain, we investigated the possibility that methylation may modulate its GTPase activity. To this end, recombinant Flag-tagged eEF1A proteins ±K55me were purified from either METTL13-overexpressing 293T cells or METTL13-depleted 293T cells expressing METTL13G58R (leading to virtually complete loss of K55 methylation) (Figures 5A and S5A). We performed in vitro GTP hydrolysis assays to determine Michaelis-Menten kinetic properties of purified eEF1A proteins ± K55me2 (Figure S5B). The catalytic efficiency (kcat/KM) of eEF1A was ~20% higher in the K55 methylated state relative to the unmethylated state (Figure 5B and S5B), due to an increase in Vmax with no change in the Michaelis constant (Figure 5B). Notwithstanding that K55 dimethylation increased basal GTPase activity of eEF1A, aminoacyl-tRNAs (aa-tRNAs) stimulation of eEF1A GTPase activity did not depend on the K55 methylation status (Cavallius and Merrick, 1998; Van Noort et al., 1986) (Figure S5C). Though upon aa-tRNA stimulation, GTPase activity of K55 dimethylated eEF1A remained higher as compared to K55 methylation deficient eEF1A (Figure S5C). These results suggest that METTL13-depenent eEF1A K55 dimethylation increases its GTPase activity, which may boost translation elongation and thereby increase protein synthesis.
Figure 5. METTL13-mediated eEF1AK55 Dimethylation Enhances Protein Synthesis in Cells.

(A) Purification of recombinant eEF1A1 ±K55me2. Top and middle panels, Western analysis with the indicated antibodies of eEF1A purified from 293T cells ±catalytically active METTL13 as indicated. Bottom panel, Coomassie stain of purified eEF1A1.
(B) K55me2 increases the catalytic efficiency of GTP hydrolysis by eEF1A. The Michaelis-Menten kinetic parameters of Flag-eEF1A1 ±K55me2 purified from (A) are shown.
(C) Cytosolic extracts were isolated from control or METTL13-depleted T3M4 cells and fractionated on 5-50% sucrose gradients. Absorbance profiles show distribution of 40 and 60S ribosomal subunits, 80S monosome and polysomes. OD260nm, optical density at 260 nm. Left panel, Western analysis represents WCEs from the indicated cell lines used for the polysome profiling.
(D and E) SUnSET assays under the indicated conditions reveal reduced protein production in METTL13-depleted T3M4 (D) and NCI-H2170 (E) cells. WCEs were isolated and probed the indicated antibodies.
(F) AHA labeling under the indicated conditions shows decrease in protein synthesis upon depletion of METTL13 in T3M4 cells. WCE of T3M4 probed with the indicated antibodies.
(G) METTL13’s catalytic activity is required for enhanced protein synthesis in cells. SUnSET assays as in (D) of control (sgControl plus vector control) or METTL13-depleted T3M4 cells complemented with CRISPR-resistant METTL13WT, METTL13G58R or control as indicated and after recovery from serum starvation. WCEs were isolated and probed the indicated antibodies.
See also Figure S5
To analyze the impact of eEF1AK55me2 depletion on mRNA translation we performed polysome profiling experiments on extracts from T3M4 cells ± METTL13 (Gandin et al., 2014). An accumulation of heavy polysomes and a decrease in light polysomes was observed in cells depleted of METTL13 relative to control cells (Figures 5C and S5D). An elevated heavy/light polysome ratio may reflect (i) increase in translation initiation which results in an engagement of a higher number of ribosomes into polysomes thereby suggesting upregulation of protein synthesis or (ii) downregulation of protein synthesis due to the reduction in elongation rates which lead to protracted occupancy and stalling of polysomes on mRNA. Since these scenarios are expected to have opposing effects on mRNA translation rates, we directly measured protein synthesis using surface sensing of translation (SUnSET) (a method for monitoring global protein synthesis through detection of puromycin-labeled neosynthesized proteins (Schmidt et al., 2009)), in pancreatic (T3M4) and lung (NCI-H2170) cancer cell lines ±METTL13 (Figures 5D-E). In both cancer cell lines, METTL13 depletion decreased global protein synthesis, which was most evident after serum re-feeding of serum-starved cells wherein protein synthesis is acutely stimulated. In contrast, METTL13 depletion had no impact on global protein synthesis in the non-transformed RPE-1 cell line irrespective of conditions (Figure S5E). To avoid potential biases associated with puromycylation approaches, we pulsed cells with the methionine analog L-azidohomoalanine (AHA) (Iwasaki and Ingolia, 2017). When incorporated into newly synthesized proteins, the analog can be detected with streptavidin by first clicking the azide group of AHA to biotin-alkyne. The AHA incorporation assays mirrored results obtained by SUnSET in T3M4 cells (Figure 5F). Moreover, reconstitution of METTL13-depleted T3M4 cells with wild-type METTL13 restored protein synthesis levels to those observed in the control, whereas complementation with catalytic-dead METTL13G58R failed to do so (Figure 5G). Finally, depletion of eEF1A1 and eEF1A2, which as expected resulted in decreased protein synthesis of serum-stimulated cells, was partially rescued by complementation with wild-type eEF1A2, but not with the K55R eEF1A2 mutant (Figure S5F). These data suggest that consistent with its effect on proliferation, eEF1AK55 methylation by METTL13 stimulates protein synthesis in pancreatic cancer cells.
METTL13 ablation inhibits Ras-driven tumorigenesis
METTL13 and eEF1AK55me2 levels negatively correlate with PDAC patient survival, while stimulating processes required for neoplastic growth (i.e. protein synthesis and proliferation). To directly test the role of METTL13 in Ras-driven PDAC, we first generated conditional Mettl13loxP/loxP mutant mice, which develop normally, are viable, and fertile (Figure S6A-B). Deletion of Mettl13 specifically in the pancreas of mice using a pancreas-specific Cre-recombinase expressing strain Ptf1aCre/+ (Kawaguchi et al., 2002) resulted in no apparent developmental consequences and no evident physiological defects (data not shown).
Acinar-to-ductal metaplasia (ADM) is an early step in PDAC initiation triggered by KRAS activating mutations (Crawford et al., 2002; Kanda et al., 2012). Using an ex vivo 3D culture system in which EGF stimulated RAS activation induces ADM (Guerra et al., 2003; Zhu et al., 2007), as well as Mettl13 expression (Figure S6B), we found that Mettl13 deletion inhibited the appearance of duct-like structures (Figure S6C-E). To further investigate the role of METTL13 in KRAS-driven PDAC, Mettl13 mutant mice were crossed to mice harboring a loxP-Stop-loxP KrasG12D knock-in allele (KrasLSL-G12D/+, hereafter Kras) (Hingorani et al., 2003), which allows for the controlled induction of oncogenic KRAS and the initiation of cancer. In vivo, ADM and PDAC initiation can be triggered in young Kras mutant mice by inducing severe acute pancreatitis via repeated injections of caerulein (Lee and Bar-Sagi, 2010; Morris et al., 2010) (see schematic Figure 6A). In this system, deletion of Mettl13, which led to complete loss of eEF1AK55me2 (Figure 6C and 6E), greatly reduced the appearance of pancreatic intra-epithelial neoplasia (PanIN) brought on by Kras activation (Figure 6D), as assessed by histopathological analysis and decreased signals for MUC5 (a marker of PanINs) and Ki67 (proliferation marker) (Figure 6B-E). These data suggest that METTL13 is required for efficient initiation of pancreatic cancer by oncogenic KRAS.
Figure 6. METTL13 Deletion Represses KRAS-driven Pancreatic and Lung Tumorigenesis In Vivo.

(A) Schematic of the caerulein pancreatitis-induced precancerous (PanINs) lesion formation protocol used in Kras;Mettl13 and Kras (control) mice.
(B) Representative examples of pancreata gross images (representative of 12 independent samples). Scale bar, 1 cm.
(C) Representative haematoxylin and eosin (HE) staining and IHC for MUC5, a marker of PanIN lesions, Ki67, a marker of cell proliferation, METTL13 and eEF1AK55me2 (representative of 12 independent samples). Scale bars, 100 μm.
(D) Quantification of Ki67-positive proliferating cell and MUC5-positive lesions in caerulein-treated pancreata from Kras control (n = 12) and Kras;Mettl13 (n = 12). ***P < 0.001, two-tailed unpaired Student’s t-test. Data are represented as mean ± s.e.m.
(E) Westerns with the indicated antibodies of pancreatic tissue lysates from Kras;Mettl13 and Kras (control) mutant mice (two independent and representative samples are shown for each genotype).
(F) Kaplan-Meier survival curves of Kras;p53 control mice (n = 10, median survival = 54 d) and Kras;p53;Mettl13 mutant mice (n = 6, median survival = 86 d). ***P < 0.001, log-rank test for significance.
(G) Representative MRI scan in 7th week to analyze tumor volume in Kras;p53;Mettl13 and Kras;p53 mutant mice. Red dotted lines indicate pancreas area; abbreviations used: P=pancreas, S=stomach, K=kidney, Sp=spleen. Scale bars, 1cm.
(H) Tumor/pancreas volume quantification in 7th week of age based on MRI scan (detailed procedure in Methods) of Kras;p53;Mettl13 and Kras;p53 mice (n = 4, each genotype) ***P < 0.001, two-tailed unpaired Student’s t-test. Data are represented as mean ± s.e.m.
(I) Representative HE and IHC for Ki67 (a maker of proliferation) and Cleaved Caspase 3 (Cl.Casp 3, a marker of apoptosis) in pancreas tumors at autopsy in Kras;p53;Mettl13 and Kras;p53 mutant mice. Scale bars, 100 μm, insets magnification x10.
(J) Quantification of Ki67-positive proliferating cell and Cleaved Caspase 3 apoptotic cells in pancreata at autopsy from Kras;p53 control (n = 6) and Kras;p53;Mettl13 (n = 6) mutant mice. ***P < 0.001, two-tailed unpaired Student’s t-test. Data are represented as mean ± s.e.m.
(K) Representative macroscopic picture of lungs, HE staining and IHC for phospho-Histone H3 (pH3, a marker of proliferation), METTL13 and eEF1AK55me2 (representative of 8 independent samples). Scale bars: yellow 1 cm; black 100 μm.
(L) Quantification of tumor number, tumor area (burden) and phospho Histone H3-positive (pH3+) proliferating cells per lung area in Kras control (n = 8) and Kras;Mettl13 (n = 8). ***P < 0.001, two-tailed unpaired Student’s t-test. Data are represented as mean ± s.e.m.
See also Figure S6
To study pancreatic tumor development and to perform survival studies, we used the Ptf1a+/Cre;Kras+/LSL-G12D;p53loxP/loxP (Kras;p53) mutant model in which PDAC develops with 100% penetrance 6-8 weeks after birth (Bardeesy et al., 2006). In this aggressive malignancy model, Mettl13 deletion extended median survival by 60% relative to controls - from 54 days to 86 days (Figure 6F). Accordingly, MRI revealed that tumor volumes in METTL13 knockouts were roughly reduced by 2/3 as compared to the age-matched control mice (Figure 6G-H) (Mazur et al., 2015). Finally, at autopsy, pancreatic tissue from Kras;p53 mutant mice is entirely occupied by transformed cells, whereas in Kras;p53;Mettl13 mutant mice areas of normal pancreatic tissue remain with overall decreased proliferation (Ki67) (Figure 6I-J). Together these data support a key in vivo role for METTL13 in oncogenic KRAS-driven pancreatic tumorigenesis.
METTL13 and eEF1A are also potentially involved in lung adenocarcinoma (Figures S4D-F), a cancer in which Ras is frequently activated (Cancer Genome Atlas Research, 2014). We tested METTL13 function in LAC by intratracheal injection of an adenovirus expressing the Cre recombinase (Ad-Cre) in adult Kras+/LSL-G12D (Kras) and Kras+/LSL-G12D;Mettl13loxP/loxP (Kras;Mettl13) mice. As expected Kras mutant mice developed widespread adenocarcinoma at 16 weeks after Ad-Cre infection (Jackson et al., 2001; Johnson et al., 2001), which was clearly visible at the whole organ level and by histopathology (Figure 6K). Strikingly, this was paralleled by the upregulation of METTL13 and eEF1AK55me2 (Figure 6K). In contrast Kras;Mettl13 mutant mice, which are devoid of eEF1AK55me2 (Figure 6K), tumor development was dramatically attenuated based on gross observation, quantification of tumor number and burden, and cell proliferation analysis by phospho-Histone H3 immunostaining (Figure 6K-L). Of note, a substantial fraction of tumors that emerged in the LAC model retained METTL13 expression and eEF1A methylation as assessed by IHC, suggesting incomplete bi-allelic Cre recombination in these clonal growths (Figure S6F) (Jackson et al., 2001; Liu et al., 2010). Together, these in vivo data indicate a central role for METTL13 in carcinogenesis of Ras-driven epithelial tumors of the pancreas and lung.
Next, we investigated the role of METTL13-eEF1AK55me2 in human cancers using PDAC and LAC patient-derived xenograft (PDX) models. First, we performed ex vivo complementation to knockdown endogenous METTL13 and deplete eEF1AK55me2, and then reconstituted samples with either wild-type or catalytic-dead METTL13 using multiple independent PDXs from both cancers types (Figures 7A-B, S7A-B). The depletion of METTL13 attenuated xenograft tumor growth in both PDAC and LAC models (Figures 7A-B, S7A-B). Complementation with wild-type METTL13, which restored eEF1AK55me2 levels close to the levels of control cells, also reestablished tumor growth (Figures 7A-B, S7A-B). In contrast, reconstitution with METT13G58R did not rescue tumor growth (Figures 7A-B, S7A-B). These data suggest that the pro-tumorigenic functions of METTL13 require its catalytic activity.
Figure 7. Depletion of METTL13’s Catalytic Activity Inhibits Growth of Pancreatic and Lung Cancer PDX Tumors in vivo and Regression of PDX Tumors by METTL13 Depletion and PI3K/mTOR Inhibitors.

(A) Tumor volume quantification for patient derived PDAC xenografts modified to express sgRNA METTL13 or sgRNA control and overexpressing METTL13WT or catalytically deficient METTL13G58R in mice (n = 8 mice for each treatment group). ***P < 0.001, two-tailed unpaired Student’s t-test. Data are represented as mean ± s.e.m. Westerns with the indicated antibodies of PDX biopsies (one representative sample for each condition is shown).
(B) Tumor volume quantification for patient derived LAC xenografts modified to express sgRNA METTL13 or sgRNA control and overexpressing METTL13WT or METTL13G58R in mice (n = 8 mice for each treatment group). ***P < 0.001, two-tailed unpaired Student’s t-test. Data are represented as mean ± s.e.m. Westerns with the indicated antibodies of PDX biopsies (one representative sample for each condition is shown).
(C) Population growth of T3M4 pancreatic cancer cell line depleted for METTL13 by CRISPR/Cas9 sgRNA (sgMETTL13) or control (sgControl). Confluency of cells over 96h treated with Omipalisib (1μM) or placebo (vehicle). ***P < 0.001, two-tailed unpaired Student’s t-test. Data are represented as mean ± s.e.m (three independent experiments). Westerns of WCE with the indicated antibodies are shown.
(D) Population growth of A549 lung cancer cell line depleted for METTL13 by CRISPR/Cas9 sgRNA (sgMETTL13) or control (sgControl) as in (C). ***P < 0.001, two-tailed unpaired Student’s t-test. Data are represented as mean ± s.e.m (three independent experiments). Westerns of WCE with the indicated antibodies are shown.
(E) Treatment schedule for administration of Omipalisib (GSK2126458, 1 mg kg–1, intraperitoneal injection once daily) to immunocompromised mice grafted with PDX pancreatic (see F) or lung cancer (see G). Control mice received placebo (vehicle). Treatment started when tumors were around 150 mm3.
(F and G) Tumor volume quantification for patient derived (C) PDAC and (D) LAC xenografts modified to express sgRNA METTL13 or sgRNA Control treated with placebo (vehicle) or Omipalisib. Plots showing fold change in tumor volume compared to initial tumor volume. ***P < 0.001, n.s., not significant, two-tailed unpaired Student’s t-test. Data are represented as mean ± s.e.m.
A feature of cancers triggered by oncogenes such as KRAS is up-regulation of protein synthesis (Bhat et al., 2015; Robichaud et al., 2018; Truitt and Ruggero, 2016). We postulated that one mechanism by which this may be achieved is through the METTL13-eEF1AK55me2 axis. This led us to speculate that inhibiting METTL13 may cooperate with compounds targeting growth-signaling, which renders malignant cells addicted to increased protein synthesis. To test this idea, a comparative cell-based screen using a library assembled of 285 characterized inhibitors covering ~170 cancer targets (Table S3) was performed to identify drugs that have increased efficacy against T3M4 pancreatic cancer cells in the absence of METTL13. Twelve drugs elicited a 50% increase in synthetic lethality when combined with METTL13 depletion (Table S3); these drugs predominantly inhibit the PI3K-mTOR and MAPK pathways (e.g. Omipalisib, Dactolisib, and Trametinib). Relative to control, treatment of pancreatic (T3M4) and lung (A459) cancer cells with the dual pan-PI3K/mTOR inhibitor Omipalisib or METTL13 depletion had modest effects on proliferation, and the combination of Omipalisib treatment with METTL13 depletion prevented both cell types from growing (Figure 7C-D). To test whether this synergy occurs in an in vivo context, PDX tumors ±METTL13 depletion were treated with Omipalisib and tumor growth was monitored (Figure 7E). Notably, PDAC and LAC PDX tumor growth stalled or regressed in size by the combination treatment (Figures 7F-G, S7C-D). Based on our results, we postulate that eEF1AK55 methylation by METTL13 constitutes a hitherto unappreciated mechanism required by neoplasms driven by KRAS pathways to meet their increased protein synthesis requirements (Chio et al., 2016; Martineau et al., 2014; Ruggero et al., 2004). These data also suggest that the METTL13-eEF1AK55me2 axis may constitute a clinically targetable vulnerability of cancers driven by aberrant growth signaling.
DISCUSSION
In a screen of 107 potential KMTs, we identified METTL13 as an active enzyme that specifically di-methylates the elongation factor eEF1A at lysine 55. Based on both depletion and reconstitution experiments in multiple independent cell lines, including primary pancreatic and lung cancer lines, as well as mouse tissue knockouts, we propose that METTL13 is the principal enzyme tasked with generating physiologic eEF1AK55me2. Another functionally important question we address is whether METTL13 has other lysine substrates besides eEF1AK55, particularly in the context of METTL13-associated translation regulation and cancer phenotypes. METTL13 does not methylate histones or any of the proteins stably associated with the 40S and 60S ribosomal subunits or 80S ribosomes. Moreover, eEF1AK55 methylation was the only observed change out of >1000 detected methylation events in cells depleted of METTL13. Consistently with the crucial role of eEF1A1/2 proteins in translation elongation and the pivotal role of protein synthesis in stimulating cell division (Brooks, 1977), we also observed a role for K55 of eEF1A2 in increasing proliferation of pancreatic cancer cells. Together, these findings, in combination with the expression patterns of METTL13 and eEF1AK55me2 in cancer, support our hypothesis that the biological and pathologic functions of METTL13 reported here are mediated through eEF1AK55 methylation. Further support comes from a recently published study that independently identified eEF1AK55 to be specifically methylated by METTL13 (Jakobsson et al., 2018b).
In the methylation of histones, several KMTs are highly selective enzymes with a single physiologic substrate (Carlson and Gozani, 2016); for example, the 7βS KMT hDOT1L recognizes a specific topology (the nucleosome) to methylate a single lysine (H3K79). As with histones, there are several KMTs – including METTL13 – that are devoted to methylating distinct lysines on eEF1A (Hamey and Wilkins, 2018; Jakobsson et al., 2018a). At chromatin, methylation dynamics are regulated not only by KMTs, but also by lysine demethylases and specific methyl-lysine “reader” domains, which together have a major impact in fine-tuning histone functions. We postulate that similar mechanisms are at play in the regulation of translation, and that eEF1A demethylases and readers will soon be identified. Future work may also uncover crosstalk between eEF1AK55 methylation and other eEF1A modifications in the regulation of translation elongation in diverse settings including human disease. Finally, it will also be interesting to explore potential roles for K55me2 in regulating non-canonical eEF1A functions such as RNA export, AKT signaling, and degradation of newly synthesized polypeptides (Abbas et al., 2015; Gandin et al., 2013).
Translation is amongst the most energy consuming processes in cells and dysregulation in translation mechanisms is a common etiologic agent in neoplastic diseases (Bhat et al., 2015; Robichaud et al., 2018; Truitt and Ruggero, 2016). Here we have provided evidence for a model in which METTL13-mediated methylation of eEF1A increases translation elongation and enhances protein synthesis to promote oncogenesis (see Figure S7E). METTL13 and eEF1AK55me2 protein levels are higher in transformed versus non-transformed cells, and higher in malignant Ras-driven pancreatic and lung cancer tissue relative to adjacent normal tissue. Consistently, increased expression of eEF1A1/2 is frequent in malignancies (Lee and Surh, 2009). Deletion of METTL13 profoundly inhibited the ability of oncogenic Ras to drive the development of pancreatic and lung cancers in vivo and greatly reduced tumor growth in mice of PDX models from primary human pancreatic and lung tumors. In contrast, METTL13 appears to be dispensable for proliferation of non-transformed cells and normal development of the pancreas. In this regard, the paradigm that translational capacity is in excess in normal tissue but becomes restrictive for tumorigenesis was established in mice haploinsufficient for eIF4E (Truitt et al., 2015). Notably, these mice develop normally, but like METTL13-deleted mice, Ras-driven tumorigenesis is attenuated in the LAC mouse model (Truitt et al., 2015); indeed inhibition of translation initiation with the eIF4A inhibitor SDS-1-021 (Chu et al., 2016) impacted cancer cells with aberrant Ras signaling but not IMR90 cells (Figure S7F-G). Our results raise the possibility that METTL13-eEF1AK55me2 enhancement of translation elongation becomes rate-limiting in growth signal-driven tumors like PDAC and LAC, which could potentially render these lethal cancers vulnerable to METTL13 inhibition. This is consistent with the findings that the eEF2-dependent modulation of translation elongation rates may play a context-dependent role in determining the fate of cancer cells (Faller et al., 2015; Leprivier et al., 2013).
In addition to PDAC and LAC, METTL13 depletion attenuated proliferation in two squamous cell lung cancer cell lines (NCI-H2170 and H520) with activated PI3K, suggesting a relatively broad oncogenic role for METTL13. In a focused cell-based small molecule screen we identified PI3K inhibitors and several other oncogenic growth pathway inhibitors that selectively cooperate with METTL13 depletion to prevent pancreatic and lung PDX tumor growth. As METTL13 appears to be selectively needed in the transformed cellular state and nonessential in normal tissue, a METTL13 inhibitor, in the context of a combination treatment strategy, may help overcome the narrow therapeutic index of compounds targeting growth signaling (e.g. PI3K) (Infante et al., 2014). In summary, we have identified METTL13 methylation of eEF1AK55 as a mechanism to regulate translation elongation and promote tumorigenesis. These results identify the METTL13-eEF1AK55me2 axis as a vulnerability of growth signaling-driven malignancies and provide a molecular basis for the future development of METTL13 inhibitors for the clinic.
STAR★ METHODS
CONTACT FOR REAGENT AND RESOURCE SHARING
Further information and requests for resources and reagents should be directed to and will be fulfilled by the Lead Contact: Or Gozani (ogozani@stanford.edu).
EXPERIMENTAL MODEL AND SUBJECT DETAILS
Mice
Ptf1a+/Cre, Kras+/LSL-G12D, Trp53loxP/loxP mice have been described before (Hingorani et al., 2003). Conditional Mettl13loxP/loxP gene (NCBI Reference Sequence: NM_144877.1) knockout mice were generated in this study. Briefly, to engineer the targeting vector, homology arms and exon 3 (conditional knockout region) was generated by PCR using BAC clone RP23-270A15 and RP24-316J6 from the C57BL/6J library as template. The targeting vector includes the self-excising Neo cassette flanked by Rox sites and exon 3 sequence were flanked by LoxP sites. DTA cassette (Diphtheria Toxin A) was used for negative selection. The linearized vector was subsequently delivered to ES cells (C57BL/6) via electroporation, followed by drug selection, PCR screening, and Southern Blot confirmation. Correctly targeted ES clones were selected for blastocyst microinjection, followed by founder mice production. Founders were confirmed as germline-transmitted via crossbreeding with wild-type animals. In conjunction with germ line transmission of the mutant allele the self-excising Neo cassette was deleted. Mice were in a mixed C57BL/6;129/Sv background, and we systematically used littermates as controls in all the experiments. Immunocompromised NSG mice (NOD.SCID-IL2Rg−/−) were utilized for transplantation studies. All experiments were performed on balanced cohorts of male and female mice as our initial data did not indicate significant differences in disease progression or response to treatment between females or males. All animals were numbered and experiments were conducted in a blinded fashion. After data collection, genotypes were revealed and animals assigned to groups for analysis. For treatment experiments mice were randomized. None of the mice with the appropriate genotype were excluded from this study or used in any other experiments. Mice had not undergone prior treatment or procedures. Husbandry and housing conditions: All mice were fed a standard chow diet ad libitum and housed in pathogen-free facility with standard controlled temperature, humidity, and light-dark cycle (12h) conditions with no more than 5 mice per cage under the supervision of veterinarians, in an AALAC-accredited animal facility at the University of Texas M.D. Anderson Cancer Center. All animal procedures were reviewed and approved by the MDACC Institutional Animal Care and Use Committee (IACUC 00001636, PI: Mazur).
Cell Lines
293T (female, embryonic kidney) cells were grown in DMEM medium supplemented with 10% fetal calf serum. U2OS (human bone osteosarcoma) cells were cultured in McCoy's 5a medium supplemented with 10% fetal bovine serum and 100 U/mL penicillin/streptomycin. Colo-357 (female, 77 years old, pancreatic cancer), L3.3 (female, 77 years old, pancreatic cancer), PaTu8902 (female, 44 years old, pancreatic cancer), and T3M4 (male, age not reported, pancreatic cancer) and HT1080 (male, 35 years old, fibrosarcoma) cells were cultured in DMEM supplemented with 10% fetal bovine serum, glutamine, and 100 U/mL penicillin/streptomycin. NCI-H2170 (male, age not reported, lung cancer) and NCI-H520 (male, age not reported, lung cancer) cells were cultured in RPMI 1640 medium supplemented with 10% fetal bovine serum and 100 U/mL penicillin/streptomycin. RPE-1 cells (human epithelial cells immortalized with hTERT) were from ATCC and cultured in DMEM:F12 medium supplemented with 10% fetal bovine serum, 100 U/mL penicillin/streptomycin, and 0.01mg/mL hygromycin B. IMR-90 (female, 16 weeks gestation, normal lung fibroblast) were from ATCC and cultured in EMEM supplemented with 10% fetal bovine serum and 100 U/mL penicillin/streptomycin. All cells were cultured at 37°C in a humidified incubator with 5% CO2. Cell lines were authenticated by short tandem repeat profiling and tested negative for mycoplasma (DDC Medical). Serum stimulation was performed after serum-starving overnight using regular 10% fetal bovine serum. For quantitative proteomics, wild-type and METTL13-depleted T3M4 cells were grown in SILAC media containing light or heavy amino acids (13C 15N -L-lysine/13C 15N - L-arginine, see Key Resources Table).
KEY RESOURCES TABLE
| REAGENT OR RESOURCE | SOURCE | IDENTIFIER |
|---|---|---|
| Antibodies | ||
| β-actin | Sigma-Aldrich | Cat# A4700 |
| MUC5AC | Thermo Fisher Scientific | Cat# 145P1 |
| Ki67 | BD Bioscience | Cat# 550609 |
| Phospho-Histone H 3 | Millipore | Cat# 06-570 |
| Cleaved Caspase 3 | Cell Signaling Technologies | Cat# 9664 |
| CK19 | Developmental Studies Hybridoma Bank | Cat# TromaIII |
| anti-Mouse HRP | Cell Signaling Technologies | Cat# 7076 |
| anti-Rabbit HRP | Cell Signaling Technologies | Cat# 7074 |
| eEF1AK55me1 | ABclonal Biotechnology | N/A |
| eEF1AK55me2 | ABclonal Biotechnology | N/A |
| eEF1AK55me3 | ABclonal Biotechnology | N/A |
| eEF1A | Millipore | Cat# 05-235 |
| β-tubulin | Millipore | Cat# 05-661 |
| puromycin | Millipore | Cat# MABE343 |
| METTL13 | Bethyl Laboratories | Cat# A304-194A |
| peroxidase-conjugated streptavidin | Jackson ImmunoResearch | Cat# 016-030-084 |
| eEF1A2 | Abnova | Cat# H00001917-A01 |
| eIF3A | Abcam | Cat# ab86146 |
| RPS6 | Abcam | Cat# ab70227 |
| RPL6 | Abcam | Cat# ab126100 |
| CD45-Biotin | eBiosciences | Cat# 13-0451-81 |
| CD31-Biotin | eBiosciences | Cat# 13-0319-80 |
| Ter119-Biotin | eBiosciences | Cat# 13-5921-81 |
| Biotin Micro Beads | Miltenyi Biotec | Cat# 130-042-401 |
| Bacterial and Virus Strains | ||
| One Shot TOP10 | Invitrogen | Cat# C404003 |
| Adenovirus-Cre | Baylor College of Medicine, Viral Vector Production Core | Cat# Ad5-CMV-Cre |
| DH5α | Thermo Fisher Scientific | Cat# K4520-1 |
| BL21 | Thermo Fisher Scientific | Cat# C6070-03 |
| Biological Samples | ||
| Human PDAC and LAC Tissue Array | MD Anderson Pathology | N/A |
| Chemicals, Peptides, and Recombinant Proteins | ||
| Geneticin | Thermo Fisher Scientific | Cat# 10131027 |
| Blasticidin S | Thermo Fisher Scientific | Cat# R21001 |
| Puromycin | Thermo Fisher Scientific | Cat# A1113802 |
| Hygromycin B | Corning | Cat# 30240CR |
| G418 Sulfate | Corning | Cat# MT30234CI |
| MACS separation columns | Miltenyi Biotech | Cat# 130-042-401 |
| Complete Protease Inhibitor Cocktail | Sigma-Aldrich | Cat# 4693159001 |
| Phosphatase Inhibitor Cocktail | Thermo Fisher Scientific | Cat# 78420 |
| Hydrogen Peroxide | Thermo Fisher Scientific | Cat# H325-500 |
| Sequencing Grade Modified Trypsin | Promega | Cat# V5113 |
| Glu-C | Promega | Cat# V1651 |
| Collagenase-VIII | Sigma-Aldrich | Cat# C2139 |
| TRIzol Reagent | Invitrogen | Cat# 15596018 |
| Forane (Isoflurane) | AbbVie | Cat#B506 |
| Caerulein | Sigma-Aldrich | Cat# C9026 |
| Soybean trypsin inhibitor | Sigma-Aldrich | Cat# T6522 |
| Rat Tail Collagen | Corning | Cat# 354236 |
| Recombinant mouse EGF | Thermo Fisher Scientific | Cat# PMG8044 |
| Bovine Serum Albumin (BSA) | Thermo Fisher Scientific | Cat# BP9703100 |
| TransIT-293 | Mirus Bio | Cat# MIR-2706 |
| SUPERase In RNase Inhibitor | Thermo Fisher Scientific | Cat# AM2694 |
| RNasin Ribonuclease Inhibitors | Promega | Cat# N2511 |
| GTP solution | Thermo Fisher Scientific | Cat# R1461 |
| L-lysine-2HCl | Thermo Fisher Scientific | Cat# 88429 |
| L-arginine-HCl | Thermo Fisher Scientific | Cat# 88427 |
| L-proline | Thermo Fisher Scientific | Cat# 88430 |
| 13C6, 15N2-L-lysine HCl | Silantes GmbH | Cat# 211604102 |
| 13C6,15N4-L-arginine HCl | Silantes GmbH | Cat# 201604102 |
| l-azidohomoalanine (AHA) | Click Chemistry Tools | Cat# 1066-100 |
| Biotin-PEG4-Alkyne | Click Chemistry Tools | Cat# TA105-25 |
| Peptides: AEMGKGSFXYAWVLDKLKGGK-biotin (X=Kme0, Kme1, Kme2, Kme3) | Chinapeptides | N/A |
| Critical Commercial Assays | ||
| RNeasy Mini Kit | Qiagen | Cat# 74106 |
| ZymoPURE Plasmid Miniprep Kit | Zymo | Cat# D4211 |
| ZymoPURE II Plasmid Maxiprep Kit | Zymo | Cat# D4203 |
| DAB Substrate Kit | Abcam | Cat# ab64238 |
| Vectastain ABC kit | Vector Laboratories | Cat# PK-6100 |
| BCA Protein Assay Kit | Pierce | Cat# 23227 |
| ECL Substrate | Amersham | Cat# RPN2106 |
| PCR Mycoplasma Test Kit I/C | PromoKine | Cat# PK-CA91-1096 |
| ATPase/GTPase Activity Assay Kit | Sigma | Cat# MAK113-1KT |
| Cell Proliferation ELISA BrdU (colorimetric) | Roche | Cat# 11647229001 |
| Coomassie Plus assay | Thermo Fisher Scientific | Cat# 23236 |
| InstantBlue Protein Stain | Expedeon | Cat# ISB1L |
| SilverQuest Silver Staining Kit | Thermo Fisher Scientific | Cat# LC6070 |
| Click Chemistry Reaction Buffer Kit | Click Chemistry Tools | Cat# 1001 |
| Site-directed mutagenesis kit | Agilent | Cat# 200523 |
| MACS LS column | Miltenyi Biotec | Cat# 130-042-401 |
| Experimental Models: Cell Lines | ||
| Human: 293T/17 cells | ATCC | Cat# CRL-11268 |
| U2OS | ATCC | Cat# HTB-96 |
| hTERT RPE-1 | ATCC | Cat# CRL-4000 |
| A549 | ATCC | Cat# CCL-185 |
| T3M4 | Riken | Cat# RCB1021 |
| PaTu8902 | DSMZ | Cat# ACC 179 |
| Colo-357 | ECACC | Cat# 94072245 |
| L3.3 | RRID | Cat# CVCL_8147 |
| NCI-H520 | ATCC | Cat# HTB-182 |
| NCI-H2170 | ATCC | Cat# CRL-5928 |
| HT1080 | ATCC | Cat# CCL-121 |
| IMR90 | ATCC | Cat# CCL-186 |
| Experimental Models: Organisms/Strains | ||
| Mouse: KrasLSL-G12D | The Jackson Laboratories | Strain# 008179 |
| Mouse: p53lox/lox | The Jackson Laboratories | Strain# 008462 |
| Mouse: Ptf1aCre | (Kawaguchi et al., 2002) | MGI# 2387812 |
| Mouse: Mettl13lox/lox | In this study | N/A |
| Mouse: NOD.SCID-IL2Rg−/− (NSG) | The Jackson Laboratories | Strain# 005557 |
| Oligonucleotides | ||
| sgRNA: Control: 5'-CTTCGAAATGTCCGTTCGGT-3' | This paper | N/A |
| sgRNA: METTL13-1: 5'-GGATGTGTCTCACAAAGGTG-3' | This paper | N/A |
| sgRNA: METTL13-2: 5'-CTGAAGGATGTGTCTCACAA-3' | This paper | N/A |
| sgRNA: eEF1A2: 5'-CTAGCCGCCACTCACGTTGG-3' | This paper | N/A |
| sgRNA: eEF1A1/2-1: 5'-ATTTGAGAAGGAGGCTGCTG-3' | This paper | N/A |
| sgRNA: eEF1A1/2-2: 5'-GTTCGAGAAGGAGGCGGCTG-3' | This paper | N/A |
| sgRNAs for KMT Library: Table S1 | This paper | N/A |
| Recombinant DNA | ||
| Plasmid: lentiCRISPRv2 | (Sanjana et al., 2014) | Addgene #52961 |
| Plasmid: lentiCRISPRv2 hygro | A gift from Brett Stringer | Addgene #98291 |
| Plasmid: psPAX2 | Trono Lab Packaging and Envelope Plasmids | Addgene #12260 |
| Plasmid: pMD2.G | Trono Lab Packaging and Envelope Plasmids | Addgene #12259 |
| Plasmid: pCMV-dR8.2 dvpr | (Stewart et al., 2003) | AddGene #8455 |
| Plasmid: pCMV-VSV-G | (Stewart et al., 2003) | Addgene #8454 |
| Plasmid: pUMVC | (Stewart et al., 2003) | Addgene #8449 |
| Plasmid: pBABE-neo | (Morgenstern and Land, 1990) | Addgene #1767 |
| Plasmid: pWZL Blast GFP | (Orimo et al., 2005) | Addgene #12269 |
| Plasmid: pGEX-6P-1 | GE Healthcare | Cat# 28-9546-48 |
| Plasmid: pcDNA3.1(+) | Thermo Fisher Scientific | Cat# V7020 |
| Plasmid: pENTR3C | Thermo Fisher Scientific | Cat# A10465 |
| Plasmid: pLenti6.2 V5-DEST | Thermo Fisher Scientific | Cat# V36820 |
| Software and Algorithms | ||
| Prism 7 | GraphPad | https://www.graphpad.com/; RRID:SCR_002798 |
| Excel for Mac 2016 | Microsoft | https://www.microsoft.com/en-us/; RRID:SCR_016137 |
| Leica Application Suite X (LAS X) | Leica | https://www.leica-microsystems.com/ RRID:SCR_013673 |
| ImageJ – Fiji package | Freeware | http://fiji.sc; RRID:SCR_002285 |
| Origin Pro 8 | Microcal | https://www.originlab.com/ RRID:SCR_002815 |
| Horos | GNU Lesser General Public License, Version 3.0 | https://www.horosproject.org/ |
| Other | ||
| RPMI 1640 Medium | Corning | Cat# MT10017CV |
| DMEM Medium | Corning | Cat# MT10040CV |
| McCoy’s Medium | Corning | Cat# MT10050CV |
| EMEM Medium | ATCC | Cat# 30-2003 |
| Waymouth's Medium | Thermo Fisher Scientific | Cat# 11220035 |
| Fetal bovine serum | Thermo Fisher Scientific | Cat# 10500056 |
| PBS | Corning | Cat# MT21031CV |
| Trypsin-EDTA 0.25% | Corning | Cat# MT25053CI |
| PVDF membrane (0.2 µm) | BioRad | Cat# 1620177 |
| PVDF membrane (0.45 µm) | Millipore | Cat# IPVH00010 |
| Insulin-Transferrin-Selenium | Thermo Fisher Scientific | Cat# 41400045 |
| Bovine Pituitary Extract (BPE) | Thermo Fisher Scientific | Cat# 13028014 |
| Ethanolamine | Sigma-Aldrich | Cat# E6133 |
| Nicotinamide | Sigma-Aldrich | Cat# N0636 |
Human Tumor Samples
Surgically resected tumor specimens were obtained from patients with histologically confirmed pancreatic cancer and non-small cell lung cancer blinded for age and gender. All surgically resected tumors were collected after written patient consent and in accordance with the institutional review board-approved protocols of the University of Texas M.D. Anderson Cancer Center (LAB07-0854, LAB10-0704). Information on gender and age were not associated with tumor samples and hence blinded.
METHOD DETAILS
Pancreatic Cancer Mouse Models
For pancreatic cancer initiation studies acute pancreatitis was induced at 6 to 8 weeks of age in Ptf1a+/Cre;Kras+/LSL-G12D (Kras) and Ptf1a+/Cre; Kras+/LSL-G12D; Mettl13loxP/loxP (Kras;Mettl13) mice by administration of 8 hourly intraperitoneal (IP) injections of caerulein (100 μg/kg body weight) over 2 consecutive days as described previously (Mazur et al., 2014). Pancreatic lesions were analyzed 10 d after the last injection. For survival studies, we used Ptf1a+/Cre;Kras+/LSL-G12D; Trp53loxP/loxP (Kras;p53) and Ptf1a+/Cre;Kras+/LSL-G12D;Trp53loxP/loxP; Mettl13loxP/loxP (Kras;p53;Mettl13) mice, which develop aggressive disease. Mice were followed for signs of disease progression. At the end of the experiment, tumors were processed for biochemical, histological and immunohistochemical analysis. Histopathological analysis was conducted on de-identified slides based on the classification consensus.
Lung Adenocarcinoma Mouse Models
To generate tumors sporadically in the lungs of Kras+/LSL-G12D and Kras+/LSL-G12D; Mettl13loxP/loxP mutant mice, we used replication-deficient adenoviruses expressing Cre-recombinase (Ad-Cre) to deliver transient Cre recombinase expression to infected cells of the lung, as previously described (Mazur et al., 2014). Briefly, 8 to 10-week old mice were anesthetized by continuous gaseous infusion of 2% isoflurane for at least 10 min using a veterinary anesthesia system (D19 Vaporizer, Vetland Medical). Ad-Cre was delivered to the lungs by intratracheal intubation. Prior to administration, Ad-Cre was precipitated with calcium phosphate to improve the delivery of Cre by increasing the efficiency of viral infection of the lung epithelium. Mice were treated with one dose of 5 × 10⁶ PFU of Ad-Cre (Baylor College of Medicine, Viral Vector Production Core). Mice were analyzed for tumor formation and progression at 16 weeks after infection.
Magnetic Resonance Imaging
Magnetic Resonance Imaging (MRI) experiments were performed on Kras;p53 and Kras;p53;Mettl13 mutant mice at an age of 7 weeks. Before imaging, mice were anesthetized by continuous gaseous infusion of 2% isoflurane for at least 10 min using a veterinary anesthesia system (D19 Vaporizer, Vetland Medical). During imaging, the dose was kept at 2% isoflurane, animal temperature was maintained and continuously monitored, respiratory and ECG monitoring were performed using an MRI-compatible physiological monitoring system (Small Animal Instruments, Inc) and eyes were protected with an eye ointment. MRI was performed using the Biospec USR70/30 (Bruker Biospin MRI, Billerica, MA) a small animal experimental MR imaging system based on an actively-shielded 7 T magnet with a 30 cm bore and cryo-refrigeration. The system is equipped with 6 cm inner-diameter gradients that deliver a maximum gradient field of 950 mT m–1. A 3.5 cm inner-diameter linear birdcage coil transmits and receives the MR signal. For image acquisition, T2-weighted, respiratory gated, multi-slice imaging will be performed with respiration held to under 25 breaths per minute to minimize motion artefacts in the abdomen. The rapid acquisition with relaxation enhancement (RARE) T2-weighted pulse sequence was modified to include an effective Te (time of echo) of 38 ms, echo train length 9.5 ms, and number of averages equal to 4 in both the coronal and axial planes with a total TR (time repetition) of 2000 ms. A three-orientation (axial, sagittal, and coronal) scout image using a fast, low-angle single shot sequence was obtained to localize the mouse pancreas. Between 18 and 20 coronal and axial slices were acquired per mouse with a slice thickness of 0.7 mm and slice spacing of 1 mm to cover the entire pancreas. In plane, pixel sizes of 0.156 mm × 0.156 mm with a matrix size of 256 × 192 and field of view (FOV) of 40 mm × 30 mm was chosen to minimize in plane partial volume effects, maintain a FOV sufficient to cover the abdomen, while also providing sufficient throughput for the experiment. MR images were analyzed using an open source Horos processing software. Pancreas tumor burden was measured by tracing the outer border of the region of suspected lesions on each slice after image intensities were normalized. Analysis was conducted on de-identified images. Tumor volume (V) was assessed, using three-dimensional volumetric measurements according to the modified Simpson rule. In all contiguous transverse images, the area of tumor (A) in each slice was multiplied by the slice profile (0.7 mm slice thickness plus 1 mm intersection gap), and total tumor volume was automatically calculated by summation of the adjacent volume according to the formula:
where Ts is the thickness of each slice, i is the individual slice number and n is the total number of slices.
Histology and Immunohistochemistry
Tissue specimens were fixed in 4% buffered formalin for 24 hours and stored in 70% ethanol until paraffin embedding. 3-μm sections were stained with hematoxylin and eosin (HE) or used for immunohistochemical studies. Human tissue sections were collected in accordance with the institutional review board-approved protocols of the University of Texas M.D. Anderson Cancer Center (LAB05-0854). Immunohistochemistry (IHC) was performed on formalin-fixed, paraffin embedded mouse and human tissue sections using a biotin-avidin method as described before (Mazur et al., 2014). The following antibodies were used (at the indicated dilutions): cleaved caspase 3 (1:200), Ki67 (1:1,000), MUC5AC (1:500), METTL13 (1:100) and eEF1AK55me2 (1:500). Sections were developed with DAB and counterstained with hematoxylin. Pictures were taken using a Leica microscope equipped with the LAX software. Analysis of the tumor area and IHC analysis was done using ImageJ software by measuring pixel units. Quantification of chromogen intensity was performed by measuring the reciprocal intensity of the chromogen stain. Briefly, standard RGB color images acquired from bright field microscopy have a maximum intensity of value 250 (represented by white, unstained areas) as measured by the standard intensity function in the open source Fiji software (ImageJ). We subtracted the intensity of a stained tissue sample from 250, thereby deriving a reciprocal intensity that is directly proportional to the amount of chromogen present.
Preparation of Pancreatic Epithelial Explants Culture
Pancreatic epithelial explants from 6-week old wild-type mice were established by modification of previously published protocols (Mazur et al., 2014). In brief, the whole pancreas was harvested and treated twice with 1.2 mg/ml Collagenase VIII. Following multiple wash steps with McCoy’s medium containing soybean trypsin inhibitor (SBTI, 0.2 mg/ml), digested samples were filtered through a 100 μm filter, resuspended in culture medium (Waymouth’s MB 752/1 supplemented with 0.1% BSA, 0.2 mg/ml SBTI; 50 μg/ml bovine pituitary extract, 10 μg/ml Insulin, 5 μg/ml transferrin, 6.7 ng/ml selenium in 30% fetal bovine serum) and allowed to recover for 1h at 37°C. Thereafter, cells were pelleted and resuspended in culture medium supplemented with penicillin G (1000 U/ml), streptomycin (100 μg/ml), amphotericin B, 0.1% fetal bovine serum, and an equal volume of rat tail collagen and immediately plated on plates pre-coated with 2.5 mg/ml of rat tail collagen type I. In stimulation experiments, recombinant mouse EGF was added to a final concentration of 25 ng/ml. For quantification, acinar explants were seeded in triplicate. Cell clusters were counted from at least 3 optical fields/well and reported as a percentage of acinar clusters and duct-like spheres. The quantification was performed in two independent experiments; the number of mice is reported in the main text.
Meta-analysis of Gene Expression
Meta-analysis of public PDAC and NSCLC data sets. We downloaded raw data for gene expression studies (7 pancreatic cancer, 6 NSCLC) from the NCBI GEO and EBI ArrayExpress. After re-annotating the probes, each data set was normalized separately using gcRMA. We applied two meta-analysis approaches to the normalized data. Briefly, the first approach combines effect sizes from each data set into a meta-effect size to estimate the amount of change in expression across all data sets. For each gene in each data set, an effect size was computed using Hedges’ adjusted g. If multiple probes mapped to a gene, the effect size for each gene was summarized using the fixed effect inverse-variance model. We combined study-specific effect sizes to obtain the pooled effect size and its standard error using the random effects inverse-variance technique. We computed z-statistics as a ratio of the pooled effect size to its standard error for each gene and compared the result to a standard normal distribution to obtain a nominal P-value. P-values were corrected for multiple hypotheses testing using false discovery rate (FDR). We used a second non-parametric meta-analysis that combines P-values from individual experiments to identify genes with a large effect size in all data sets. Briefly, we calculated a t-statistic for each gene in each study. After computing one-tail P-values for each gene, they were corrected for multiple hypotheses using FDR. Next, we used Fisher’s sum of logs method, which sums the logarithm of corrected P-values across all data sets for each gene and compares the sum against a chi-square distribution with 2k degrees of freedom, where k is the number of data sets used in the analysis.
Patient-derived Cancer Xenografts
Surgically resected tumor specimens were obtained from patients with histologically confirmed pancreatic cancer and non-small cell lung cancer blinded for age and gender. All surgically resected tumors were collected after written patient consent and in accordance with the institutional review board-approved protocols of the University of Texas M.D. Anderson Cancer Center (LAB07-0854, LAB10-0704). Patient-derived xenograft tumors were generated by transplanting small tumor fragments isolated directly from surgical specimens subcutaneously into mice. In each case we first propagated the sample in NSG mice. For reconstitution assays, collected PDX tumors were minced using a razor blade and digested in collagenase digestion buffer at 37°C for 1 hour. Cells were passed through 100 μm and 40 μm cell strainers and centrifuged for 1200 rpm for 8 min. Cells were incubated in RBC lysis buffer for 2 min and then resuspended in 6 mL of media and spun through 0.5mL of serum layered on the bottom of the tube to remove cellular debris. Contaminating human or mouse hematopoietic and endothelial cells (CD45, Ter119, CD31) are depleted using biotin conjugated anti-mouse CD45, CD31 and Ter119 antibodies and separated on a MACS LS column using anti biotin microbeads. The isolated cells are transiently cultured on several matrigel coated plates and infected with lentivirus carrying sgRNA Mettl13 (shMettl13) and cDNA of METTL13 WT, METTL13 catalytic dead mutant and briefly selected using appropriate antibiotics. Then cells were collected, mixed with matrigel (1:1) and transplanted to the flanks of NSG mice. When tumors became palpable, they were calipered every 3 days to monitor growth kinetics. Tumor volume was calculated using the formula: Volume = (width)2 × length / 2 where length represents the largest tumor diameter and width represents the perpendicular tumor diameter.
Transfection and Viral Transduction
Transient expression was performed using TransIT-293 (Mirus Bio) following the manufacturer’s protocol. For CRISPR/Cas9 knockouts, virus particles were produced by co-transfection of 293T cells with the lentiCRISPR v2 /hygro construct expressing indicated sgRNAs, pCMV-VSV-G and pCMV-dR8.2 dvpr in a ratio of 5:2:3 by mass. 48 hours after transfection, target cells were transduced with 0.45 μm filtered viral supernatant and 4 μg/mL polybrene. Cells were selected 24h after media replacement with 12.5 μg/mL puromycin for RPE-1 or 250 μg/mL hygromycin B for other cell lines. For METTL13 reconstitution, cells were transduced with retroviral pBABE or pWZL constructs using pUMVC and pCMV-VSV-G in a ratio of 2:1:1 by mass. The subsequent selection was carried out with 800 μg/mL G-418 for NCI-H2170, 2 mg/mL G-418 for T3M4, or 10 μg/mL blasticidin for 293T cells. For eEF1A2 reconstitution, T3M4 cells were transduced with pLenti6.2 plasmid, pCMV-dR8.2 dvpr and pCMV-VSV-G in a ratio of 5:3:2 by mass and selected with 20 μg/mL blasticidin.
Plasmids
Protein sequences were METTL13 (accession no. NP_057019.3), eEF1A1 (accession no. NP_001393.1), and eEF1A2 (accession no. NP_001949.1). Bacterial expression plasmids were created using pGEX-6P-1. Transient mammalian expression was conducted using pcDNA3.1(+). lentiCRISPRv2 was used for CRISPR/Cas9 knockouts in RPE-1 cells, while lentiCRISPRv2 hygro were used in all other cell lines. For stable expression in mammalian cells, METTL13 was cloned into pBABE-neo and pWZL Blast GFP. eEF1A2 was originally cloned into pENTR3C and then recombined into pLenti6.2 V5-DEST. The inserts were amplified by PCR using specific clones from the human ORFeome library as templates. Single point mutations of METTL13 and eEF1A2 were generated by site-directed mutagenesis.
CRISPR/Cas9 Knockout Library Screen
107 known and candidate lysine methyltransferases (KMTs) were identified based on literatrure analyses (e.g. (Clarke, 2013)). The top three sgRNAs targeting each putative KMT were taken from a previously published genome-wide human sgRNA library (Morgens et al., 2017) (Table S1). The control sgRNA, which shows no effect on growth in multiple cell lines, was designed to be at least 2 bases mismatched to anything in the human genome. A total of 322 KMT sgRNAs were cloned into the lentiCRISPR v2 vector. Lentivirus particles were produced as described above. U2OS cells in 6-well plates were infected with virus in 4 μg/mL polybrene for 2 days, then expanded into 10 cm plates for 3 days in puromycin at 2 μg/mL. Lysate from each plate was collected in 1 mL RIPA buffer (10 mM Tris-HCl pH 8, 150 mM NaCl, 1 mM EDTA, 0.5 mM EGTA, 1% Triton, 0.1% SDS) supplemented with protease inhibitor cocktail. For Western analysis, 40 μL of cell lysates were mixed with 10 μL of 5× SDS loading buffer and boiled for 5 min. 20 μL was resolved by SDS-PAGE, transferred to a PVDF membrane, and probed with the anti-eEF1AK55me2 antibody for screening. Tubulin was used as a loading control.
Immunoblot Analysis and Immunoprecipitation
For Western blot analysis, cells were lysed in RIPA buffer with 1 mM PMSF and protease inhibitor cocktail. Protein concentration was determined using the Pierce Coomassie Plus Assay. Protein samples were resolved by SDS-PAGE and transferred to a PVDF membrane (0.45 μm). Dot blot analysis was performed by directly loading 1 μL of the indicated amounts of biotinylated peptides onto a PVDF membrane (0.2 μm). The following antibodies were used (at the indicated dilutions): eEF1AK55me1 (1:3,000), eEF1AK55me2 (1:10,000), eEF1AK55me3 (1:5,000), eEF1A (1:5,000), beta-tubulin (1:5,000), puromycin (1:2,000), METTL13 (1:2,000), peroxidase-conjugated streptavidin (1:10,000), eIF3A (1:5,000), RPS6 (1:2,000), RPL6 (1:3,000), eEF1A2 (1:2,000). All secondary antibodies were used at 1:10,000 dilution. Protein bands were visualized using Amersham ECL or Amersham ECL Prime Western Blotting Detection Reagent.
For immunoprecipitation of endogenous eEF1A, equal amounts of whole cell extracts (WCEs) were incubated with anti-eEF1A at 4°C for overnight and then with protein G magnetic beads at 4°C for 2 hours. The beads were washed with cell lysis buffer at 4°C three times, boiled in Laemmli buffer, and then frozen until processed for MS analysis as described below.
Expression and Purification of Recombinant Proteins
GST fusion proteins were expressed in BL21 Escherichia coli by overnight culture at 2°C in LB medium (10 g/L tryptone, 5 g/L yeast extract, and 10 g/L NaCl) supplemented with 0.1 mM IPTG (isopropyl 1-thio- β-D-galactopyranoside, Sigma), purified using Glutathione Sepharose 4B (GE Healthcare) and eluted in 10 mM reduced glutathione (Sigma). Protein concentrations were measured using Pierce Coomassie Plus Assay. DTT was added to the protein solution at a final concentration of 20 mM. Recombinant human core histones were expressed and purified by ion-exchange chromatography. The histones were combined in equimolar ratio under denaturing conditions and dialyzed against high salt buffer to assemble octamers. Octamers were purified by gel filtration chromatography. Nucleosomes were subsequently assembled with the optimized 601 DNA sequence that was amplified with a 5’ biotinylated primer.
For purification of Flag-tagged eEF1A1, eEF1A1 bearing a C-terminal Flag tag was expressed by transient transfection in wild-type or METLL13-depleted 293T cells that were reconstituted with METTL13WT or METTL13G58R, respectively. After 48h transfection, eEF1A was isolated from whole cell extracts using anti-Flag M2 affinity gel (Sigma) according to the instructions of the manufacturer and eluted with 3×Flag peptides (Sigma). The resulting purified eEF1A1 was immediately used for enzymatic reactions.
Structural Modeling of METTL13 (1-400)
Structural modeling of the first 400 residues of METTL13 (METTL13 1-400) was performed using the I-TASSER software package. Based on the amino acid sequence of METTL131-400, the program identified structural templates from Protein Data Bank (https://www.rcsb.org/), which were then subject to template-based fragment assembly simulations to generate the structural model. The relative orientation of the two subdomains of METTL131-400, MTase and SBD, was manually arranged in a similar manner as that of the corresponding domains of PrmA (Demirci et al., 2007).
Polysome Profiling
Wild-type or METTL13-depleted T3M4 cells were seeded into six 15-cm Petri dishes (~10 × 106 cells per dish) 24 hours prior to serum starvation for 16h followed by replacement with fresh medium for 2h. Cells were treated with 100 μg/mL cycloheximide and incubated for 2 min at 37°C. Cells were washed and scraped in cold PBS containing 100 μg/mL cycloheximide, pelleted and lysed in lysis buffer (5 mM Tris pH7.4, 2.5 mM MgCl2, 1.5 mM KCl, 100 μg/mL cycloheximide, 2 μM DTT, 0.5% Triton, 0.5% Na-DOC, 100 U/mL SUPERase In RNase inhibitor and protease inhibitors). Lysates were cleared for 10 min at 14,000 rpm at 4°C. RNA contents were determined by Nanodrop and 500 μg of RNA were loaded on 10% to 50% sucrose gradients made in 15 mM Tris pH7.4, 15 mM MgCl2, 150 mM NaCl and prepared using a BioComp Gradient Station. Gradients were spun for 2 hours in a TH-641 rotor (Sorvall) at 40,000 rpm and 4°C. Gradients were analyzed (260 nm) and fractions collected with a BioComp Gradient Station.
Methylation and GTPase Assays
In vitro methylation assays were performed similar to as descrbied in (Mazur et al., 2014) by combining 3 μg of recombinant proteins or 1 μg of peptides and equal amounts of recombinant enzymes in a methyltransferase buffer (50 mM Tris pH 8.0, 20 mM KCl, 5 mM MgCl2, and 10% glycerol) supplemented with 1 mM S-adenosyl-methionine (SAM, New England Biolabs) or deuterated AdoMet (C/D/N Isotopes) or 2 μCi of tritiated AdoMet (American Radiolabeled Chemicals). The reaction mixtures were incubated overnight at 30°C. Reactions were resolved by SDS-PAGE, followed by autoradiography, Coomassie stain or mass spectrometry analysis.
For in vitro methylation assay on ribosomes, 40S and 60S ribosomal subunits and 80S ribosomes were isolated from cytoplasmic extract of T3M4 cells as described in Polysome Profiling. The eluting fractions were dialyzed twice in 2 L of 100 mM Tris, pH 8.0 (MCWO 3500) and then concentrated (MWCO 3000) by centrifugation at 14,000 × g. Methylation reactions were carried out in the methyltransferase buffer containing 3 μg of recombinant METTL13 (amino acids 1-498), 17.5 μL of concentrated ribosomes, and 1 mM S-adenosyl-methionine or 2 μCi of tritiated AdoMet at 30°C for overnight. The reactions were resolved by SDS-PAGE, followed by autoradiography, Coomassie stain or Western blot analysis.
GTPase assays were performed in triplicate using ATPase/GTPase Activity Assay Kit (Sigma) following the manufacturer’s protocol. Briefly, 3 μg of Flag-tagged eEF1A1K55me0/2 purified from 293T cells (as described above) were incubated with increasing amounts of GTP in 30 μL of the reaction buffer provided by the kit at 37μC for 3 hours. The reactions were terminated by adding 200 μL of the kit reagent and incubating for an additional 30 min at room temperature. For GTPase activation by aminoacyl-tRNA (aa-tRNA), the GTPase assays were performed using 3 μg of Flag-tagged eEF1A1K55me0/2, 500 μM GTP, 100 ng/pL total aa-tRNAs and 25-30 units RNasin ribonuclease inhibitors (Promega) in 30 μL of the reaction buffer. Isolation of total aa-tRNAs from 293T cells was performed at 4°C using phenol/chloroform extraction under acidic conditions. Formation of hydrolyzed free phosphate was measured at a wavelength of 620 nm, and absorbance was compared with a standard curve. The readings of background blank and negative control reactions were subtracted from the sample readings. The kinetic parameters were evaluated by fitting the data to the Michaelis-Menten equation in Origin Pro 8.
Mass Spectrometry (MS) of eEF1AK55 Methylation
Recombinant and immunoprecipitated eEF1A were separated by SDS-PAGE and stained using InstantBlue Protein Stain (Expedeon). Bands were cut and destained in 50% acetonitrile (ACN), 50% ammonium bicarbonate (NH4HCO3, 50mM) for 10 min twice. Gel pieces were incubated in 50 mM NH4HCO3 containing 10 mM DTT at 60’C for 30 min, followed by treatment with 25 mM iodoacetamide in 50 mM NH4HCO3 at room temperature for 45 min. In-gel digestion was performed using 100 ng/μL Glu-C in 50 mM phosphate buffer (pH 7.8) at 37’C or 10 ng/μL trypsin in 50 mM NH4HCO3 at room temperature for overnight. Two consecutive peptide extractions were processed with 5% formic acid, 49% water, and 50% ACN. The resulting peptides were dried by speedvac, desalted using C18 StageTips (Thermo Fisher Scientific), and analyzed on an Orbitrap Elite mass spectrometer. Methylation states of eEF1AK55 were manually inspected. Selected ion chromatograms for peptides spanning eEF1AK55 were extracted using Xcalibur Qual Browser (Thermo). The settings were as follows:
Peptide 49-61, m/z 501.255 (me0), 505.927 (me1), 510.599 (me2) and 515.271 (me3), 10 p.p.m
Peptide 49-61 (deuterated K55me), m/z 501.255 (me0), 506.933 (me1), 512.6115 (me2) and 518.290 (me3), 10 p.p.m
Peptide 52-62, m/z 664.356 (me1), 671.364 (me2) and 678.372 (me3), 10 p.p.m
Peptide 52-62 (deuterated K55me), m/z 665.865 (me1), 674.382 (me2) and 682.900 (me3), 10 p.p.m
Proteome-wide Labeling and Analysis of METTL13 Substrates
Wild-type and METTL13-depleted T3M4 cells were grown in SILAC media containing either normal amino acids (‘light’) or modified amino acids (‘heavy”) for two weeks and lysed in RIPA buffer with 1 mM PMSF and protease inhibitor cocktail. A 2-way experiment was performed – the ‘forward’ condition combining light WCE + METTL13 with heavy WCE - METTL13 and the ‘reverse’ condition combining heavy WCE + METTL13 with light WCE - METTL13 at a ratio of 1:1 by mass. 10 μg of the lysates of each pair were resolved by SDS-PAGE and stained using a SilverQuest Silver Staining Kit. Gel pieces were treated with DTT and iodoacetamide as described above. In-gel digestion was performed using 25 ng/μL trypsin followed by purification using C18 stage tips. To best extract the methylated peptides from the entire proteome, the resulting digestion products were analyzed on an Orbitrap Elite mass spectrometer and an Orbitrap Fusion mass spectrometer (Thermo Scientific). Data obtained from the two instruments were combined and processed using MaxQuant version 1.3.0.5 (Cox and Mann, 2008) and allowing as variable modifications – methionine oxidation; mono- and di-methylation of arginine; and mono-, di- and tri-methylation of lysine.
Cell Assays
For cell proliferation assays, cells were seeded at 2 × 10⁵ cells/mL in triplicate in 6-well plates. Cell counts were acquired by Countess II FL Automated Cell Counter (Thermo Fisher Scientific) at indicated days for 8-10 days. After each counting, the cells were maintained at a density between 2-4 × 10⁵ cells/mL. Trypan blue was used to stain non-viable cells. Cell numbers were expressed relative to 1 × 10⁵ cells/mL.
Bromodeoxyuridine (BrdU) incorporation assay were conducted fusing Cell Proliferation ELISA BrdU Kit. Cells were seeded in 96-well plates (1,000 cells/well for HT1080, PaTu8902; 2,000 cells/well for T3M4 and colo-357; and 4000 cells for IMR90) and treated with drug concentrations as indicated in the text or with a vehicle for 72h. Absorbance at 370 nm (corrected for absorbance at the reference wavelength of 492 nm) was measured using a microplate reader (Benchmark Plus microplate reader; Bio-Rad) according to a manufacturer’s instructions. Tests were performed in two biological replicates, each carried out in a triplicate. BrdU incorporation is expressed as a fraction of vehicle (DMSO) treated control. For viable cell counting, 1 × 10⁵ HT1080, PaTu8902, T3M4 and colo-357 cells and 2 × 10⁵ IMR90 cells were seeded in 6-well plates and treated with drug concentrations as indicated in the text or with a vehicle for 72h. Non-viable cells were excluded using Trypan blue staining. Tests were performed in two biological replicates, each carried out in a triplicate. Viable cell count is expressed as a fraction of vehicle (DMSO) treated control. Proliferation curves were generated and fitted using GraphPad [using log(inhibitor) vs response – Variable slope (four parameters)].
Translation Assays
For SUnSET assays (Schmidt et al., 2009), wild-type or METTL13-depleted T3M4 and NCI-H2170 cells were seeded at 2-4 × 10⁵ cells/mL in 6-well plates 24 hours prior to serum starvation. For serum stimulation, cells were maintained in regular media containing 10% fetal bovine serum for an optimized period (2 hours for T3M4 and 1 h for NCI-H2170). Puromycin pulses were performed by incubating the cells with 10 μg/mL puromycin for 15 min at 37°C. Cells were then washed with cold PBS and lysed in RIPA buffer supplemented with 1 mM PMSF and protease inhibitor mixture. 5-10 μg of the whole cell lysate were assayed by Western blot analysis using the anti-puromycin antibody.
For labeling newly synthesized proteins, T3M4 cells were maintained in DMEM free of cysteine and methionine for 1h, then grown in DMEM containing 100 μg/mL methionine or AHA (l-azidohomoalanine) for 2 hours. T3M4 cells under serum starvation were cultured in DMEM free of cysteine and methionine for 1h, then grown for 2h in DMEM containing 10% fetal bovine serum and 100 μg/mL methionine or AHA. Cells were then harvested, washed with PBS on ice and lysed in RIPA buffer. Click reactions were performed using Click Chemistry Reaction Buffer Kit (Click Chemistry Tools) following the manufacturer’s protocol. Briefly, 50-100 μg of whole cell lysates were incubated with 40 μM Biotin-PEG4-Alkyne for 30 min. The proteins were extracted with methanol and chloroform and 1-5 μg were assayed by Western blot analysis using streptavidin-conjugated horseradish peroxidase.
QUANTIFICATION AND STATISTICAL ANALYSIS
Please refer to the Figure Legends or the Experimental Details for description of sample size (n) and statistical details. All values for n are for individual mice or individual sample. Sample sizes were chosen based on previous experience with given experiments. Cell culture assays have been performed in triplicates and in two independent experiments, unless stated otherwise. Data are expressed as mean ± SEM. Differences were analyzed by Spearman's rank correlation, log-rank, two-tailed Student’s t test, Mann-Whitney U test, one-way ANOVA (using Bonferroni post test), one-sample t test or c2-test using Prism 7 (GraphPad), P-values ≤ 0.05 were considered significant.
Supplementary Material
Figure S1. Identification of METTL13 as a Candidate eEF1A Lysine 55 Methyltransferase. Related to Figure 1
(A) eEF1AK55 dimethylation is the predominant species in multiple human cell lines. Selected ion chromatograms for non-, mono-, di- and trimethyl eEF1AK55 peptides from GluC digestion of endogenous eEF1A immunoprecipitated from the indicated whole cell lysates (WCEs). HPLC elution profiles show a 10-ppm mass window around expected peptide masses (peptide sequence MGKGSFKYAWVLD, K55 is underlined; m/z are 501.255, 505.927, 510.599 and 515.271). Red arrows indicate elution peaks of non-, mono- and dimethylated eEF1AK55 peptides in the profiles.
(B) Representative tandem mass spectra identifying mono- (top) and di- (bottom) methylation of endogenous eEF1AK55 immunoprecipitated from WCEs as shown in (A) and followed by trypsin digestion. m/z for b and y ions observed in spectra were indicated in blue and red, respectively.
(C) Specific recognition of eEF1AK55me by the anti-eEF1AK55me antibodies. Dot blot analysis with state-specific eEF1AK55me1-3 antibodies using the indicated biotinylated peptides. Blots probed with HRP-conjugated streptavidin (strep-HRP) as loading controls.
(D) Specificity of the anti-eEF1AK55me2 antibody in dot blot assays using biotinylated eEF1AK55me2 peptides and 19 different peptides from the indicated proteins that harbor a dimethyl lysine. Blots probed with strep-HRP as loading controls.
(E) Control small guide RNA (sgRNA) for CRISPR-based screen (Figure 1D). Western analysis with the indicated antibodies of WCEs from U2OS cells expressing the control sgRNA from the 322 sgRNA KMT library and seven randomly selected sgRNAs targeting the potential KMTs in the human genome. None of these sgRNAs reduced eEF1AK55me2 levels.
(F) Identification of METTL13 as a candidate eEF1AK55 di-methyltransferase. Western analyses with eEF1AK55me2 and tubulin antibodies of the 322 individual U2OS WCEs. Each cell line expresses CRISPR/Cas9 and one of the 322 sgRNAs. There are three independent sgRNAs targeting 107 known and candidate KMTs in the human genome. For each indicated KMT, eEF1AK55me2 and tubulin protein levels are shown in top and bottom panels, respectively and the data is organized alphabetically.
Table S3. List of Compounds used in Cell Growth Inhibition Screen; Related to Figure 7
Figure S2. METTL13 Methylates eEFlAK55 In Vitro, Related to Figure 2
(A) METTL13 methylates eEF1A1/2 at K55 in vitro. Selected ion chromatograms for non-, mono-, di- and tri-methyl eEF1A1/2-K55 peptides from GluC digestion after in vitro methylation with recombinant METTL13 using deuterated SAM as a methyl donor. HPLC elution profiles show a 10-ppm mass window around expected peptide masses (peptide sequence MGKGSFKYAWVLD, K55 is underlined; m/z are 501.255, 506.933, 512.6115 and 518.290). Red arrows indicate elution peaks of non-, mono- and dimethylated eEF1AK55 peptides in the profiles.
(B) Representative tandem mass spectra identifying in vitro mono- (top) and di- (bottom) methylation of eEF1AK55 by recombinant METTL13 using deuterated SAM and digested with trypsin. m/z for b and y ions observed in spectra were indicated in blue and red, respectively.
(C) Structural model of METTL131-400, with the MTase domain colored in light pink and the SBD domain colored in light blue. The co-factor byproduct S-Adenosyl-L-homocysteine (SAH) bound to the MTase domain is shown in sphere representation. The MTase and SBD domains are juxtaposed in a random orientation, with the linker sequence depicted as a dark dashed line. The SAH-interacting residues are shown in stick representation in the expanded view. The putative hydrogen bonds are shown as red dashed lines.
(D) Identification of point mutations that abrogate METTL13 enzymatic activity. In vitro methylation assay on recombinant GST-eEF1A1 with recombinant wild-type METTL13 or the indicated METTL13 single point mutations. Top panel, schematic diagram showing two putative methyltransferase (MT) domains of METTL13 and mutated residues in the MT1 domain. Underlined are signature motifs conserved in METTL13 with other 7βS members with known lysine methylation activity. Middle panel, autoradiogram of methylation assay. Bottom panel, Coomassie stain of proteins in the reaction. Asterisk indicates METTL13 breakdown product.
Figure S3. METTL13 Specifically Methylates eEF1AK55 In Cells, Related to Figure 3
(A) METTL13 is required for dimethylation of eEF1AK55 in human cell lines. Mass spectrometry-based quantification of eEF1AK55 methylation levels in the indicated cell lines expressing two independent sgRNAs targeting METTL13 and compared to the levels of sgRNA control cells.
(B) Western analysis with the indicated antibodies of in vitro methylation reactions on recombinant GST-eEF1A1, 40S, 60S and 80S ribosomes purified from T3M4 cells with recombinant METTL13WT or METTL13G58R. Input represents cytoplasmic extracts from T3M4 cells used for the isolation of 40S, 60S and 80S. Importantly, no eEF1A signal was detected in purified 40S, 60S and 80S fractions.
(C) Mass spectrometry analysis reveals no METTL13 methylation activity on unmodified eEF1AK55 peptide. Selected ion chromatograms for non-, mono-, di- and tri-methyl eEF1AK55 peptides after in vitro methylation on synthesized unmodified eEF1AK55 peptides (aa 45-65) with recombinant METTL13. HPLC elution profiles show a 10-ppm mass window around expected peptide masses (peptide sequence EAAEMGKGSFKYAWVLDKLKA, K55 is underlined; m/z are 635.590, 639.094, 642.598 and 646.102). Red arrows indicate elution peaks of non-methylated eEF1AK55 peptide in the profiles.
Figure S4. METTL13 and eEFlAK55me2 are Highly Expressed in Pancreatic and Lung Cancers and Promote Cancer Cell Proliferation, Related to Figure 4
(A) Summary of METTL13 expression levels in six publicly available expression data sets of PDAC (n=294 tumors and n=141 normal tissue independent samples). Detailed statistical description in the Methods section.
(B) orrelation of METTL13 mRNA expression levels and overall pancreatic cancer survival. Hazard ratio with 95% confidence intervals and log rank P-value are calculated. Data from GEO, EGA and TCGA.
(C) Differential epithelial expression levels of METTL13 and eEF1AK55me2 in human PDAC samples as assessed by immunohistochemistry (72 different samples were stained in total, the representative staining presented). Scale bars: 100 μm.
(D) Summary of METTL13 expression levels in six publicly available expression data sets of LAC (n=319 tumors and n=147 normal tissue independent samples). Detailed statistical description in the Methods section.
(E) Analysis of correlation of eEF1AK55me2 staining and LAC patient survival assessed by immunohistochemistry. ***P < 0.001, log-rank test, 96 different samples were stained in total, the representative staining presented. Scale bars: 100 μm.
(F) Differential epithelial expression levels of METTL13 and eEF1AK55me2 in human LAC samples as assessed by immunohistochemistry (96 different samples were stained in total, the representative staining presented). Scale bars: 100 μm.
(G) Cell proliferation rates of human lung cancer cell lines (NCI-H2170 and NCI-H520), human osteosarcoma cell line (U2OS), human fibrosarcoma cell line (HT1080) and human pancreatic cancer cell lines (PaTu8902 and colo357) expressing CRISPR/Cas9 and two independent METTL13 sgRNAs or a control sgRNA. Top panel, Westerns with indicated antibodies of WCEs from wild-type or METTL13 deficient cell lines as indicated. Error bars represent S.D. from three independent experiments. *P < 0.05, **P < 0.01, ***P < 0.001, two-tailed unpaired Student’s t-test.
Figure S5. Methylation Regulates eEF1A GTPase activity and mRNA Translation in Cells, Related to Figure 5
(A) Coomassie stain of purified Flag tagged eEF1A1K55me2 and eEF1A1K44me0 protein.
(B) In vitro GTP hydrolysis by dimethylated or unmethylated Flag-eEF1A1. Flag-eEF1A1 ± K55me2 purified from (A) was incubated with increasing amounts of GTP at 37 °C for 3h. Error bars represent S.D. from three independent reactions. Kinetic parameters were obtained by fitting the Michaelis-Menten equation to the plot of velocity of phosphate formation against GTP concentration.
(C) The effect of K55 dimethylation on the GTPase activity of Flag-eEF1A1 is independent of aminoacyl-tRNAs (aa-tRNAs). Flag-eEF1A1 ± K55me2 purified as in (A) was incubated with 500 μM GTP in reaction buffer at 37 °C for 3h in the absence or presence of aa-tRNAs. The y axis shows velocity of phosphate formation. Error bars represent S.D. from three independent reactions.
(D) Cytosolic extracts were isolated from control or METTL13-depleted T3M4 cells (replicate of Figure 5C) and fractionated on 5-50% sucrose gradients. Absorbance profiles show distribution of 40 and 60S ribosomal subunits, 80S monosome and polysomes. OD260nm, optical density at 260 nm. Left panel, Western analysis represents WCEs from the indicated cell lines used for the polysome profiling.
(E) METTL13 depletion does not impact protein synthesis in non-transformed RPE-1 cells. SUnSET assays as in Figure 5D show no difference in protein production in RPE-1 cells with or without METTL13. After being pulsed with 10 μg/mL puromycin for 15 min at the indicated conditions, WCEs were isolated and probed with the indicated antibodies.
(F) Requirement for eEF1AK55 for serum-stimulated protein synthesis in cells. SUnSET assays after recovery from serum starvation as in Figure 5D with control (sgControl plus vector control) or eEF1A-depleted T3M4 cells complemented with CRISPR-resistant eEF1A2WT, eEF1A2K55R or control as indicated. WCEs were isolated and probed with the indicated antibodies.
Figure S6. METTL13 Deletion Represses KRAS-driven Pancreatic and Lung Tumorigenesis In Vivo, Related to Figure 6
(A) Schematic of the Mettl13 conditional allele. In the presence of Cre recombinase, exon 3 is deleted to disrupt Mettl13 expression.
(B) Deletion of Mettl13 exon 3 of the conditional allele (Figure S6A) determined by PCR.
(C) METTL13 depletion inhibits ADM. Wild-type (WT, Ptf1aCre/+) acinar clusters (asterisk) undergo ADM and form ducts (arrowhead) ex vivo, whereas Ptf1aCre/+;Mettl13 mutant (Mettl13) acini explants inefficiently form ducts.
(D) Quantification of acinar and ductal clusters from Figure S6C. ***P < 0.001, n.s. not significant, two-tailed unpaired Student’s t-test, four independent biological replicas with three technical replicas each. Data are represented as mean ± s.e.m.
(E) Mettl13 expression by quantitative PCR with reverse transcription (qRT–PCR) analysis at the indicated times from control- and EGF-induced ADM ex vivo samples, four independent biological replicas as in Figure S6C.
(F) Immunohistochemical analysis of tumors that emerged in Kras;Mettl13 LAC model reveals that tumors retained METTL13 expression suggesting incomplete bi-allelic Cre recombination in these clonal growths. Representative staining presented. Scale bars: 1000 μm, insets magnification x10.
Figure S7. Depletion of METTL13’s Catalytic Activity Inhibits Growth of Pancreatic and Lung Cancer PDX Tumors in vivo and Regression of PDX Tumors by the Combination of METTL13 Depletion and Treatment with PI3K/mTOR Inhibitors, Related to Figure 7
(A) Tumor volume quantification for patient derived PDAC xenografts modified to express sgRNA METTL13 or sgRNA control and overexpressing wildtype METTL13wt or catalytically deficient METTL13G58R in mice (n = 8 mice for each treatment group). ***P < 0.001, two-tailed unpaired Student’s t-test. Data are represented as mean ± s.e.m. Immunoblots with the indicated antibodies of the PDX biopsies (one representative sample for each condition is shown).
(B) Tumor volume quantification for patient derived LAC xenografts modified to express sgRNA METTL13 or sgRNA control and overexpressing wildtype METTL13WT or catalytically deficient METTL13G58R in mice (n = 8 mice for each treatment group). ***P < 0.001, two-tailed unpaired Student’s t-test. Data are represented as mean ± s.e.m. Immunoblots with the indicated antibodies of the PDX biopsies (one representative sample for each condition is shown).
(C and D) Tumor volume quantification for patient derived (D) PDAC and (E) LAC xenografts modified to express sgRNA METTL13 or sgRNA Control (see Fig. S7A and S7B) treated with placebo (vehicle) or Omipalisib. Plots showing fold change in tumor volume compared to initial tumor volume. ***P < 0.001, n.s., not significant, two-tailed unpaired Student’s t-test. Data are represented as mean ± s.e.m. Treatment schedule as in Figure 7E.
(E) Model of the role of METTL13 and eEF1A methylation in enhancing protein synthesis to fuel growth signal-driven tumorigenesis.
(F and G) IMR90 (non-transformed), and the Ras positive HT1080, PaTu8902, T3M4 and colo357 cell lines were treated as indicated with SDS-1-021 for 72h. (F) Proliferation was determined by BrdU incorporation and expressed as a fraction of the inhibition of BrdU incorporation relative to control (vehicle-treated) cells. Results are presented as mean values ± SD (n = 3). (G) Viable cell count was measured by Trypan blue exclusion and expressed as a fraction of control (vehicle-treated) cells. Results are presented as mean values ± SD (n = 3). *p<0.05, **P < 0.01, two-tailed unpaired Student’s t-test.
Table S1. List of sgRNAs used in Gene-Editing Coupled Biochemical Screen; Related to Figure 1
Table S2. List of Methylated Peptides Detected in SILAC-based Quantitative Proteomic Analysis; Related to Figure 3
ACKNOWLEDGEMENTS
We thank Pål Falnes, Jerry Pelletier and Julien Sage for helpful discussion, Lauren Brown and William Devine for SDS-1-021, and members of the Gozani and Mazur laboratories for critical reading of the manuscript. This work was supported in part by grants from the NIH to S.M.C. (K99CA190803), M.P.K (5K08CA218690-02), J.A.P. (R35GM118173), M.C.B. (1DP2HD084069-01), J.S. (1R35GM119721), I.T. (R01CA202021), P.K.M. (R00CA197816, P50CA070907, and P30CA016672), and O.G. (R01GM079641). J.E.E. received support from Stanford ChEM-H and A.M. support by the MD Anderson Moonshot Program. I.T. is a Junior 2 Research Scholar of the Fonds de Recherche du Québec - Santé (FRQ-S). P.K.M. is supported by the Neuroendocrine Tumor Research Foundation, American Association for Cancer Research, and is the Andrew Sabin Family Foundation Scientist and CPRIT Scholar (RR160078). S.H. is supported by a Deutsche Forschungsgemeinschaft Postdoctoral Fellowship. J.W.F. is supported by 5T32GM007276.
Footnotes
DECLARATION OF INTERESTS
O.G. is a co-founder of Epicypher, Inc. and Athelas Therapeutics, Inc.
Publisher's Disclaimer: This is a PDF file of an unedited manuscript that has been accepted for publication. As a service to our customers we are providing this early version of the manuscript. The manuscript will undergo copyediting, typesetting, and review of the resulting proof before it is published in its final citable form. Please note that during the production process errors may be discovered which could affect the content, and all legal disclaimers that apply to the journal pertain.
REFERENCES:
- Abbas W, Kumar A, and Herbein G (2015). The eEF1A Proteins: At the Crossroads of Oncogenesis, Apoptosis, and Viral Infections. Front Oncol 5, 75. [DOI] [PMC free article] [PubMed] [Google Scholar]
- Bardeesy N, Aguirre AJ, Chu GC, Cheng KH, Lopez LV, Hezel AF, Feng B, Brennan C, Weissleder R, Mahmood U, et al. (2006). Both p16(Ink4a) and the p19(Arf)-p53 pathway constrain progression of pancreatic adenocarcinoma in the mouse. Proceedings of the National Academy of Sciences of the United States of America 103, 5947–5952. [DOI] [PMC free article] [PubMed] [Google Scholar]
- Bhat M, Robichaud N, Hulea L, Sonenberg N, Pelletier J, and Topisirovic I (2015). Targeting the translation machinery in cancer. Nat Rev Drug Discov 14, 261–278. [DOI] [PubMed] [Google Scholar]
- Brooks RF (1977). Continuous protein synthesis is required to maintain the probability of entry into S phase. Cell 12, 311–317. [DOI] [PubMed] [Google Scholar]
- Cancer Genome Atlas Research, N. (2014). Comprehensive molecular profiling of lung adenocarcinoma. Nature 511, 543–550. [DOI] [PMC free article] [PubMed] [Google Scholar]
- Carlson SM, and Gozani O (2016). Nonhistone Lysine Methylation in the Regulation of Cancer Pathways. Cold Spring Harb Perspect Med 6. [DOI] [PMC free article] [PubMed] [Google Scholar]
- Cavallius J, and Merrick WC (1998). Site-directed mutagenesis of yeast eEF1A. Viable mutants with altered nucleotide specificity. J Biol Chem 273, 28752–28758. [DOI] [PubMed] [Google Scholar]
- Chi P, Allis CD, and Wang GG (2010). Covalent histone modifications--miswritten, misinterpreted and mis-erased in human cancers. Nat Rev Cancer 10, 457–469. [DOI] [PMC free article] [PubMed] [Google Scholar]
- Chio IIC, Jafarnejad SM, Ponz-Sarvise M, Park Y, Rivera K, Palm W, Wilson J, Sangar V, Hao Y, Ohlund D, et al. (2016). NRF2 Promotes Tumor Maintenance by Modulating mRNA Translation in Pancreatic Cancer. Cell 166, 963–976. [DOI] [PMC free article] [PubMed] [Google Scholar]
- Chu J, Cencic R, Wang W, Porco JA Jr., and Pelletier J (2016). Translation Inhibition by Rocaglates Is Independent of eIF4E Phosphorylation Status. Mol Cancer Ther 15, 136–141. [DOI] [PMC free article] [PubMed] [Google Scholar]
- Clarke SG (2013). Protein methylation at the surface and buried deep: thinking outside the histone box. Trends Biochem Sci 38, 243–252. [DOI] [PMC free article] [PubMed] [Google Scholar]
- Cox J, and Mann M (2008). MaxQuant enables high peptide identification rates, individualized p.p.b.-range mass accuracies and proteome-wide protein quantification. Nat Biotechnol 26, 1367–1372. [DOI] [PubMed] [Google Scholar]
- Crawford HC, Scoggins CR, Washington MK, Matrisian LM, and Leach SD (2002). Matrix metalloproteinase-7 is expressed by pancreatic cancer precursors and regulates acinar-to-ductal metaplasia in exocrine pancreas. J Clin Invest 109, 1437–1444. [DOI] [PMC free article] [PubMed] [Google Scholar]
- Demirci H, Gregory ST, Dahlberg AE, and Jogl G (2007). Recognition of ribosomal protein L11 by the protein trimethyltransferase PrmA. EMBO J 26, 567–577. [DOI] [PMC free article] [PubMed] [Google Scholar]
- Faller WJ, Jackson TJ, Knight JR, Ridgway RA, Jamieson T, Karim SA, Jones C, Radulescu S, Huels DJ, Myant KB, et al. (2015). mTORC1-mediated translational elongation limits intestinal tumour initiation and growth. Nature 517, 497–500. [DOI] [PMC free article] [PubMed] [Google Scholar]
- Gandin V, Gutierrez GJ, Brill LM, Varsano T, Feng Y, Aza-Blanc P, Au Q, McLaughlan S, Ferreira TA, Alain T, et al. (2013). Degradation of newly synthesized polypeptides by ribosome-associated RACK1/c-Jun N-terminal kinase/eukaryotic elongation factor 1A2 complex. Molecular and cellular biology 33, 2510–2526. [DOI] [PMC free article] [PubMed] [Google Scholar]
- Gandin V, Sikstrom K, Alain T, Morita M, McLaughlan S, Larsson O, and Topisirovic I (2014). Polysome fractionation and analysis of mammalian translatomes on a genome-wide scale. J Vis Exp. [DOI] [PMC free article] [PubMed] [Google Scholar]
- Guerra C, Mijimolle N, Dhawahir A, Dubus P, Barradas M, Serrano M, Campuzano V, and Barbacid M (2003). Tumor induction by an endogenous K-ras oncogene is highly dependent on cellular context. Cancer Cell 4, 111–120. [DOI] [PubMed] [Google Scholar]
- Hamey JJ, and Wilkins MR (2018). Methylation of Elongation Factor 1A: Where, Who, and Why? Trends Biochem Sci 43, 211–223. [DOI] [PubMed] [Google Scholar]
- Hingorani SR, Petricoin EF, Maitra A, Rajapakse V, King C, Jacobetz MA, Ross S, Conrads TP, Veenstra TD, Hitt BA, et al. (2003). Preinvasive and invasive ductal pancreatic cancer and its early detection in the mouse. Cancer Cell 4, 437–450. [DOI] [PubMed] [Google Scholar]
- Infante JR, Somer BG, Park JO, Li CP, Scheulen ME, Kasubhai SM, Oh DY, Liu Y, Redhu S, Steplewski K, et al. (2014). A randomised, double-blind, placebo-controlled trial of trametinib, an oral MEK inhibitor, in combination with gemcitabine for patients with untreated metastatic adenocarcinoma of the pancreas. Eur J Cancer 50, 2072–2081. [DOI] [PubMed] [Google Scholar]
- Iwasaki S, and Ingolia NT (2017). The Growing Toolbox for Protein Synthesis Studies. Trends Biochem Sci 42, 612–624. [DOI] [PMC free article] [PubMed] [Google Scholar]
- Jackson EL, Willis N, Mercer K, Bronson RT, Crowley D, Montoya R, Jacks T, and Tuveson DA (2001). Analysis of lung tumor initiation and progression using conditional expression of oncogenic K-ras. Genes Dev 15, 3243–3248. [DOI] [PMC free article] [PubMed] [Google Scholar]
- Jakobsson ME, Malecki J, and Falnes PO (2018a). Regulation of eukaryotic elongation factor 1 alpha (eEF1A) by dynamic lysine methylation. RNA Biol 15, 314–319. [DOI] [PMC free article] [PubMed] [Google Scholar]
- Jakobsson ME, Malecki JM, Halabelian L, Nilges BS, Pinto R, Kudithipudi S, Munk S Davydova E, Zuhairi FR, Arrowsmith CH, et al. (2018b). The dual methyltransferase METTL13 targets N terminus and Lys55 of eEF1A and modulates codon-specific translation rates. Nat Commun 9, 3411. [DOI] [PMC free article] [PubMed] [Google Scholar]
- Johnson L, Mercer K, Greenbaum D, Bronson RT, Crowley D, Tuveson DA, and Jacks T (2001). Somatic activation of the K-ras oncogene causes early onset lung cancer in mice. Nature 410, 1111–1116. [DOI] [PubMed] [Google Scholar]
- Kanda M, Matthaei H, Wu J, Hong SM, Yu J, Borges M, Hruban RH, Maitra A, Kinzler K, Vogelstein B, et al. (2012). Presence of somatic mutations in most early-stage pancreatic intraepithelial neoplasia. Gastroenterology 142, 730–733 e739. [DOI] [PMC free article] [PubMed] [Google Scholar]
- Kawaguchi Y, Cooper B, Gannon M, Ray M, MacDonald RJ, and Wright CV (2002). The role of the transcriptional regulator Ptf1a in converting intestinal to pancreatic progenitors. Nat Genet 32, 128–134. [DOI] [PubMed] [Google Scholar]
- Lee KE, and Bar-Sagi D (2010). Oncogenic KRas suppresses inflammation-associated senescence of pancreatic ductal cells. Cancer Cell 18, 448–458. [DOI] [PMC free article] [PubMed] [Google Scholar]
- Lee MH, and Surh YJ (2009). eEF1A2 as a putative oncogene. Ann N Y Acad Sci 1171, 87–93. [DOI] [PubMed] [Google Scholar]
- Leprivier G, Remke M, Rotblat B, Dubuc A, Mateo AR, Kool M, Agnihotri S, El-Naggar A, Yu B, Somasekharan SP, et al. (2013). The eEF2 kinase confers resistance to nutrient deprivation by blocking translation elongation. Cell 153, 1064–1079. [DOI] [PMC free article] [PubMed] [Google Scholar]
- Liu M, Sjogren AK, Karlsson C, Ibrahim MX, Andersson KM, Olofsson FJ, Wahlstrom AM, Dalin M, Yu H, Chen Z, et al. (2010). Targeting the protein prenyltransferases efficiently reduces tumor development in mice with K-RAS-induced lung cancer. Proceedings of the National Academy of Sciences of the United States of America 107, 6471–6476. [DOI] [PMC free article] [PubMed] [Google Scholar]
- Martineau Y, Azar R, Muller D, Lasfargues C, El Khawand S, Anesia R, Pelletier J, Bousquet C, and Pyronnet S (2014). Pancreatic tumours escape from translational control through 4E-BP1 loss. Oncogene 33, 1367–1374. [DOI] [PubMed] [Google Scholar]
- Mazur PK, Herner A, Mello SS, Wirth M, Hausmann S, Sanchez-Rivera FJ, Lofgren SM, Kuschma T, Hahn SA, Vangala D, et al. (2015). Combined inhibition of BET family proteins and histone deacetylases as a potential epigenetics-based therapy for pancreatic ductal adenocarcinoma. Nat Med 21, 1163–1171. [DOI] [PMC free article] [PubMed] [Google Scholar]
- Mazur PK, Reynoird N, Khatri P, Jansen PW, Wilkinson AW, Liu S, Barbash O, Van Aller GS, Huddleston M, Dhanak D, et al. (2014). SMYD3 links lysine methylation of MAP3K2 to Ras-driven cancer. Nature 510, 283–287. [DOI] [PMC free article] [PubMed] [Google Scholar]
- Morgens DW, Wainberg M, Boyle EA, Ursu O, Araya CL, Tsui CK, Haney MS, Hess GT, Han K, Jeng EE, et al. (2017). Genome-scale measurement of off-target activity using Cas9 toxicity in high-throughput screens. Nat Commun 8, 15178. [DOI] [PMC free article] [PubMed] [Google Scholar]
- Morgenstern JP, and Land H (1990). Advanced mammalian gene transfer: high titre retroviral vectors with multiple drug selection markers and a complementary helper-free packaging cell line. Nucleic Acids Res 18, 3587–3596. [DOI] [PMC free article] [PubMed] [Google Scholar]
- Morris J.P.t., Cano DA, Sekine S, Wang SC, and Hebrok M (2010). Beta-catenin blocks Kras-dependent reprogramming of acini into pancreatic cancer precursor lesions in mice. J Clin Invest 120, 508–520. [DOI] [PMC free article] [PubMed] [Google Scholar]
- Murn J, and Shi Y (2017). The winding path of protein methylation research: milestones and new frontiers. Nat Rev Mol Cell Biol 18, 517–527. [DOI] [PubMed] [Google Scholar]
- Orimo A, Gupta PB, Sgroi DC, Arenzana-Seisdedos F, Delaunay T, Naeem R, Carey VJ, Richardson AL, and Weinberg RA (2005). Stromal fibroblasts present in invasive human breast carcinomas promote tumor growth and angiogenesis through elevated SDF-1/CXCL12 secretion. Cell 121, 335–348. [DOI] [PubMed] [Google Scholar]
- Robichaud N, Sonenberg N, Ruggero D, and Schneider RJ (2018). Translational Control in Cancer. Cold Spring Harb Perspect Biol. [DOI] [PMC free article] [PubMed] [Google Scholar]
- Ruggero D, Montanaro L, Ma L, Xu W, Londei P, Cordon-Cardo C, and Pandolfi PP (2004). The translation factor eIF-4E promotes tumor formation and cooperates with c-Myc in lymphomagenesis. Nat Med 10, 484–486. [DOI] [PubMed] [Google Scholar]
- Sanjana NE, Shalem O, and Zhang F (2014). Improved vectors and genome-wide libraries for CRISPR screening. Nat Methods 11, 783–784. [DOI] [PMC free article] [PubMed] [Google Scholar]
- Schmidt EK, Clavarino G, Ceppi M, and Pierre P (2009). SUnSET, a nonradioactive method to monitor protein synthesis. Nat Methods 6, 275–277. [DOI] [PubMed] [Google Scholar]
- Schuller AP, and Green R (2018). Roadblocks and resolutions in eukaryotic translation. Nat Rev Mol Cell Biol 19, 526–541. [DOI] [PMC free article] [PubMed] [Google Scholar]
- Stewart SA, Dykxhoorn DM, Palliser D, Mizuno H, Yu EY, An DS, Sabatini DM, Chen IS, Hahn WC, Sharp PA, et al. (2003). Lentivirus-delivered stable gene silencing by RNAi in primary cells. RNA 9, 493–501. [DOI] [PMC free article] [PubMed] [Google Scholar]
- Truitt ML, Conn CS, Shi Z, Pang X, Tokuyasu T, Coady AM, Seo Y, Barna M, and Ruggero D (2015). Differential Requirements for eIF4E Dose in Normal Development and Cancer. Cell 162, 59–71. [DOI] [PMC free article] [PubMed] [Google Scholar]
- Truitt ML, and Ruggero D (2016). New frontiers in translational control of the cancer genome. Nat Rev Cancer 16, 288–304. [DOI] [PMC free article] [PubMed] [Google Scholar]
- Van Noort JM, Kraal B, Sinjorgo KM, Persoon NL, Johanns ES, and Bosch L (1986). Methylation in vivo of elongation factor EF-Tu at lysine-56 decreases the rate of tRNA-dependent GTP hydrolysis. Eur J Biochem 160, 557–561. [DOI] [PubMed] [Google Scholar]
- Zhu L, Shi G, Schmidt CM, Hruban RH, and Konieczny SF (2007). Acinar cells contribute to the molecular heterogeneity of pancreatic intraepithelial neoplasia. Am J Pathol 171, 263–273. [DOI] [PMC free article] [PubMed] [Google Scholar]
Associated Data
This section collects any data citations, data availability statements, or supplementary materials included in this article.
Supplementary Materials
Figure S1. Identification of METTL13 as a Candidate eEF1A Lysine 55 Methyltransferase. Related to Figure 1
(A) eEF1AK55 dimethylation is the predominant species in multiple human cell lines. Selected ion chromatograms for non-, mono-, di- and trimethyl eEF1AK55 peptides from GluC digestion of endogenous eEF1A immunoprecipitated from the indicated whole cell lysates (WCEs). HPLC elution profiles show a 10-ppm mass window around expected peptide masses (peptide sequence MGKGSFKYAWVLD, K55 is underlined; m/z are 501.255, 505.927, 510.599 and 515.271). Red arrows indicate elution peaks of non-, mono- and dimethylated eEF1AK55 peptides in the profiles.
(B) Representative tandem mass spectra identifying mono- (top) and di- (bottom) methylation of endogenous eEF1AK55 immunoprecipitated from WCEs as shown in (A) and followed by trypsin digestion. m/z for b and y ions observed in spectra were indicated in blue and red, respectively.
(C) Specific recognition of eEF1AK55me by the anti-eEF1AK55me antibodies. Dot blot analysis with state-specific eEF1AK55me1-3 antibodies using the indicated biotinylated peptides. Blots probed with HRP-conjugated streptavidin (strep-HRP) as loading controls.
(D) Specificity of the anti-eEF1AK55me2 antibody in dot blot assays using biotinylated eEF1AK55me2 peptides and 19 different peptides from the indicated proteins that harbor a dimethyl lysine. Blots probed with strep-HRP as loading controls.
(E) Control small guide RNA (sgRNA) for CRISPR-based screen (Figure 1D). Western analysis with the indicated antibodies of WCEs from U2OS cells expressing the control sgRNA from the 322 sgRNA KMT library and seven randomly selected sgRNAs targeting the potential KMTs in the human genome. None of these sgRNAs reduced eEF1AK55me2 levels.
(F) Identification of METTL13 as a candidate eEF1AK55 di-methyltransferase. Western analyses with eEF1AK55me2 and tubulin antibodies of the 322 individual U2OS WCEs. Each cell line expresses CRISPR/Cas9 and one of the 322 sgRNAs. There are three independent sgRNAs targeting 107 known and candidate KMTs in the human genome. For each indicated KMT, eEF1AK55me2 and tubulin protein levels are shown in top and bottom panels, respectively and the data is organized alphabetically.
Table S3. List of Compounds used in Cell Growth Inhibition Screen; Related to Figure 7
Figure S2. METTL13 Methylates eEFlAK55 In Vitro, Related to Figure 2
(A) METTL13 methylates eEF1A1/2 at K55 in vitro. Selected ion chromatograms for non-, mono-, di- and tri-methyl eEF1A1/2-K55 peptides from GluC digestion after in vitro methylation with recombinant METTL13 using deuterated SAM as a methyl donor. HPLC elution profiles show a 10-ppm mass window around expected peptide masses (peptide sequence MGKGSFKYAWVLD, K55 is underlined; m/z are 501.255, 506.933, 512.6115 and 518.290). Red arrows indicate elution peaks of non-, mono- and dimethylated eEF1AK55 peptides in the profiles.
(B) Representative tandem mass spectra identifying in vitro mono- (top) and di- (bottom) methylation of eEF1AK55 by recombinant METTL13 using deuterated SAM and digested with trypsin. m/z for b and y ions observed in spectra were indicated in blue and red, respectively.
(C) Structural model of METTL131-400, with the MTase domain colored in light pink and the SBD domain colored in light blue. The co-factor byproduct S-Adenosyl-L-homocysteine (SAH) bound to the MTase domain is shown in sphere representation. The MTase and SBD domains are juxtaposed in a random orientation, with the linker sequence depicted as a dark dashed line. The SAH-interacting residues are shown in stick representation in the expanded view. The putative hydrogen bonds are shown as red dashed lines.
(D) Identification of point mutations that abrogate METTL13 enzymatic activity. In vitro methylation assay on recombinant GST-eEF1A1 with recombinant wild-type METTL13 or the indicated METTL13 single point mutations. Top panel, schematic diagram showing two putative methyltransferase (MT) domains of METTL13 and mutated residues in the MT1 domain. Underlined are signature motifs conserved in METTL13 with other 7βS members with known lysine methylation activity. Middle panel, autoradiogram of methylation assay. Bottom panel, Coomassie stain of proteins in the reaction. Asterisk indicates METTL13 breakdown product.
Figure S3. METTL13 Specifically Methylates eEF1AK55 In Cells, Related to Figure 3
(A) METTL13 is required for dimethylation of eEF1AK55 in human cell lines. Mass spectrometry-based quantification of eEF1AK55 methylation levels in the indicated cell lines expressing two independent sgRNAs targeting METTL13 and compared to the levels of sgRNA control cells.
(B) Western analysis with the indicated antibodies of in vitro methylation reactions on recombinant GST-eEF1A1, 40S, 60S and 80S ribosomes purified from T3M4 cells with recombinant METTL13WT or METTL13G58R. Input represents cytoplasmic extracts from T3M4 cells used for the isolation of 40S, 60S and 80S. Importantly, no eEF1A signal was detected in purified 40S, 60S and 80S fractions.
(C) Mass spectrometry analysis reveals no METTL13 methylation activity on unmodified eEF1AK55 peptide. Selected ion chromatograms for non-, mono-, di- and tri-methyl eEF1AK55 peptides after in vitro methylation on synthesized unmodified eEF1AK55 peptides (aa 45-65) with recombinant METTL13. HPLC elution profiles show a 10-ppm mass window around expected peptide masses (peptide sequence EAAEMGKGSFKYAWVLDKLKA, K55 is underlined; m/z are 635.590, 639.094, 642.598 and 646.102). Red arrows indicate elution peaks of non-methylated eEF1AK55 peptide in the profiles.
Figure S4. METTL13 and eEFlAK55me2 are Highly Expressed in Pancreatic and Lung Cancers and Promote Cancer Cell Proliferation, Related to Figure 4
(A) Summary of METTL13 expression levels in six publicly available expression data sets of PDAC (n=294 tumors and n=141 normal tissue independent samples). Detailed statistical description in the Methods section.
(B) orrelation of METTL13 mRNA expression levels and overall pancreatic cancer survival. Hazard ratio with 95% confidence intervals and log rank P-value are calculated. Data from GEO, EGA and TCGA.
(C) Differential epithelial expression levels of METTL13 and eEF1AK55me2 in human PDAC samples as assessed by immunohistochemistry (72 different samples were stained in total, the representative staining presented). Scale bars: 100 μm.
(D) Summary of METTL13 expression levels in six publicly available expression data sets of LAC (n=319 tumors and n=147 normal tissue independent samples). Detailed statistical description in the Methods section.
(E) Analysis of correlation of eEF1AK55me2 staining and LAC patient survival assessed by immunohistochemistry. ***P < 0.001, log-rank test, 96 different samples were stained in total, the representative staining presented. Scale bars: 100 μm.
(F) Differential epithelial expression levels of METTL13 and eEF1AK55me2 in human LAC samples as assessed by immunohistochemistry (96 different samples were stained in total, the representative staining presented). Scale bars: 100 μm.
(G) Cell proliferation rates of human lung cancer cell lines (NCI-H2170 and NCI-H520), human osteosarcoma cell line (U2OS), human fibrosarcoma cell line (HT1080) and human pancreatic cancer cell lines (PaTu8902 and colo357) expressing CRISPR/Cas9 and two independent METTL13 sgRNAs or a control sgRNA. Top panel, Westerns with indicated antibodies of WCEs from wild-type or METTL13 deficient cell lines as indicated. Error bars represent S.D. from three independent experiments. *P < 0.05, **P < 0.01, ***P < 0.001, two-tailed unpaired Student’s t-test.
Figure S5. Methylation Regulates eEF1A GTPase activity and mRNA Translation in Cells, Related to Figure 5
(A) Coomassie stain of purified Flag tagged eEF1A1K55me2 and eEF1A1K44me0 protein.
(B) In vitro GTP hydrolysis by dimethylated or unmethylated Flag-eEF1A1. Flag-eEF1A1 ± K55me2 purified from (A) was incubated with increasing amounts of GTP at 37 °C for 3h. Error bars represent S.D. from three independent reactions. Kinetic parameters were obtained by fitting the Michaelis-Menten equation to the plot of velocity of phosphate formation against GTP concentration.
(C) The effect of K55 dimethylation on the GTPase activity of Flag-eEF1A1 is independent of aminoacyl-tRNAs (aa-tRNAs). Flag-eEF1A1 ± K55me2 purified as in (A) was incubated with 500 μM GTP in reaction buffer at 37 °C for 3h in the absence or presence of aa-tRNAs. The y axis shows velocity of phosphate formation. Error bars represent S.D. from three independent reactions.
(D) Cytosolic extracts were isolated from control or METTL13-depleted T3M4 cells (replicate of Figure 5C) and fractionated on 5-50% sucrose gradients. Absorbance profiles show distribution of 40 and 60S ribosomal subunits, 80S monosome and polysomes. OD260nm, optical density at 260 nm. Left panel, Western analysis represents WCEs from the indicated cell lines used for the polysome profiling.
(E) METTL13 depletion does not impact protein synthesis in non-transformed RPE-1 cells. SUnSET assays as in Figure 5D show no difference in protein production in RPE-1 cells with or without METTL13. After being pulsed with 10 μg/mL puromycin for 15 min at the indicated conditions, WCEs were isolated and probed with the indicated antibodies.
(F) Requirement for eEF1AK55 for serum-stimulated protein synthesis in cells. SUnSET assays after recovery from serum starvation as in Figure 5D with control (sgControl plus vector control) or eEF1A-depleted T3M4 cells complemented with CRISPR-resistant eEF1A2WT, eEF1A2K55R or control as indicated. WCEs were isolated and probed with the indicated antibodies.
Figure S6. METTL13 Deletion Represses KRAS-driven Pancreatic and Lung Tumorigenesis In Vivo, Related to Figure 6
(A) Schematic of the Mettl13 conditional allele. In the presence of Cre recombinase, exon 3 is deleted to disrupt Mettl13 expression.
(B) Deletion of Mettl13 exon 3 of the conditional allele (Figure S6A) determined by PCR.
(C) METTL13 depletion inhibits ADM. Wild-type (WT, Ptf1aCre/+) acinar clusters (asterisk) undergo ADM and form ducts (arrowhead) ex vivo, whereas Ptf1aCre/+;Mettl13 mutant (Mettl13) acini explants inefficiently form ducts.
(D) Quantification of acinar and ductal clusters from Figure S6C. ***P < 0.001, n.s. not significant, two-tailed unpaired Student’s t-test, four independent biological replicas with three technical replicas each. Data are represented as mean ± s.e.m.
(E) Mettl13 expression by quantitative PCR with reverse transcription (qRT–PCR) analysis at the indicated times from control- and EGF-induced ADM ex vivo samples, four independent biological replicas as in Figure S6C.
(F) Immunohistochemical analysis of tumors that emerged in Kras;Mettl13 LAC model reveals that tumors retained METTL13 expression suggesting incomplete bi-allelic Cre recombination in these clonal growths. Representative staining presented. Scale bars: 1000 μm, insets magnification x10.
Figure S7. Depletion of METTL13’s Catalytic Activity Inhibits Growth of Pancreatic and Lung Cancer PDX Tumors in vivo and Regression of PDX Tumors by the Combination of METTL13 Depletion and Treatment with PI3K/mTOR Inhibitors, Related to Figure 7
(A) Tumor volume quantification for patient derived PDAC xenografts modified to express sgRNA METTL13 or sgRNA control and overexpressing wildtype METTL13wt or catalytically deficient METTL13G58R in mice (n = 8 mice for each treatment group). ***P < 0.001, two-tailed unpaired Student’s t-test. Data are represented as mean ± s.e.m. Immunoblots with the indicated antibodies of the PDX biopsies (one representative sample for each condition is shown).
(B) Tumor volume quantification for patient derived LAC xenografts modified to express sgRNA METTL13 or sgRNA control and overexpressing wildtype METTL13WT or catalytically deficient METTL13G58R in mice (n = 8 mice for each treatment group). ***P < 0.001, two-tailed unpaired Student’s t-test. Data are represented as mean ± s.e.m. Immunoblots with the indicated antibodies of the PDX biopsies (one representative sample for each condition is shown).
(C and D) Tumor volume quantification for patient derived (D) PDAC and (E) LAC xenografts modified to express sgRNA METTL13 or sgRNA Control (see Fig. S7A and S7B) treated with placebo (vehicle) or Omipalisib. Plots showing fold change in tumor volume compared to initial tumor volume. ***P < 0.001, n.s., not significant, two-tailed unpaired Student’s t-test. Data are represented as mean ± s.e.m. Treatment schedule as in Figure 7E.
(E) Model of the role of METTL13 and eEF1A methylation in enhancing protein synthesis to fuel growth signal-driven tumorigenesis.
(F and G) IMR90 (non-transformed), and the Ras positive HT1080, PaTu8902, T3M4 and colo357 cell lines were treated as indicated with SDS-1-021 for 72h. (F) Proliferation was determined by BrdU incorporation and expressed as a fraction of the inhibition of BrdU incorporation relative to control (vehicle-treated) cells. Results are presented as mean values ± SD (n = 3). (G) Viable cell count was measured by Trypan blue exclusion and expressed as a fraction of control (vehicle-treated) cells. Results are presented as mean values ± SD (n = 3). *p<0.05, **P < 0.01, two-tailed unpaired Student’s t-test.
Table S1. List of sgRNAs used in Gene-Editing Coupled Biochemical Screen; Related to Figure 1
Table S2. List of Methylated Peptides Detected in SILAC-based Quantitative Proteomic Analysis; Related to Figure 3