

Abstract
Establishment of spatial coordinates during Drosophila embryogenesis relies on differential regulatory activity of axis patterning enhancers. Concentration gradients of activator and repressor transcription factors (TFs) provide positional information to each enhancer, which in turn promotes transcription of a target gene in a specific spatial pattern. However, the interplay between an enhancer regulatory activity and its accessibility as determined by local chromatin organization is not well understood. We profiled chromatin accessibility with ATAC-seq in narrow, genetically tagged domains along the antero-posterior axis in the Drosophila blastoderm. We demonstrate that one-quarter of the accessible genome displays significant regional variation in its ATAC-seq signal immediately after zygotic genome activation. Axis patterning enhancers are enriched among the most variable intervals, and their accessibility changes correlate with their regulatory activity. In an embryonic domain where an enhancer receives a net activating TF input and promotes transcription, it displays elevated accessibility in comparison to a domain where it receives a net repressive input. We propose that differential accessibility is a signature of patterning cis-regulatory elements in the Drosophila blastoderm and discuss potential mechanisms by which accessibility of enhancers may be modulated by activator and repressor TFs.
Embryonic development is controlled by gene regulatory networks (GRNs) that define and refine positional information along the embryonic axes, specify cell fates, and ultimately direct cell differentiation (Levine and Davidson 2005). GRNs consist of tightly controlled gene interactions that unfold in space and time. Many nodes in these GRNs are represented by cis-regulatory elements (CREs) that integrate transcription factor (TF) inputs and consequently tune the level of transcription initiation of their target genes.
Drosophila embryogenesis provides two canonical examples of such patterning GRNs, which specify spatial coordinates along the antero-posterior (AP) and dorso-ventral (DV) axes (Nasiadka et al. 2002; Moussian and Roth 2005). The networks define the position together with identity of future body segments and germ layers as early as the onset of zygotic genome activation (cellularizing blastoderm, stage 5). A small set of maternally deposited TFs regulates the increasingly complex and spatially restricted patterns of the downstream tiers of zygotic regulators which together, in a combinatorial fashion, lay down the positional blueprint of the embryo.
Establishment of these robust and precise expression patterns during Drosophila embryogenesis is mediated by axis patterning enhancers. Each element is targeted by multiple activators and repressors. Their varying concentrations along the body axes provide specific positional information that is converted in each cell into a distinct transcriptional output. As a result, a target gene is expressed only in the precise embryonic domain where its enhancer receives a net activating input.
Multiple efforts have focused on deciphering how the sequence of axis patterning enhancers determines interpretation of their regulatory input (Levine 2010). Molecular dissection of endogenous and synthetic CREs (Driever et al. 1989; Fakhouri et al. 2010) defined the contribution of activator and repressor TF binding sites (TFBSs)—their identity and affinity, as well as organization in the sequence. In support of this notion, activity patterns of the enhancers have been predicted solely as a function of their sequence and spatial distribution of the input TFs (Segal et al. 2008; He et al. 2010).
In addition to the sequence properties of CREs, mounting evidence points to the chromatin context as another determinant of transcriptional regulation. It is unclear, though, how the regulatory activity of axis patterning enhancers relates to their chromatin organization. On one hand, the enhancers are characterized by nucleosome depletion and highly accessible chromatin structure (Thomas et al. 2011). This is consistent with nucleosome destabilization and remodeling being a prerequisite for the exposure of TFBSs to their input activators and repressors (Guertin and Lis 2013). On the other hand, there is evidence directly implicating nucleosomes in mediating interactions between input TFs. Ectopic overexpression of a single repressor was demonstrated to increase nucleosome occupancy of its target enhancer (Li and Arnosti 2011). Additionally, Teif and Rippe (2011) showed that the relationship between the efficiency of a repressor and its distance to the nearest activator binding site (Fakhouri et al. 2010) can be modeled based on the dynamics of the intervening nucleosome. Finally, activator and repressor TFs can potentially modify the chromatin environment of target enhancers through their coregulators, which recruit histone acetyltransferases and deacetylases, respectively (Mannervik 2014). Indeed, Koenecke et al. (2017) demonstrated that active and inactive enhancers of the DV network display different histone marks on their flanking nucleosomes, although a direct causal link is lacking.
How can we then reconcile the potential role of nucleosome positioning and histone modifications with the prevalent effect of the composition and arrangement of TFBSs that emerges from the multitude of genetic studies and modeling efforts? In light of the studies discussed above, we envision two scenarios that relate the chromatin context to the activity of axis patterning enhancers.
In a sequence-centric view of enhancer function, we can hypothesize that axis patterning enhancers are highly and equally accessible to different combinations of TFs throughout the embryo. This would allow activators and repressors to probe all TFBSs with the same probability, in agreement with assumptions of the published computational models (Segal et al. 2008; He et al. 2010). In this scenario, the enhancers are expected to display highly open chromatin structure at all positions along the body axes. Alternatively, we envision that a single enhancer may be characterized by multiple different chromatin states, reflecting its differential regulatory activity in different regions of the embryo. The chromatin context of enhancers may potentially be modulated by differential occupancy of input TFs, possibly through their interactions with nucleosomes or histone-modifying properties of their coregulators. The second hypothesis requires an active interplay between TFs and chromatin, while the first one assumes chromatin structure to be essentially invariant along the patterning axes.
To distinguish between these two hypotheses, it is necessary to examine whether the chromatin state of axis patterning enhancers varies spatially in the Drosophila blastoderm. The majority of available genome-wide profiles of nucleosome occupancy (The modENCODE Consortium et al. 2010; Li et al. 2014) and chromatin accessibility (Thomas et al. 2011) have been acquired from whole embryos. As a result, the potential differences along body axes are convoluted into a single whole-embryo average. Two studies have addressed this spatial heterogeneity by assaying mutant embryos with reduced or uniform positional identities: Li and Arnosti (2011) profiled nucleosome occupancy of two selected loci, and Koenecke et al. (2017) acquired genome-wide profiles of two specific histone marks. While the studies provide valuable insights into the chromatin context of axis patterning enhancers, they do not allow distinguishing between the two proposed models.
In an alternative approach, Cusanovich et al. (2018) assayed chromatin accessibility in single cells of dissociated Drosophila embryos. However, the current methodology did not allow for reconstruction of exact positional coordinates of the assayed nuclei, unlike the study by Haines and Eisen (2018), who profiled chromatin accessibility directly in cryo-sliced anterior and posterior halves of the blastoderm. While Cusanovich et al. demonstrated extensive spatial and temporal variation of chromatin organization throughout embryogenesis, Haines and Eisen concluded that a vast majority of the accessible genome was invariant, with only a small number of enhancers displaying regional differences in their chromatin organization.
In this study, we assay chromatin organization of axis patterning enhancers by probing their accessibility with ATAC-seq (Buenrostro et al. 2013) in seven precisely defined domains along the AP axis in the Drosophila blastoderm. By applying genetic tagging and affinity purification, we reproducibly isolate embryonic nuclei with well-resolved spatial coordinates (Fig. 1). To limit temporal variation, we assay a narrow time point of stage 5 cellularizing blastoderm, immediately after the onset of zygotic genome activation. Since accessibility of linker DNA is jointly affected by the positioning and stability of nucleosomes as well as their histone modifications (Bell et al. 2011), we use the chromatin accessibility assay as a global metric for chromatin organization of the enhancers.
Figure 1.

Domain-restricted ATAC-seq profiling along antero-posterior axis in the blastoderm embryo. (A) Selected AP domains are targeted by expressing a nuclear tag, UNC84-3×FLAG, under control of well-characterized enhancers of gap and pair-rule genes. All reporter constructs are integrated at the same genomic site (attP2) (Pfeiffer et al. 2008) to standardize genetic background. After homogenization of staged embryos (cellularizing blastoderm, stage 5, 2:50–3:10 h after egg laying), tagged nuclei are affinity-purified with anti-FLAG antibodies, followed by Tn5 transposase fragmentation and ATAC-seq library preparation. An ATAC-seq library representing an entire pool of nuclei from homogenized embryos (whole-embryo) serves as a control. (B) Overview of the tagged domains (D1–D7). Selected embryos immunolabeled with an anti-FLAG antibody show spatially restricted expression domains of the nuclear tag. Each domain is additionally schematized (green bars) to indicate its position along the AP axis. Embryos are positioned with anterior to the left and dorsal side up.
Results
An experimental system to assay chromatin accessibility with spatial and temporal resolution
To evaluate variation in chromatin accessibility of axis patterning enhancers, we performed ATAC-seq with high spatial resolution along the AP axis of Drosophila blastoderm embryos. We profiled chromatin from a range of AP domains, whose positions were specifically and precisely defined by the enhancer activity of selected gap and pair-rule genes. We drove expression of a nuclear tag (nuclear-envelope marker UNC84-3×FLAG) (modified from Henry et al. 2012) under control of these well-characterized enhancers in a series of transgenic strains (Fig. 1A). Tagged nuclei were subsequently isolated from the whole-embryo homogenate by anti-FLAG antibody pull-down, followed by Tn5 transposase digestion of the native chromatin (Buenrostro et al. 2013). Our strategy was an adaptation of the previously described method, INTACT (Deal and Henikoff 2011; Henry et al. 2012). At the same time, we performed transposase digestion on the entire pool of nuclei from staged embryos, without prior affinity purification (referred to as whole-embryo controls) (Fig. 1A).
We assayed seven domains (D1–D7) (Fig. 1B) that differed both in size and position along the AP axis, ranging from the entire anterior half of the embryo (domain D1) to stripes that were only 4–5-nuclei wide (domains D3 and D6). By selecting enhancers of early zygotic genes, we ensured sufficient expression levels of the nuclear marker in stage 5 embryos, soon after the onset of zygotic genome activation. With UNC84-3×FLAG being embedded in the inner nuclear envelope (Henry et al. 2012), the diffusion of the nuclear tag outside of its expression domain was limited, in spite of the embryo still representing a syncytium at the beginning of stage 5.
Because chromatin accessibility evolves dynamically during development (Thomas et al. 2011; Blythe and Wieschaus 2016), we targeted a narrow window of embryogenesis to ensure that differences in the accessibility landscape, if any, would primarily stem from spatial rather than temporal variation. We performed 20-min collections of stage 5 embryos (Supplemental Figs. S1, S2), a stage immediately after zygotic genome activation, when expression patterns of gap and pair-rule TFs are already established, and the axis patterning enhancers receive the full spectrum of their regulatory input (Surkova et al. 2008; Jaeger 2011).
Regional differences in chromatin accessibility along the AP axis
We compared ATAC-seq signal at selected AP genes across all tagged domains (D1–D7) as well as the whole-embryo controls (Fig. 2; Supplemental Fig. S3). While the position of accessible regions was conserved between the domains, we observed considerable quantitative differences in the degree of their accessibility.
Figure 2.

Regional differences in chromatin accessibility. Accessibility profiles of individual tagged domains and a whole-embryo control at the locus of giant (gt), a gene of the AP patterning network of the gap class. Tracks show normalized coverage of 1- to 100-bp ATAC-seq fragments, smoothed over a sliding window of 15 bp. AP positions of the profiled domains are indicated schematically on the left (green shading). Blue bars and underlying shaded regions indicate coordinates of known giant enhancers (REDfly names and references provided in Supplemental Table S8). Spatial activity of each enhancer in blastoderm embryos is illustrated above (RNA in situ hybridization of a reporter gene) (reprinted from Schroeder et al. 2004). Note that gt_(-2)_broad was used as a driver of UNC84-3×FLAG in D7, and the additional copy in attP2 partially contributes to its elevated ATAC-seq signal (as discussed in Supplemental Methods). Genomic coordinates and gene models: FlyBase Release 5.57 (Gramates et al. 2017).
We first sought to determine whether this variation represented biological differences in chromatin organization or technical variability of our multistep protocol. The strong correlations between duplicates of individual tagged domains, with Pearson coefficients reaching 0.98–0.99 (Supplemental Fig. S4), demonstrated high reproducibility of our experimental protocol, including independent staging of embryos, affinity purification of tagged nuclei, and transposase digestion. Whole-embryo controls obtained from different transgenic strains were characterized by equally strong correlations (Supplemental Fig. S4), confirming that expression of the nuclear tag in different regions of the embryo did not affect the genome-wide distribution of ATAC-seq signal. The controls were also highly comparable to the published chromatin accessibility profiles from whole stage 5 embryos (Thomas et al. 2011), both in terms of the identity of mapped accessible regions and correlation of their signal intensities (Supplemental Fig. S5). Overall, we concluded that the quantitative differences in accessibility signal were not caused by technical variability of the protocol or nuclear tagging per se.
We subsequently analyzed global differences between accessibility profiles of the tagged domains and whole-embryo controls. We identified a set of 17,345 accessible genomic regions that were reproducibly called as ATAC-seq peaks in all eight whole-embryo controls (referred to as high-confidence peaks) (Supplemental Table S4). We globally compared their signal intensities between all samples in a principal component analysis (PCA). The PCA separated the tagged domains in agreement with their AP position (Fig. 3A; Supplemental Fig. S6) and revealed two distinct clusters of anterior domains (D1–D3) and posterior domains (D4–D7). The analysis also confirmed close similarity between whole-embryo controls of different genotypes (different transgenic constructs).
Figure 3.

Genome-wide differences in chromatin accessibility profiles along the AP axis. (A) Principal component analysis (PCA) of genome-wide accessibility variation across individual tagged domains (solid circles) and whole-embryo controls (crossed squares). Duplicates are represented as separate data points and color-coded by genotype (D1: red; D2: orange; D3: purple; D4: dark blue; D5: light blue; D6: dark green; D7: light green). PCA is based on accessibility signal (total count of Tn5 transposase cuts) over 17,345 high-confidence ATAC-seq peaks. One replicate of the D6 domain shows high similarity to whole-embryo controls, indicative of potential sample contamination with untagged nuclei. (B) Pie chart shows proportion of the accessible genome (combined size of high-confidence ATAC-seq peaks) represented by constitutive peaks that show no significant variation in their accessibility signal along the AP axis (gray), and differential peaks that are supported by a single pair-wise comparison (light blue) and multiple pair-wise comparisons (dark blue) in the DESeq2 analysis. (C) Example scatter plots show fold-change of ATAC-seq signal between selected domains against the mean normalized signal intensity. Gray: distribution of constitutive peaks, blue points: individual differential peaks (false discovery rate, FDR < 1%). The number of ATAC-seq peaks showing significant increase (up arrow) and decrease (down arrow) of their signal is indicated in the upper right corner of each plot.
A vast majority of high-confidence peaks from the whole-embryo controls displayed significant signal enrichment and were identified as ATAC-seq peaks, also in individual tagged domains (Supplemental Fig. S7). This means that differences in accessibility profiles highlighted in the PCA were primarily of a quantitative nature and did not involve global changes in the genome-wide distribution of accessible regions.
Taken together, our results reveal extensive regional variation of chromatin accessibility in blastoderm embryos. While the genomic location of accessible intervals is overall conserved, the extent of their accessibility differs quantitatively between the domains. Therefore, each position along the AP axis is characterized by a distinct accessibility profile, with the whole-embryo controls representing an average across multiple accessibility states.
One-quarter of the accessible genome shows significant quantitative variation in its ATAC-seq signal
To determine what proportion of the accessible genome accounts for the quantitative differences along the AP axis, we applied the DESeq2 tool (Love et al. 2014) to systematically identify ATAC-seq peaks that displayed significant signal variation (Supplemental Tables S6, S7). We performed a series of pair-wise comparisons between tagged domains and their corresponding whole-embryo controls as well as between individual domains (Supplemental Fig. S8A).
Out of 17,345 high-confidence ATAC-seq peaks that were identified in whole-embryo controls, 4282 showed significant accessibility changes along the AP axis (FDR < 1%), corresponding to 25.8% of the accessible genome (Fig. 3B). As many as 2925 of the differential peaks (17.7% of the accessible genome) were supported by at least two independent pair-wise comparisons (Supplemental Fig. S8B). When we considered the accessible genome in a broader sense, i.e., a union of peaks from all tagged domains and whole-embryo controls, the proportion of peaks showing differential accessibility hardly changed (27.0%) (Supplemental Fig. S9). This proportion is different from the 1.7% of differential peaks reported by Haines and Eisen (2018) between the anterior and posterior embryo halves, with obvious consequences on the resulting conclusions.
The number of differential peaks identified in individual comparisons between the domains was correlated with their distance along the AP axis (Fig. 3C). DESeq2 consistently identified a larger number of differential peaks between domains that represented anterior and posterior halves of the embryo (e.g., D1 vs. D4) as opposed to domains that showed substantial overlap (e.g., D1 and D2). This confirmed the high specificity of our approach and also demonstrated that the measured accessibility is indeed a function of the domain's position along the AP axis.
Differential accessibility is a signature of axis patterning enhancers
Open chromatin regions in the Drosophila blastoderm correspond to a range of functional genomic elements, such as transcribed gene bodies, promoters, distal CREs, insulators, and origins of replication (Thomas et al. 2011). Our aim was to determine whether differential peaks represented any specific class of these functional elements.
While more than one half of constitutive peaks corresponded to promoters and gene bodies, a vast majority of differential peaks mapped to intergenic and intronic regions (Fig. 4A; Supplemental Fig. S11A). This suggested that differential peaks might represent distal CREs, and we tested this idea by evaluating colocalization of intronic and intergenic peaks with binding sites for different classes of proteins. We used published chromatin immunoprecipitation (ChIP) data from whole blastoderm embryos (Li et al. 2008; Celniker et al. 2009; MacArthur et al. 2009; Bradley et al. 2010), except for definitions of origins of replication (ORI) that were acquired from three Drosophila cell lines (Eaton et al. 2011). In comparison to constitutive peaks, a significantly smaller proportion of differential peaks represented ORIs or was bound by insulator proteins (Fig. 4B; Supplemental Fig. S11B). At the same time, differential peaks were strongly enriched as targets of TFs that are involved in patterning of the blastoderm embryo, both along the AP and DV axes. Localization to intronic and intergenic regions as well as enrichment in binding by patterning TFs was even more pronounced for differential peaks that showed the largest magnitude of accessibility changes along the AP axis (top quarter in Fig. 4A,B, according to definitions from Supplemental Fig. S10).
Figure 4.

Differential ATAC-seq peaks display strong features of axis patterning enhancers. (A) Proportional distribution of genomic annotations among different classes of accessible regions: all high-confidence ATAC-seq peaks (all peaks), constitutive peaks, differential peaks, top quarter of differential peaks (highest values of maximum log2 fold-change reported in DESeq2) (Supplemental Fig. S10). (UTR) 5′ and 3′ untranslated regions, (CDS) coding sequence. (B) Bar plot shows the proportion of different classes of ATAC-seq peaks that map to intronic and intergenic regions (numbers of intervals in the legend) and colocalize with ChIP signal of different classes of proteins. (ORI complex) ChIP-seq peaks of ORC2 (origin recognition complex subunit 2) (Eaton et al. 2011), (Insulator proteins) ChIP-chip peaks of BEAF-32, CP190, CTCF, and Su(Hw) (Celniker et al. 2009), (DV TFs) ChIP-chip peaks of four maternal and zygotic DV TFs: Dorsal, Mothers against dpp, Snail, and Twist (MacArthur et al. 2009), (AP TFs [broad set]) ChIP-chip peaks of 14 maternal, gap, and pair-rule AP TFs: bicoid, caudal, giant, hunchback, knirps, Kruppel, huckebein, tailless, Dichaete, fushi tarazu, hairy, paired, runt, and sloppy paired 1 (Li et al. 2008; MacArthur et al. 2009), (AP TFs [narrow set]) ChIP-seq peaks of six maternal and gap AP TFs: Bicoid, Caudal, Giant, Hunchback, Knirps, and Kruppel (Bradley et al. 2010). Asterisks indicate significant differences between constitutive and differential peaks; (***) P < 0.0001, Fisher's exact test. (C) Bar plot shows the proportion of annotated CREs that overlap differential peaks. Total number of CREs from each category is indicated above the bars: Vienna Tiles (Kvon et al. 2014) active at stage 4–6, REDfly CREs (Gallo et al. 2011) active in blastoderm embryos, and AP enhancers driving patterned expression specifically along the AP axis (Supplemental Table S8). (D) Box plots show distributions of maximum log2 fold-change of accessibility signal reported for all differential peaks (blue) and differential peaks overlapping the three categories of annotated CREs (green).
The fact that differential peaks displayed features of patterning CREs prompted us to test their colocalization with known axis patterning enhancers. We first assessed the overlap of differential peaks with an extensive collection of 2-kb genomic regions screened for their enhancer activity during the entire span of Drosophila embryogenesis (Vienna Tiles) (Kvon et al. 2014). Vienna Tiles that colocalized with differential peaks were enriched in elements that showed enhancer activity at stage 4–6 of embryogenesis and drove patterned expression primarily along the AP axis (Supplemental Fig. S12). While 48% of Vienna Tiles active in stage 4–6 embryos mapped to differential peaks (Fig. 4C), this proportion increased to 77% when considering a closely curated and experimentally validated set of CREs that are active specifically in the blastoderm embryo (REDfly database) (Gallo et al. 2011). When we selected a subset of 88 REDfly enhancers that drove patterned expression specifically along the AP axis (referred to as AP enhancers) (Supplemental Table S8), more than 90% overlapped differential peaks. In all cases, the known enhancers colocalized with ATAC-seq peaks that showed a considerably larger magnitude of accessibility variation as compared to the total pool of differential peaks in blastoderm embryos (Fig. 4D).
We conclude that, among all functional elements that are accessible in the early embryo, significant regional variation is observed primarily for those that regulate patterned gene expression. In our assay, differential accessibility is displayed most strongly by axis patterning enhancers of the AP axis, as this is the spatial dimension over which we capture variation in the enhancer's accessibility most clearly (Fig. 4B,C; Supplemental Fig. S12B). Nevertheless, we also observe differential peaks that colocalize with elements of the orthogonal DV network. Most likely this is due to partial modulation of their activity patterns along the dissected AP axis (Supplemental Fig. S12C). High occupancy of DV TFs at differential regions can also be attributed to the phenomenon of cross-regulation between the AP and DV networks (Carroll et al. 1987; Zeitlinger et al. 2007). Overall, we propose that differential accessibility is a general feature of axis patterning enhancers.
We note that differential accessibility can potentially be used as a metric for de novo discovery of developmental enhancers in complex tissues, as suggested by Pearson et al. (2016). The fact that the uncharacterized differential peaks show similar features as those that overlap known axis patterning enhancers (combinatorial binding by multiple patterning TFs) (Supplemental Fig. S13) further supports the validity of this approach.
Elevated accessibility of enhancers coincides with domains of their transcriptional activity
Having demonstrated that axis patterning enhancers display significant accessibility variation along the AP axis, we next sought to determine how their accessibility changes relate to their regulatory activity. When examining individual CREs (Figs. 2, 5A), we observed that their ATAC-seq signal was elevated in a tagged domain that coincided with their transcriptional activity, while it was consistently reduced in a domain from which their expression pattern was excluded.
Figure 5.

Elevated accessibility of AP enhancers in tagged domains coincides with their activity. (A) Coverage of 1- to 100-bp ATAC-seq fragments (mean over two replicates) of four selected AP enhancers. Comparison between a whole-embryo control (control: gray), a tagged domain that encompasses the enhancer's activity pattern (IN: blue), and a tagged domain from which the enhancer's activity is excluded (OUT: green). Activity pattern along the AP axis is indicated schematically in dark blue, with color-coded outlines representing positions of respective domains. RNA in situ hybridization images of a reporter gene: gt_(−10) and nub_(+2) (reprinted from Schroeder et al. 2004), Dfd_(−13) (reprinted from Fisher et al. 2012), and Antp_(−16) (reprinted from Kazemian et al. 2010). (B) Violin plots show distribution of log2 fold-changes of ATAC-seq signal (total count of Tn5 transposase cuts, mean over two replicates) between a given tagged domain and its corresponding whole-embryo control, over two classes of AP enhancers: IN (blue) and OUT (green). Asterisks indicate significant differences between IN and OUT enhancers (Student's t-test); (*) P-value < 0.05, (***) P-value < 0.0001. Numbers of enhancers in each class are indicated below individual plots. Domains D3 and D6 are not presented; due to their limited size, none of the AP enhancers had its activity pattern fully included in the domains.
To systematically evaluate the relationship between accessibility and enhancer activity, we focused on the 88 AP enhancers that drive patterned expression specifically along the AP axis. For each tagged domain, we binned the enhancers into two classes: those whose activity pattern was completely included in the tagged domain (IN) and those whose activity pattern was completely excluded from the tagged domain (OUT). We subsequently calculated fold-changes of their ATAC-seq signal between a given tagged domain and the corresponding whole-embryo control. We observed significant differences in the distribution of fold-changes between IN and OUT enhancers (Fig. 5B). In comparison to the whole-embryo control, enhancers that promoted transcription inside the assayed domain (active enhancers) showed a relative increase in their accessibility, while those that did not induce transcription (inactive enhancers) were characterized by a relative decrease in their accessibility. The intermediate ATAC-seq signal of the whole-embryo control was consistent with it representing an average across all accessibility profiles in the blastoderm embryo. Overall, we demonstrate a strong relationship between the regional accessibility variation of axis patterning enhancers and their differential regulatory activity along the AP axis.
Accessibility of enhancers is quantitatively correlated with their transcriptional output
Although displaying consistently elevated accessibility in the domain of their activity, the AP enhancers were characterized by a fairly broad distribution of their signal fold-changes relative to the whole-embryo control (Fig. 5B). For instance, an individual run_(+17) runt enhancer displays comparably low accessibility in all domains from which its activity pattern is excluded (Fig. 6A), yet, its ATAC-seq signal differs considerably between the other two domains that encompass the runt stripe: It is distinctly elevated in D5, while it resembles that of the whole-embryo control in D4. This poses a more specific question on interpretation of the ATAC-seq signal measured in individual tagged domains.
Figure 6.

Accessibility of AP enhancers is highly correlated with their transcriptional output. (A) Coverage of 1- to 100-bp ATAC-seq fragments over an enhancer of runt, run_(+17), measured in D1–D7 domains and a whole-embryo control (mean over replicates). Domains are color-coded as in the schematic that shows their positions along the AP axis and with respect to the activity pattern of the enhancer (dark blue). (B) ATAC-seq signal (mean number of Tn5 transposase cuts per bp) plotted against the proportion of an embryonic domain in which the enhancer is active (active nuclei). Each point represents an individual replicate of D1–D7 samples and whole-embryo controls (pooled replicates from multiple strains), color-coded as in panel A. D6 replicate 1 is excluded due to its close similarity to whole-embryo controls (Fig. 3A). (C) Box plot represents distribution of correlation coefficients and linear regression slopes across 88 AP enhancers. (D) Scatter plots of example enhancers, each representing a different quarter of correlation coefficients (all enhancers in Supplemental Fig. S14). (E) Box plots show ATAC-seq signal distribution (mean number of Tn5 transposase cuts per bp) of active AP enhancers (signal from tagged domains with 100% active nuclei; active state), inactive AP enhancers (signal from tagged domain with 0% active nuclei; inactive state), and 9309 background regions of the genome (mean signal across all tagged domains; background regions).
In comparison to D4, higher accessibility of run_(+17) in D5 appears to coincide with its transcriptional activity in a larger portion of the domain. Similar to the whole-embryo control, each tagged domain often represents a mix of nuclei in which a given axis patterning enhancer is either active or inactive. As a result, the measured ATAC-seq signal likely corresponds to a weighted average of accessibility profiles associated with either of the states. If this assumption is correct, we should observe a linear correlation between accessibility signal and the proportion of nuclei representing active and inactive enhancers.
To test this model, we plotted ATAC-seq signal measured in each tagged domain against the proportion of nuclei from that domain in which an individual AP enhancer was active (Fig. 6B,D; Supplemental Fig. S14). We calculated the proportion of active states by measuring the extent of overlap between a tagged domain and the enhancer's activity pattern, after simplifying their spatial coordinates to a single dimension of the AP axis (Supplemental Tables S2, S9). We additionally corrected for the elliptical shape of the embryo by incorporating information on the density of nuclei along the AP axis (Supplemental Methods).
We observed a strong positive relationship between the ATAC-seq signal and the proportion of nuclei representing an active state. As many as three-quarters of the AP enhancers were characterized by a correlation coefficient above 0.65 (Fig. 6C). For the remaining quarter of elements, we could trace the poor linear relationship to technical difficulties in accurately measuring their activity patterns, e.g., due to additional modulation along the orthogonal DV axis or low quality of available in situ hybridization images.
In summary, our simple model proved applicable for deconvoluting the ATAC-seq signal from individual domains, potentially offering a general framework for interpreting genomic signal from complex tissues. We confirmed in a quantitative and systematic fashion the correlation between local accessibility of axis patterning enhancers and their regulatory activity. The strong linear relationship further indicates that active and inactive enhancers display distinct accessibility profiles.
It is important to note that the considered axis patterning enhancers are targeted by TFs along the entire AP axis, often simultaneously integrating inputs from activators and repressors. It is the prevalence of either regulatory cue that determines their transcriptional activity and correlates with local accessibility in our assay. Thus, our analysis reveals that enhancers display reduced accessibility in regions of the embryo where they receive a net repressive input, while their elevated accessibility coincides with the net activating TF input.
Inactive enhancers exhibit residual accessibility
With the proposed model, we were able to dissect two aspects of accessibility variation along the AP axis: (1) the relative contribution of active and inactive enhancer states in the tagged domains; and (2) the enhancer-specific absolute levels of accessibility in either of the states.
Mean ATAC-seq signal in both the active and inactive states displayed a considerable spread among individual AP enhancers (Fig. 6E). Consistent with our observations of selected elements (Fig. 2; Supplemental Fig. S3), this suggested that different axis patterning enhancers did not share the same level of accessibility. This was additionally confirmed by the broad range of the linear regression slopes (Fig. 6C), which represent the relative difference of the ATAC-seq signal between active and inactive states. The magnitude of change did not depend on the position of the enhancer's target gene in the AP regulatory network or distribution of its activity pattern along the embryonic axis (Supplemental Fig. S15). This is in contrast with observations by Haines and Eisen (2018), who report more pronounced accessibility modulations for the anterior elements.
Finally, to determine the scale of accessibility reduction in the inactive state, we tested whether inactive AP enhancers exhibit closed chromatin organization, comparable to nonfunctional regions of the genome. To this end, we identified a comprehensive set of genomic intervals that displayed background sensitivity to transposase digestion, i.e., were not identified as ATAC-seq peaks in any of the samples (Supplemental Methods). Comparison with the inaccessible background regions revealed significant elevation of the ATAC-seq signal in the inactive enhancer states (Fig. 6E).
We conclude that accessibility of inactive enhancers, even though significantly reduced, does not decrease to the level of background inaccessible regions. Instead, axis patterning enhancers are characterized by an open chromatin structure in both their active and inactive states, although the absolute level of accessibility is unique to each enhancer.
Well-positioned nucleosomes within axis patterning enhancers
While the previous sections examined the overall modulation of enhancer accessibility in different states of activity, we also noted strong variation of the signal within individual elements (Fig. 5; Supplemental Fig. S14). This is demonstrated by the coverage of ATAC-seq fragments that are shorter than 100 bp and thus likely correspond to nucleosome-free intervals (Fig. 7B). The probability of two cleavages at such a close distance within a nucleosomal core is very low due to the steric hindrance of Tn5 transposase (Buenrostro et al. 2013). When using the NucleoATAC tool (Schep et al. 2015) to predict nucleosome occupancy based on longer transposase products (Fig. 7C), we observed its strong anticorrelation with the coverage of shorter fragments, which was consistent across all AP enhancers (Fig. 7D).
Figure 7.
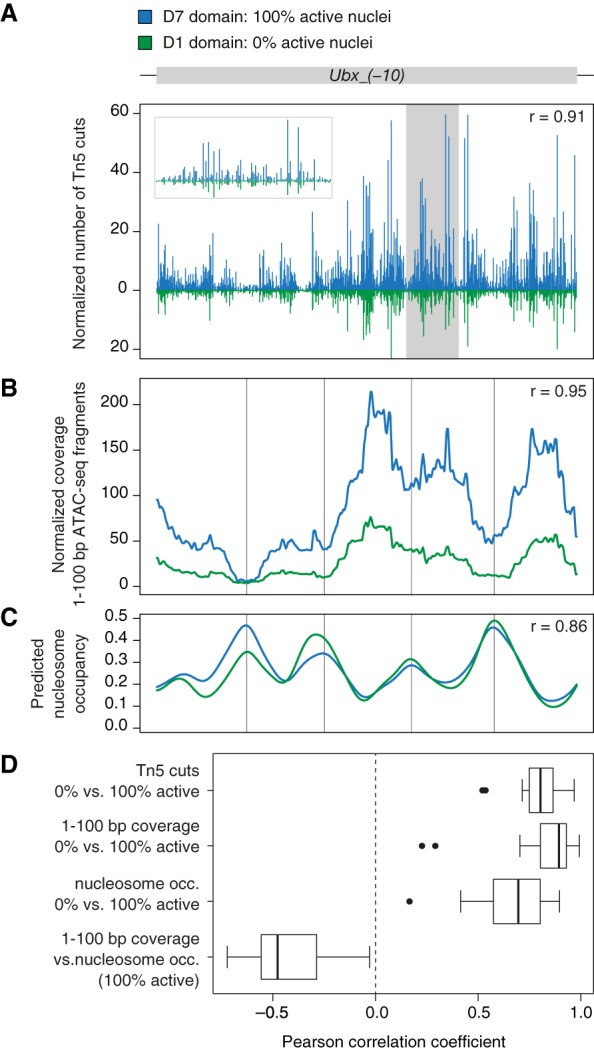
Local accessibility modulation within axis patterning enhancers. (A) Normalized frequency of Tn5 transposase cleavages, (B) normalized coverage of 1- to 100-bp nucleosome-free ATAC-seq fragments, and (C) predicted nucleosome occupancy along Ubx_(−10) enhancer in D7 domain (blue; 100% active nuclei) and D1 domain (green, 0% active nuclei). Inset in a gray frame represents magnification of the shaded region. Nucleosome occupancy was predicted with NucleoATAC (Schep et al. 2015). r = Pearson correlation coefficient of the compared profiles. (D) Box plots show distribution of correlation coefficients across all AP enhancers. Distribution of transposase cuts, coverage of 1- to 100-bp ATAC-seq fragments and predicted nucleosome occupancy was compared between tagged domains with 100% active and 0% active nuclei. Coverage of 1- to 100-bp fragments was compared with the predicted nucleosome occupancy in tagged domains representing active enhancer states.
Notably, localization of both nucleosome-free and nucleosomal fragments within the enhancers was highly similar in different tagged domains (Fig. 7B,C). In spite of enhancer-wide changes in accessibility levels, the local distribution of the ATAC-seq signal showed strong correlation between active and inactive enhancer states (Fig. 7D). Likewise, the relative frequency of transposase cleavages along the enhancer was also highly conserved, regardless of differences in the composition of input TFs and identity of occupied TFBS along the AP axis (Fig. 7A,D).
In summary, conservation of the distribution of nucleosomal fragments along axis patterning enhancers suggests invariant positioning of the nucleosomes in different tagged domains. As demonstrated by high conservation of cleavage profiles, we conclude that the regional accessibility modulation along the AP axis does not result from differential occupancy of individual TF binding sites. Instead, our assay reveals larger-scale changes in the accessibility of linker DNA between the well-positioned nucleosomes.
Discussion
Axis patterning enhancers display regional modulation of chromatin accessibility
We assayed accessibility of axis patterning enhancers in the Drosophila blastoderm in order to determine whether their chromatin organization is uniform throughout the embryo, and thus invariant to the differential regulatory input, or whether it differs along the body axis, possibly implying an active interplay with the regulatory machinery. Our study provides clear evidence in support of the latter model. We demonstrate significant regional variation in chromatin accessibility that is strongly correlated with regulatory activity of the enhancers.
Our analysis revealed two superimposed properties of chromatin organization of axis patterning enhancers. First, the enhancers are characterized by open chromatin structure along the entire span of the assayed AP axis. This is consistent with the fact that they are targeted by patterning TFs throughout the entire embryo and that nucleosome depletion has been demonstrated in multiple paradigms to be essential for recognition of DNA binding sites. In addition, we observe a fine, quantitative regional modulation of the enhancers’ accessibility, which is correlated with their transcriptional output. Accessibility of the enhancers is elevated in regions of the embryo where they receive a net activating TF input and promote transcription of the target gene. Their accessibility is comparatively reduced when the enhancers receive a net repressive input but never decreases to background levels of the inaccessible genome. We report that this finer regional modulation of accessibility is specific to known and putative axis patterning enhancers. We conclude that differential accessibility is a signature of patterning cis-regulatory elements that receive differential regulatory input.
Independent mechanisms for establishment and modulation of enhancers’ accessibility
Our findings, together with other studies, suggest a model in which accessibility of axis patterning enhancers is uniformly established across the entire Drosophila embryo prior to zygotic genome activation and subsequently modulated by the regional activity of gene regulatory networks.
Axis patterning enhancers display highly accessible chromatin structure and reduced nucleosome occupancy prior to zygotic genome activation (Li et al. 2014; Blythe and Wieschaus 2016). This early opening of enhancers is mediated by a maternally deposited TF, Zelda, a pioneer TF that actively destabilizes nucleosomes or prevents their deposition after the initial rapid rounds of genome replication (Liang et al. 2008; Li et al. 2014). ChIP peaks of key regulators of the AP and DV patterning networks are most strongly enriched in a recognition motif of Zelda (Satija and Bradley 2012), and the protein has been shown to facilitate binding of these TFs to their target enhancers (Foo et al. 2014; Sun et al. 2015; Mir et al. 2017). In fact, Zelda binding sites have been proven necessary for the activity of synthetic enhancers in blastoderm embryos (Crocker et al. 2017).
The pioneering activity of Zelda therefore facilitates the access of TFs to their binding sites on axis patterning enhancers. Yet, the uniform distribution of this protein in the embryo falls short of providing spatial cues that could modulate accessibility regionally. Instead, positional information in the Drosophila embryo is encoded by concentration gradients of patterning TFs and, as a result, is processed by the enhancers only during operation of the gene regulatory networks after zygotic genome activation.
On this basis, and in the light of our new results, we propose that the basal level of accessibility of axis patterning enhancers is established already prior to zygotic genome activation (possibly by ubiquitous Zelda or other related mechanisms), thereby uniformly priming them for the subsequent TF input. The basal accessibility would allow enhancers to sample different concentrations and combinations of patterning TFs with no bias toward activating and repressing TFs, consistent with the high plasticity of the blastoderm embryo to ectopic regulatory input. In turn, differential TF occupancy would regionally modulate the basal Zelda-dependent enhancer accessibility to the variation we observed in our experiments. Therefore, rather than predetermining the activity of axis patterning enhancers, we propose that the reported regional modulations in chromatin accessibility result from differential activity of gene regulatory networks after zygotic genome activation.
Active interplay between patterning TFs and local chromatin organization
Our results suggest an active interplay between regulatory machinery and the local chromatin context of axis patterning enhancers. This supports and reinforces various lines of evidence from other studies that imply a role of patterning TFs in modulating epigenetic marks and nucleosome stability of their target CREs.
Our observed correlation between accessibility of enhancers and their transcriptional output is highly consistent with a study by Koenecke et al. (2017), who demonstrated that active and inactive enhancers of the DV network display different histone marks. Active enhancers are characterized by high levels of H3K27ac, and this is consistent with lysine acetylation being shown in other paradigms to reduce nucleosome stability while increasing accessibility of its linker DNA (Lee et al. 1993; Li and Kono 2016; Mishra et al. 2016). Li and Arnosti (2011) reported that overexpression of an individual repressor, Knirps, results in reduction of H4 acetylation over its target enhancer, thereby providing a link between TF occupancy and chromatin states. In fact, key TFs of the patterning networks have been shown to recruit histone acetyltransferases and deacetylases via their coactivators and corepressors, respectively (Mannervik 2014).
Regardless of whether histone modifications are the only mechanisms by which TFs could potentially modulate chromatin accessibility, the repressor Knirps has been demonstrated to increase local nucleosome occupancy (Li and Arnosti 2011), while the activator Bicoid has been reported to promote accessibility of its target enhancers (Hannon et al. 2017). While Haines and Eisen (2018) propose that Bicoid, as a maternally deposited activator with a broad anterior concentration gradient, plays a major role in modulating accessibility of enhancers, we speculate that this process is not exclusive to individual regulators. The correlation between regional accessibility and regulatory activity is strong for all considered axis patterning enhancers, regardless of their position along the assayed AP axis and, in consequence, the composition of input TFs.
In light of the aforementioned studies, we propose that activators and repressors of both AP and DV patterning networks share a common mechanism of action, with activators promoting and repressors reducing the accessibility of their target enhancers. As a result, we envision a dynamic interplay between these two opposing effects, with the final chromatin state being determined by the net regulatory input.
This then raises a question on the functional role of these local accessibility modulations of axis patterning enhancers. Hannon et al. (2017) proposed that Bicoid, by affecting accessibility of its enhancers in a concentration-dependent manner, provides information on their position along the embryonic axis. In line with this model, we hypothesize that the opposing effects on the enhancer's accessibility could serve as a mechanism for integrating positional information encoded in varying concentrations of multiple different activators and repressors. Furthermore, stabilization of nucleosomes and the resulting obstruction of activator binding sites has been proposed as a mechanism of action by repressors (Teif and Rippe 2011). We can envision, therefore, that local reduction of enhancers’ accessibility by repressors could serve as a mechanism for local quenching of activator TF and exclusion of their regulatory impact on the target promoter.
Methods
Generation of transgenic strains
UNC84-3×FLAG nuclear marker was generated by C-terminal fusion of unc-84 coding sequence (amplified from pMUH_unc84_ tdTFlag, a gift from Sean Eddy; Addgene plasmid #46024) (Henry et al. 2012) to a 25-aa peptide linker (HL4 from Arai et al. 2001) followed by a 3×FLAG tag (Sigma). Expression of the nuclear tag was driven by selected enhancers of Drosophila gap and pair-rule genes (amplified from genomic DNA, genomic coordinates as in Segal et al. 2008) that were separated by a 69-bp linker from the basal promoter: either Hs43 (Thummel and Pirrotta 1992) for enhancers of gap genes or DSCP (Pfeiffer et al. 2008) for enhancers of pair-rule genes. A complete list of all sequences and PCR primers is provided in Supplemental Methods.
All elements were assembled into expression constructs in the pBDP backbone (a gift from Gerald Rubin; Addgene plasmid #17566) (Pfeiffer et al. 2008), using Golden Gate Assembly (Engler et al. 2008). Additional BsaI recognition sites were introduced into the MCS of pBDP. Internal BsaI sites were removed by synonymous substitutions in coding sequences of unc-84 (G1989A and T2088C) and ampR gene (T720C). Transgenic flies were generated by insertion of the expression construct into the attP2 landing site (Groth et al. 2004). Lists of expression constructs and transgenic lines are provided in Supplemental Tables S1 and S3.
Collection and staging of embryos
Transgenic strains were expanded into population cages. After preclearing, embryos were collected on yeasted grape juice plates for 20 min and aged for an additional 150 min (25°C incubator), followed by harvesting and dechorionation (50% bleach, 2 min) for 20 min (25°C temperature-controlled room). The embryos were flash-frozen in liquid nitrogen exactly 190 min after the beginning of collections (2:50–3:10 h after egg laying). Approximately 100 µL of embryos were collected per transgenic strain and stored at −80°C until nuclei isolation.
Each final collection was fixed with formaldehyde and examined under the differential interference contrast (DIC) microscope to confirm that it represented stage 5 of embryogenesis.
Generation of ATAC-seq libraries
Affinity purification of tagged nuclei was performed according to Henry et al. 2012 with minor modifications, using monoclonal anti-FLAG M2 antibody (Sigma-Aldrich: F1804). ATAC-seq libraries were generated according to the standard protocol (Buenrostro et al. 2015) and sequenced on Illumina HiSeq 1500. Replicate experiments were performed with two different transgenic lines, each representing an independent integration event of the same construct in the attP2 landing site. See Supplemental Methods for the detailed protocols.
Data analysis
ATAC-seq reads were aligned to the reference genome (UCSC: dm3) using Bowtie 2 (Langmead and Salzberg 2012). ATAC-seq peaks were called with MACS2 (Zhang et al. 2008). High-confidence ATAC-seq peaks represent intersection of peaks from eight whole-embryo controls (Supplemental Table S4). Union of peaks comprises a comprehensive set of peaks from tagged domains and the whole-embryo control (Supplemental Table S5). Differential analysis of ATAC-seq peaks was performed with the DESeq2 package (Love et al. 2014) both on high-confidence peaks (Supplemental Table S6) and union of peaks (Supplemental Table S7). See Supplemental Methods for details of all data analysis steps.
Data access
All raw and processed sequencing data generated in this study have been submitted to the NCBI Gene Expression Omnibus (GEO; http://www.ncbi.nlm.nih.gov/geo/) under accession number GSE118240.
Supplementary Material
Acknowledgments
We thank Klaus Förstemann for his unflagging support with the project and feedback on the manuscript. We also thank the members of the Gaul lab for their advice and Laura Fischer for her assistance with generation of transgenic strains. This work was supported by Deutsche Forschungsgemeinschaft (DFG) fellowship GSC 1006 through the Graduate School of Quantitative Biosciences Munich (M.B., R.C., and U.G.) and SFB 1064 Chromatin Dynamics (A.E.S. and U.G.).
Author contributions: M.B. and U.G. designed the project. M.B. performed the experiments and analysis. A.E.S. prepared a control sample from genomic DNA. R.C. performed primary processing of sequencing data and peak calling. M.B. and N.G. interpreted the data, assisted by U.U. M.B. and N.G. wrote the manuscript, with feedback from all authors.
Footnotes
[Supplemental material is available for this article.]
Article published online before print. Article, supplemental material, and publication date are at http://www.genome.org/cgi/doi/10.1101/gr.242362.118.
Freely available online through the Genome Research Open Access option.
References
- Arai R, Ueda H, Kitayama A, Kamiya N, Nagamune T. 2001. Design of the linkers which effectively separate domains of a bifunctional fusion protein. Protein Eng Des Sel 14: 529–532. 10.1093/protein/14.8.529 [DOI] [PubMed] [Google Scholar]
- Bell O, Tiwari VK, Thomä NH, Schübeler D. 2011. Determinants and dynamics of genome accessibility. Nat Rev Genet 12: 554–564. 10.1038/nrg3017 [DOI] [PubMed] [Google Scholar]
- Blythe SA, Wieschaus EF. 2016. Establishment and maintenance of heritable chromatin structure during early drosophila embryogenesis. eLife 5: e20148 10.7554/eLife.20148 [DOI] [PMC free article] [PubMed] [Google Scholar]
- Bradley RK, Li XY, Trapnell C, Davidson S, Pachter L, Chu HC, Tonkin LA, Biggin MD, Eisen MB. 2010. Binding site turnover produces pervasive quantitative changes in transcription factor binding between closely related Drosophila species. PLoS Biol 8: e1000343 10.1371/journal.pbio.1000343 [DOI] [PMC free article] [PubMed] [Google Scholar]
- Buenrostro JD, Giresi PG, Zaba LC, Chang HY, Greenleaf WJ. 2013. Transposition of native chromatin for fast and sensitive epigenomic profiling of open chromatin, DNA-binding proteins and nucleosome position. Nat Methods 10: 1213–1218. 10.1038/nmeth.2688 [DOI] [PMC free article] [PubMed] [Google Scholar]
- Buenrostro JD, Wu B, Chang HY, Greenleaf WJ. 2015. ATAC-seq: a method for assaying chromatin accessibility genome-wide. Curr Protoc Mol Biol 109: 21.29.1–9. 10.1002/0471142727.mb2129s109 [DOI] [PMC free article] [PubMed] [Google Scholar]
- Carroll SB, Winslow GM, Twombly VJ, Scott MP. 1987. Genes that control dorsoventral polarity affect gene expression along the anteroposterior axis of the Drosophila embryo. Development 99: 327–332. [DOI] [PubMed] [Google Scholar]
- Celniker SE, Dillon LAL, Gerstein MB, Gunsalus KC, Henikoff S, Karpen GH, Kellis M, Lai EC, Lieb JD, MacAlpine DM, et al. 2009. Unlocking the secrets of the genome. Nature 459: 927–930. 10.1038/459927a [DOI] [PMC free article] [PubMed] [Google Scholar]
- Crocker J, Tsai A, Stern DL. 2017. A fully synthetic transcriptional platform for a multicellular eukaryote. Cell Rep 18: 287–296. 10.1016/j.celrep.2016.12.025 [DOI] [PubMed] [Google Scholar]
- Cusanovich DA, Reddington JP, Garfield DA, Daza RM, Aghamirzaie D, Marco-Ferreres R, Pliner HA, Christiansen L, Qiu X, Steemers FJ, et al. 2018. The cis-regulatory dynamics of embryonic development at single-cell resolution. Nature 555: 538–542. 10.1038/nature25981 [DOI] [PMC free article] [PubMed] [Google Scholar]
- Deal RB, Henikoff S. 2011. The INTACT method for cell type–specific gene expression and chromatin profiling in Arabidopsis thaliana. Nat Protoc 6: 56–68. 10.1038/nprot.2010.175 [DOI] [PMC free article] [PubMed] [Google Scholar]
- Driever W, Thoma G, Nüsslein-Volhard C. 1989. Determination of spatial domains of zygotic gene expression in the Drosophila embryo by the affinity of binding sites for the bicoid morphogen. Nature 340: 363–367. 10.1038/340363a0 [DOI] [PubMed] [Google Scholar]
- Eaton ML, Prinz JA, MacAlpine HK, Tretyakov G, Kharchenko P V, MacAlpine DM. 2011. Chromatin signatures of the Drosophila replication program. Genome Res 21: 164–174. 10.1101/gr.116038.110 [DOI] [PMC free article] [PubMed] [Google Scholar]
- Engler C, Kandzia R, Marillonnet S. 2008. A one pot, one step, precision cloning method with high throughput capability. PLoS One 3: e3647 10.1371/journal.pone.0003647 [DOI] [PMC free article] [PubMed] [Google Scholar]
- Fakhouri WD, Ay A, Sayal R, Dresch J, Dayringer E, Arnosti DN. 2010. Deciphering a transcriptional regulatory code: modeling short-range repression in the Drosophila embryo. Mol Syst Biol 6: 341 10.1038/msb.2009.97 [DOI] [PMC free article] [PubMed] [Google Scholar]
- Fisher WW, Li JJ, Hammonds AS, Brown JB, Pfeiffer BD, Weiszmann R, MacArthur S, Thomas S, Stamatoyannopoulos JA, Eisen MB, et al. 2012. DNA regions bound at low occupancy by transcription factors do not drive patterned reporter gene expression in Drosophila. Proc Natl Acad Sci 109: 21330–21335. 10.1073/pnas.1209589110 [DOI] [PMC free article] [PubMed] [Google Scholar]
- Foo SM, Sun Y, Lim B, Ziukaite R, O'Brien K, Nien CY, Kirov N, Shvartsman SY, Rushlow CA. 2014. Zelda potentiates morphogen activity by increasing chromatin accessibility. Curr Biol 24: 1341–1346. 10.1016/j.cub.2014.04.032 [DOI] [PMC free article] [PubMed] [Google Scholar]
- Gallo SM, Gerrard DT, Miner D, Simich M, Des Soye B, Bergman CM, Halfon MS. 2011. REDfly v3.0: toward a comprehensive database of transcriptional regulatory elements in Drosophila. Nucleic Acids Res 39: D118–D123. 10.1093/nar/gkq999 [DOI] [PMC free article] [PubMed] [Google Scholar]
- Gramates LS, Marygold SJ, Dos Santos G, Urbano JM, Antonazzo G, Matthews BB, Rey AJ, Tabone CJ, Crosby MA, Emmert DB, et al. 2017. FlyBase at 25: looking to the future. Nucleic Acids Res 45: D663–D671. 10.1093/nar/gkw1016 [DOI] [PMC free article] [PubMed] [Google Scholar]
- Groth AC, Fish M, Nusse R, Calos MP. 2004. Construction of transgenic Drosophila by using the site-specific integrase from phage φC31. Genetics 166: 1775–1782. 10.1534/genetics.166.4.1775 [DOI] [PMC free article] [PubMed] [Google Scholar]
- Guertin MJ, Lis JT. 2013. Mechanisms by which transcription factors gain access to target sequence elements in chromatin. Curr Opin Genet Dev 23: 116–123. 10.1016/j.gde.2012.11.008 [DOI] [PMC free article] [PubMed] [Google Scholar]
- Haines JE, Eisen MB. 2018. Patterns of chromatin accessibility along the anterior-posterior axis in the early Drosophila embryo. PLoS Genet 14: e1007367 10.1371/journal.pgen.1007367 [DOI] [PMC free article] [PubMed] [Google Scholar]
- Hannon CE, Blythe SA, Wieschaus EF. 2017. Concentration dependent chromatin states induced by the bicoid morphogen gradient. eLife 6: e28275 10.7554/eLife.28275 [DOI] [PMC free article] [PubMed] [Google Scholar]
- He X, Samee MAH, Blatti C, Sinha S. 2010. Thermodynamics-based models of transcriptional regulation by enhancers: the roles of synergistic activation, cooperative binding and short-range repression. PLoS Comput Biol 6: e1000935 10.1371/journal.pcbi.1000935 [DOI] [PMC free article] [PubMed] [Google Scholar]
- Henry GL, Davis FP, Picard S, Eddy SR. 2012. Cell type–specific genomics of Drosophila neurons. Nucleic Acids Res 40: 9691–9704. 10.1093/nar/gks671 [DOI] [PMC free article] [PubMed] [Google Scholar]
- Jaeger J. 2011. The gap gene network. Cell Mol Life Sci 68: 243–274. 10.1007/s00018-010-0536-y [DOI] [PMC free article] [PubMed] [Google Scholar]
- Kazemian M, Blatti C, Richards A, McCutchan M, Wakabayashi-Ito N, Hammonds AS, Celniker SE, Kumar S, Wolfe SA, Brodsky MH, et al. 2010. Quantitative analysis of the Drosophila segmentation regulatory network using pattern generating potentials. PLoS Biol 8: e1000456 10.1371/journal.pbio.1000456 [DOI] [PMC free article] [PubMed] [Google Scholar]
- Koenecke N, Johnston J, He Q, Meier S, Zeitlinger J. 2017. Drosophila poised enhancers are generated during tissue patterning with the help of repression. Genome Res 27: 64–74. 10.1101/gr.209486.116 [DOI] [PMC free article] [PubMed] [Google Scholar]
- Kvon EZ, Kazmar T, Stampfel G, Yáñez-Cuna JO, Pagani M, Schernhuber K, Dickson BJ, Stark A. 2014. Genome-scale functional characterization of Drosophila developmental enhancers in vivo. Nature 512: 91–95. 10.1038/nature13395 [DOI] [PubMed] [Google Scholar]
- Langmead B, Salzberg SL. 2012. Fast gapped-read alignment with Bowtie 2. Nat Methods 9: 357–359. 10.1038/nmeth.1923 [DOI] [PMC free article] [PubMed] [Google Scholar]
- Lee DY, Hayes JJ, Pruss D, Wolffe AP. 1993. A positive role for histone acetylation in transcription factor access to nucleosomal DNA. Cell 72: 73–84. 10.1016/0092-8674(93)90051-Q [DOI] [PubMed] [Google Scholar]
- Levine M. 2010. Transcriptional enhancers in animal development and evolution. Curr Biol 20: R754–R763. 10.1016/j.cub.2010.06.070 [DOI] [PMC free article] [PubMed] [Google Scholar]
- Levine M, Davidson E. 2005. Gene regulatory networks for development. Proc Natl Acad Sci 102: 4936–4942. 10.1073/pnas.0408031102 [DOI] [PMC free article] [PubMed] [Google Scholar]
- Li LM, Arnosti DN. 2011. Long- and short-range transcriptional repressors induce distinct chromatin states on repressed genes. Curr Biol 21: 406–412. 10.1016/j.cub.2011.01.054 [DOI] [PMC free article] [PubMed] [Google Scholar]
- Li Z, Kono H. 2016. Distinct roles of histone H3 and H2A tails in nucleosome stability. Sci Rep 6: 31437 10.1038/srep31437 [DOI] [PMC free article] [PubMed] [Google Scholar]
- Li XY, MacArthur S, Bourgon R, Nix D, Pollard DA, Iyer VN, Hechmer A, Simirenko L, Stapleton M, Luengo Hendriks CL, et al. 2008. Transcription factors bind thousands of active and inactive regions in the Drosophila blastoderm. PLoS Biol 6: e27 10.1371/journal.pbio.0060027 [DOI] [PMC free article] [PubMed] [Google Scholar]
- Li XY, Harrison MM, Villalta JE, Kaplan T, Eisen MB. 2014. Establishment of regions of genomic activity during the Drosophila maternal to zygotic transition. eLife 3: e03737 10.7554/eLife.03737 [DOI] [PMC free article] [PubMed] [Google Scholar]
- Liang HL, Nien CY, Liu HY, Metzstein MM, Kirov N, Rushlow C. 2008. The zinc-finger protein Zelda is a key activator of the early zygotic genome in Drosophila. Nature 456: 400–403. 10.1038/nature07388 [DOI] [PMC free article] [PubMed] [Google Scholar]
- Love MI, Huber W, Anders S. 2014. Moderated estimation of fold change and dispersion for RNA-seq data with DESeq2. Genome Biol 15: 550. 10.1186/s13059-014-0550-8 [DOI] [PMC free article] [PubMed] [Google Scholar]
- MacArthur S, Li XY, Li J, Brown JB, Cheng HC, Zeng L, Grondona BP, Hechmer A, Simirenko L, Keränen SVE, et al. 2009. Developmental roles of 21 Drosophila transcription factors are determined by quantitative differences in binding to an overlapping set of thousands of genomic regions. Genome Biol 10: R80 10.1186/gb-2009-10-7-r80 [DOI] [PMC free article] [PubMed] [Google Scholar]
- Mannervik M. 2014. Control of Drosophila embryo patterning by transcriptional co-regulators. Exp Cell Res 321: 47–57. 10.1016/j.yexcr.2013.10.010 [DOI] [PubMed] [Google Scholar]
- Mir M, Reimer A, Haines JE, Li XY, Stadler M, Garcia H, Eisen MB, Darzacq X. 2017. Dense Bicoid hubs accentuate binding along the morphogen gradient. Genes Dev 31: 1784–1794. 10.1101/gad.305078.117 [DOI] [PMC free article] [PubMed] [Google Scholar]
- Mishra LN, Pepenella S, Rogge R, Hansen JC, Hayes JJ. 2016. Acetylation mimics within a single nucleosome alter local DNA accessibility in compacted nucleosome arrays. Sci Rep 6: 34808 10.1038/srep34808 [DOI] [PMC free article] [PubMed] [Google Scholar]
- The modENCODE Consortium, Roy S, Ernst J, Kharchenko PV, Kheradpour P, Negre N, Eaton ML, Landolin JM, Bristow CA, Ma L, et al. 2010. Identification of functional elements and regulatory circuits by Drosophila modENCODE. Science 330: 1787–1797. 10.1126/science.1198374 [DOI] [PMC free article] [PubMed] [Google Scholar]
- Moussian B, Roth S. 2005. Dorsoventral axis formation in the Drosophila embryo—shaping and transducing a morphogen gradient. Curr Biol 15: R887–R899. 10.1016/j.cub.2005.10.026 [DOI] [PubMed] [Google Scholar]
- Nasiadka A, Dietrich BH, Krause HM. 2002. Anterior–posterior patterning in the Drosophila embryo. Adv Dev Biol Biochem 12: 155–204. 10.1016/S1569-1799(02)12027-2 [DOI] [Google Scholar]
- Pearson JC, McKay DJ, Lieb JD, Crews ST. 2016. Chromatin profiling of Drosophila CNS subpopulations identifies active transcriptional enhancers. Development 143: 3723–3732. 10.1242/dev.136895 [DOI] [PMC free article] [PubMed] [Google Scholar]
- Pfeiffer BD, Jenett A, Hammonds AS, Ngo T-TB, Misra S, Murphy C, Scully A, Carlson JW, Wan KH, Laverty TR, et al. 2008. Tools for neuroanatomy and neurogenetics in Drosophila. Proc Natl Acad Sci 105: 9715–9720. 10.1073/pnas.0803697105 [DOI] [PMC free article] [PubMed] [Google Scholar]
- Satija R, Bradley RK. 2012. The TAGteam motif facilitates binding of 21 sequence-specific transcription factors in the Drosophila embryo. Genome Res 22: 656–665. 10.1101/gr.130682.111 [DOI] [PMC free article] [PubMed] [Google Scholar]
- Schep AN, Buenrostro JD, Denny SK, Schwartz K, Sherlock G, Greenleaf WJ. 2015. Structured nucleosome fingerprints enable high-resolution mapping of chromatin architecture within regulatory regions. Genome Res 25: 1757–1770. 10.1101/gr.192294.115 [DOI] [PMC free article] [PubMed] [Google Scholar]
- Schroeder MD, Pearce M, Fak J, Fan H, Unnerstall U, Emberly E, Rajewsky N, Siggia ED, Gaul U. 2004. Transcriptional control in the segmentation gene network of Drosophila. PLoS Biol 2: e271 10.1371/journal.pbio.0020271 [DOI] [PMC free article] [PubMed] [Google Scholar]
- Segal E, Raveh-Sadka T, Schroeder M, Unnerstall U, Gaul U. 2008. Predicting expression patterns from regulatory sequence in Drosophila segmentation. Nature 451: 535–540. 10.1038/nature06496 [DOI] [PubMed] [Google Scholar]
- Sun Y, Nien CY, Chen K, Liu HY, Johnston J, Zeitlinger J, Rushlow C. 2015. Zelda overcomes the high intrinsic nucleosome barrier at enhancers during Drosophila zygotic genome activation. Genome Res 25: 1703–1714. 10.1101/gr.192542.115 [DOI] [PMC free article] [PubMed] [Google Scholar]
- Surkova S, Kosman D, Kozlov K, Manu, Myasnikova E, Samsonova AA, Spirov A, Vanario-Alonso CE, Samsonova M, Reinitz J. 2008. Characterization of the Drosophila segment determination morphome. Dev Biol 313: 844–862. 10.1016/j.ydbio.2007.10.037 [DOI] [PMC free article] [PubMed] [Google Scholar]
- Teif VB, Rippe K. 2011. Nucleosome mediated crosstalk between transcription factors at eukaryotic enhancers. Phys Biol 8: 4–8. 10.1088/1478-3975/8/4/044001 [DOI] [PubMed] [Google Scholar]
- Thomas S, Li XY, Sabo PJ, Sandstrom R, Thurman RE, Canfield TK, Giste E, Fisher W, Hammonds A, Celniker SE, et al. 2011. Dynamic reprogramming of chromatin accessibility during Drosophila embryo development. Genome Biol 12: R43 10.1186/gb-2011-12-5-r43 [DOI] [PMC free article] [PubMed] [Google Scholar]
- Thummel CS, Pirrotta V. 1992. New pCaSpeR P element vectors. Dros Info Serv 71: 150. [Google Scholar]
- Zeitlinger J, Zinzen RP, Stark A, Kellis M, Zhang H, Young RA, Levine M. 2007. Whole-genome ChIP–chip analysis of Dorsal, Twist, and Snail suggests integration of diverse patterning processes in the Drosophila embryo. Genes Dev 21: 385–390. 10.1101/gad.1509607 [DOI] [PMC free article] [PubMed] [Google Scholar]
- Zhang Y, Liu T, Meyer CA, Eeckhoute J, Johnson DS, Bernstein BE, Nussbaum C, Myers RM, Brown M, Li W, et al. 2008. Model-based Analysis of ChIP-Seq (MACS). Genome Biol 9: R137 10.1186/gb-2008-9-9-r137 [DOI] [PMC free article] [PubMed] [Google Scholar]
Associated Data
This section collects any data citations, data availability statements, or supplementary materials included in this article.