

Lahmann et al. show that Hes1 controls the balance between proliferation and differentiation of activated muscle stem cells in both developing and regenerating muscle. Hes1 is expressed in an oscillatory manner in activated stem cells, where it drives the oscillatory expression of MyoD.
Keywords: ultradian oscillation, MyoD, muscle stem cell, Hes1
Abstract
The balance between proliferation and differentiation of muscle stem cells is tightly controlled, ensuring the maintenance of a cellular pool needed for muscle growth and repair. We demonstrate here that the transcriptional regulator Hes1 controls the balance between proliferation and differentiation of activated muscle stem cells in both developing and regenerating muscle. We observed that Hes1 is expressed in an oscillatory manner in activated stem cells where it drives the oscillatory expression of MyoD. MyoD expression oscillates in activated muscle stem cells from postnatal and adult muscle under various conditions: when the stem cells are dispersed in culture, when they remain associated with single muscle fibers, or when they reside in muscle biopsies. Unstable MyoD oscillations and long periods of sustained MyoD expression are observed in differentiating cells. Ablation of the Hes1 oscillator in stem cells interfered with stable MyoD oscillations and led to prolonged periods of sustained MyoD expression, resulting in increased differentiation propensity. This interfered with the maintenance of activated muscle stem cells, and impaired muscle growth and repair. We conclude that oscillatory MyoD expression allows the cells to remain in an undifferentiated and proliferative state and is required for amplification of the activated stem cell pool.
Skeletal muscle has a remarkable regenerative capacity, which is attributed to tissue resident stem cells (Lepper et al. 2011; Sambasivan et al. 2011). Stem cells of the skeletal muscle represent a small cell population in the postnatal muscle that were originally defined as satellite cells by their anatomical location between the basal lamina and plasma membrane of the myofiber (Mauro 1961). These stem cells derive from myogenic progenitor cells and are marked by Pax7 (Seale et al. 2004; Gros et al. 2005; Kassar-Duchossoy et al. 2005; Relaix et al. 2005). They proliferate during the postnatal period and generate differentiating cells for muscle growth. In the adult, muscle stem cells are quiescent but become activated and proliferate upon muscle injury to generate new muscle tissue. Understanding the mechanisms controlling the balance between proliferation and differentiation of muscle stem cells holds promise for regenerative medicine and is the subject of intense research.
Stem cell maintenance depends on exogenous signals. Notch signaling plays an important role in their maintenance in both development and the adult. Genetic ablation of Notch signaling by mutation of the genes encoding the ligand Dll1 or the transcriptional mediator of Notch signals, RBPj, results in up-regulated MyoD expression, premature myogenic differentiation, and the depletion of the muscle stem cell pool (Schuster-Gossler et al. 2007; Vasyutina et al. 2007; Bjornson et al. 2012; Bröhl et al. 2012; Mourikis et al. 2012b; Czajkowski et al. 2014). Conversely, forced Notch activation suppresses myogenic differentiation (Kopan et al. 1994; Shawber et al. 1996; Kuroda et al. 1999; Delfini et al. 2000; Hirsinger et al. 2001; Conboy and Rando 2002; Mourikis et al. 2012a). Available evidence indicates that suppression of MyoD expression is an important aspect of Notch signaling, and that uncontrolled MyoD expression is responsible for premature myogenic differentiation and the depletion of the muscle stem cell pool (Bröhl et al. 2012).
The bHLH transcription factor MyoD is a master regulator of myogenic differentiation. Ectopic expression of MyoD in fibroblasts suffices to induce myogenic differentiation, demonstrating that sustained expression of MyoD activates the myogenic program (Weintraub et al. 1991). In vivo, MyoD cooperates with Myf5 and Mrf4 to control myogenesis, and MyoD is required for efficient muscle regeneration (Megeney et al. 1996; Kassar-Duchossoy et al. 2004). Many molecular inputs that modulate the balance between proliferation and differentiation in muscle stem cells, among them Notch signals, regulate MyoD and, thus, cellular behavior. MyoD is up-regulated when Notch signaling is ablated during development, leading to the loss and premature differentiation of myogenic progenitor cells. This is demonstrated by the fact that muscle stem cells are maintained in double mutants where both MyoD and Notch signals are ablated (Bröhl et al. 2012; Czajkowski et al. 2014). However, the molecular mechanism by which the Notch pathway suppresses MyoD function and/or expression has remained open (Buas and Kadesch 2010).
Recent studies in neuronal precursor cells demonstrate that Notch signaling components are expressed in an oscillatory manner, in particular the Notch ligand Dll1 and the Notch target Hes1 (Shimojo et al. 2008). Furthermore, the protein product of the pro-neural gene Ascl1 oscillates in neuronal precursor cells (Imayoshi et al. 2013). These molecules oscillate with short periods of 2–3 h (Shimojo et al. 2008; Imayoshi et al. 2013). The dynamics of regulatory factors encodes information (Purvis et al. 2012). For instance, oscillatory or sustained Ascl1 expression determines whether a cell will maintain its progenitor status or differentiate (Shimojo et al. 2008; Imayoshi et al. 2013). Moreover, oscillatory signals allow for more stable network responses than impulse signals that are more difficult to distinguish from noise (Lipan and Wong 2005).
While investigating Notch signaling and target genes in proliferating muscle stem cells from postnatal or regenerating muscle, we observed that Hes1 and the myogenic factor MyoD show remarkably heterogeneous protein levels in proliferating muscle stem cells. Inspired by this finding, we tested whether regulatory molecules oscillate in muscle stem cells. We show that both Hes1 and MyoD oscillate in cultured proliferating muscle stem cells by directly tracking protein dynamics using real-time imaging of muscle stem cells expressing luciferase-reporters. Activated muscle stem cells on isolated muscle fibers and in muscle biopsies also displayed oscillatory MyoD expression. The oscillatory period was short, i.e., ∼3 h, and thus much shorter than the cell cycle or circadian rhythm. In contrast, MyoD expression was sustained in differentiating cells. We also demonstrate that Hes1 drives oscillatory MyoD expression: MyoD oscillations become unstable and MyoD is sustained when Hes1 is ablated. This was accompanied by a higher propensity of Hes1 mutant cells to differentiate. Our analysis indicates that the oscillatory expression of MyoD allows activated myogenic stem cells to remain in a proliferative state. However, when MyoD oscillations become unstable and are replaced by sustained MyoD expression, cells are driven out of the proliferating state and differentiate. Thus, oscillatory MyoD expression allows for the amplification of the activated stem cell pool to ensure correct muscle growth and regeneration.
Results
Notch signals suppress myogenic differentiation and are required for the maintenance of the muscle stem cell pool (Vasyutina et al. 2007; Bröhl et al. 2012). The Hes/Hey family of transcriptional repressors are important target genes of the Notch pathway (Weber et al. 2014). Various members of the Hes/Hey family are activated by Notch signaling in muscle stem cells (Supplemental Fig. S1A; see also Mourikis et al. 2012b). We systematically analyzed mice with mutations in genes of the Hes/Hey family in order to identify the functionally dominant members of this family in skeletal muscle. Ablation of Hes1 (coHes1 mutant mice; see also Supplemental Fig. S1B; Supplemental Material) affected the number of Pax7+ muscle stem cells in late fetal development. In other tested mutants (i.e., Hey1, Hes5, and Hes7), no pronounced changes in the muscle or muscle stem cell numbers were apparent (Supplemental Fig. S1B–H). Our results indicate that Hes1 is an important and dominant member of the Hes/Hey family in the skeletal muscle although functional redundancy between Hes1 and other members of the family might exist.
Further analyses demonstrated that the coHes1 mutation had a subtle effect on the overall muscle size at birth but severely affected muscle growth during postnatal development (Fig. 1A–D). This was quantified by determining the weight of the tibialis anterior (TA) muscle relative to the weight of the entire body, and by counting nuclei present in myofibers (Fig. 1I,J). Furthermore, the numbers of Pax7+ stem cells was reduced more strongly at postnatal day 28 (P28) than at P0 (Fig. 1E,F,K). The loss of Pax7+ cells was accompanied by an increase in the proportion of cells expressing MyoD protein, and by a mild increase in MyoD mRNA at P7 (Fig. 1G,H,L,M). Direct comparison of MyoD protein levels indicated a 1.5-fold increase in the coHes1 mutant mice (Supplemental Fig. S1J). Changes in proliferation or apoptosis were not detected (proportion of Pax7+ cells expressing Ki67 [Ki67+Pax7+/Pax7+] in control and mutant embryonic day 17 [E17] animals, 90.2% ± 3.3% and 91.6% ± 4.2%, respectively; cleaved Caspase3+ cells per area in control and mutant E17.5 animals, 10.71 ± 4.3 and 11.19 ± 6.81, respectively). This indicated that postnatal coHes1 mutant muscle stem cells have a higher propensity to differentiate. In conclusion, the mutation of Hes1 has little effect on prenatal muscle but severely affects postnatal muscle growth.
Figure 1.
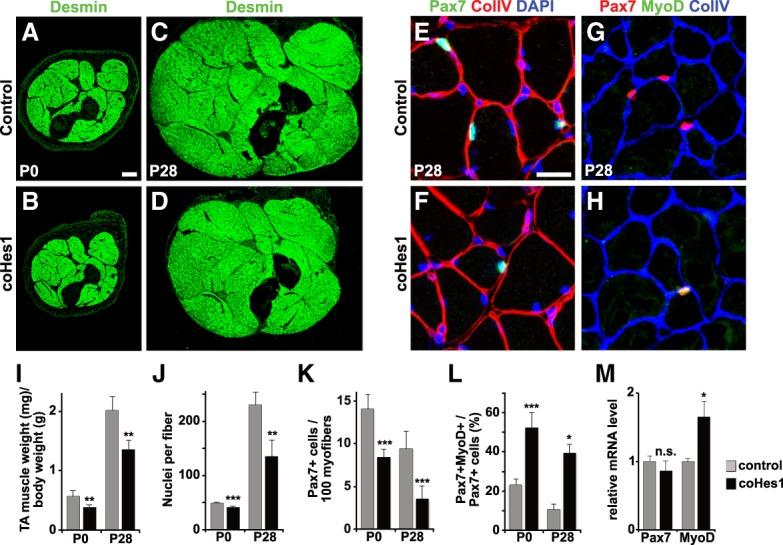
Hes1 controls postnatal muscle growth by suppressing differentiation of muscle stem cells. (A–D) Immunohistological analysis of limb muscle size in control and coHes1 mutant mice at P0 and P28 using anti-desmin antibodies to identify muscle fibers. (E–H) Immunohistological analysis of muscle tissue from control and coHes1 mutant mice (P28) using Pax7 and collagen V antibodies (E,F) and MyoD and collagen V antibodies (G,H) for identification of myogenic cells; DAPI was used as a counterstain. (I) Ratio of the tibialis anterior weight to the body weight of control and coHes1 mutant mice. (J) Number of nuclei in isolated muscle fibers of control and coHes1 mutant mice (n = 3; mean ± SEM). (K) Number of Pax7+ cells per 100 muscle fibers at P0 and P28 in control and coHes1 mutant muscle (P0 n = 6; P28 n = 5; mean ± SEM). (L) Quantification of cells that coexpress MyoD and Pax7 (MyoD+ Pax7+/Pax7+) in control and coHes1 mutant muscle at P0 and P28 (P0 n = 5; P28 n = 3; mean ± SEM). (M) Pax7 and MyoD mRNA levels in isolated muscle stem cells of control and coHes1 mutant muscle at P0 (mean ± SEM; n = 4). Scale bars: (A–D) 500 µm, (E–H) 20 µm. For statistical analysis, we performed unpaired two-tailed Student's t-tests. (*) P < 0.05; (**) P < 0.01; (***) P < 0.001; (n.s.) nonsignificant.
Oscillatory Hes1 and MyoD expression in proliferating muscle stem cells
We noted that Hes1 protein levels were markedly heterogeneous in freshly isolated postnatal muscle stem cells that had been cultured for short periods (see Material and Methods for culture conditions). Similarly, MyoD and Pax7 protein levels were heterogeneous. Pax7 was present in most cells (92% ± 2%), indicating that they had remained in an undifferentiated state. Cells with high Hes1 levels also displayed high Pax7 protein levels, but MyoD levels did not correlate with the levels of Pax7 or Hes1 (Fig. 2A–E). Similar heterogeneity and correlations were observed in postnatal muscle stem cells in vivo (Fig. 2F–J), as well as in activated muscle stem cells that were freshly isolated from regenerating muscle of adult mice (Supplemental Fig. S2A–E). MyoD protein levels were reported to vary during the cell cycle in C2C12 cells that were synchronized (Kitzmann et al. 1998; Batonnet-Pichon et al. 2006). We did not observe any correlation between Hes1/MyoD protein levels and cell cycle markers in the nonsynchronized cells cultured for short periods (Supplemental Fig. S2F).
Figure 2.

Hes1 and MyoD protein expression oscillates in proliferating muscle cells. (A–C) Immunohistology shows heterogeneous Pax7 and MyoD protein levels in cultured muscle stem cells; DAPI was used as a counterstain. Displayed are Hes1/DAPI (A), Hes1/MyoD (B), and Hes1/Pax7 (C) signals of the same stained image; false colors were assigned for better signal visualization. (D,E) Correlation analysis of MyoD and Hes1 (n = 1779) (D) and Pax7 and Hes1 (n = 2327) (E) protein levels; every dot represents one cell. (F–H) Immunohistology shows heterogeneous Pax7 and MyoD protein levels in proliferating muscle stem cells in vivo; DAPI was used as a counterstain. Arrows point to myogenic cells that express Pax7+ and/or MyoD; note that Hes1 is also present in other cell types. (I,J) Correlation analysis of MyoD and Hes1 (n = 493) (I) and Pax7 and Hes1 (n = 493) (J) protein levels; myogenic cells defined by Pax7 expression were analyzed. (K) Schematic display of MyoD-Luc2 fusion gene construct. (L,M) Bioluminescence images of a MyoD-Luc2 muscle stem cell isolated from newborn mice and quantification of the bioluminescence signal. (N,O) Bioluminescence images of an adult MyoD-Luc2 muscle stem cell and quantification of the bioluminescence signal. (P,Q) Bioluminescence images and quantification of the bioluminescence signals of a cultured adult MyoD-Luc2 muscle stem cell over a period of 25 h; the cell differentiates and undergoes fusion. Arrows indicate when growth medium was changed to differentiation medium and the time of fusion. Bars: A–C,F–H, 20 µm.
We hypothesized that this marked heterogeneity of protein levels might be caused by oscillatory expression, and directly tested whether Hes1 and MyoD oscillate. A reporter construct in which the Hes1 promoter drives a short-lived firefly luciferase was transfected into isolated muscle stem cells obtained from postnatal mice, and luciferase levels were visualized by time-lapse bioluminescence imaging over prolonged periods (Supplemental Fig. S2G–J; Supplemental Movie S1). We observed oscillatory bioluminescence, indicating that the activity of the Hes1 promoter oscillates. The mean oscillatory period was 2–3 h; i.e., much faster than cell cycle or circadian oscillations (Supplemental Fig. S2J). We directly tested whether Hes1 protein oscillates by isolating and imaging muscle progenitor cells from postnatal mice that express a Hes1-luciferase fusion protein (Imayoshi et al. 2013). Again, we observed oscillatory bioluminescence (Supplemental Fig. S2K–M; Supplemental Movie S2). Moreover, oscillations were asynchronous; i.e., neighboring cells displayed different oscillation phases. Often, oscillations were interrupted but recommenced after variable periods and in one time window of observation around 30% of the cells displayed oscillatory Hes1 expression. Cell division (cytokinesis) was observed in cells that displayed oscillatory Hes1 expression (Supplemental Fig. S2N,O). We conclude that Hes1 transcripts and Hes1 protein oscillate in cultured muscle stem cells, which accounts for the observed heterogeneity of Hes1 protein.
To directly test whether MyoD expression oscillates in muscle stem cells, we generated a mouse strain in which luciferase (Luc2 cDNA) was inserted in frame into the 3′ coding sequence of MyoD (MyoD-Luc2; Fig. 2K; Supplemental Fig. S3A). Comparison of MyoD protein and Luc2 transcripts demonstrated widespread overlap in the developing muscle (Supplemental Fig. S3B–D). Muscle stem cells freshly isolated from MyoD-Luc2 neonatal as well as adult mice were cultured for short periods and visualized by bioluminescence imaging over 24 h. This demonstrated that MyoD-Luc2 bioluminescence oscillated in cells isolated from postnatal and adult mice displaying average periods 158 min ± 6 min and 195 min ± 10 min in postnatal and adult stem cells, respectively (Fig. 2L–O; Supplemental Movie S4, S5; see Supplemental Fig. S3E–G for additional tracks). Oscillations were often interrupted but recommenced after variable periods. Furthermore, oscillations of neighboring cells were asynchronous. Cell division (cytokinesis) was observed during different phases of MyoD oscillatory cycles, although cytokinesis was more frequently observed when MyoD-Luc2 bioluminescence signals were high (Supplemental Fig. S3E–G).
Next we tested the dynamics of MyoD-Luc2 protein expression during differentiation. Muscle stem cells were incubated in growth medium containing 15% fetal calf serum. After 6 h the medium was replaced with a differentiation medium containing 5% horse serum. We selectively analyzed cells that fused during the observation period. Before fusion, oscillations were interrupted and we observed long periods of sustained MyoD-Luc2 bioluminescence (Fig. 2P,Q and Supplemental Fig. S3H,I for additional examples). Upon fusion, the MyoD-Luc2 bioluminescence signal abruptly dropped. We conclude that MyoD expression is increased and sustained when muscle stem cells differentiate.
Hes1 controls MyoD expression and MyoD oscillation
The basic helix–loop–helix protein Hes1 is a transcriptional repressor, meaning that Hes1 protein suppresses its own transcription, providing a negative feedback loop that is necessary for oscillatory expression (Kageyama et al. 2010). We hypothesized that Hes1 might also suppress MyoD, thereby driving MyoD oscillations (Fig. 3A). We used mathematical modeling to predict the effect of Hes1 oscillation on the dynamics of MyoD expression, and extended a previously described model for Hes1 oscillation relying on the published parameters of MyoD mRNA and protein stability (Hirata et al. 2002; Figueroa et al. 2003; Lingbeck et al. 2003). As observed experimentally, the model indicated that Hes1 oscillation results in the oscillatory expression of MyoD, and that Hes1 and MyoD oscillations possess similar oscillatory periods (Fig. 3B). In accordance with the experimental results (Fig. 2D,I), the model predicted a poor correlation between Hes1 and MyoD protein levels (R2= 0.015; Fig. 3C).
Figure 3.

Hes1 suppresses MyoD expression. (A) Scheme of the regulatory model used. Hes1 protein suppresses expression of Hes1 and MyoD genes. (B) Predicted dynamics of MyoD and Hes1 proteins using the mathematical model described in the Material and Methods. (C) Predicted levels of Hes1 and MyoD protein for 500 cells at random time points. We included noisy parameters into the prediction, which were taken from a Gaussian distribution with a standard deviation of 5% and a cutoff of three standard deviations that removed ∼0.3% of the outliers. (D,E) Proliferating muscle stem cells were transfected with a mCherry containing control construct or a HA-tagged Hes1 expression construct. Transfected cells were identified by mCherry fluorescence or anti-HA antibodies, respectively, and analyzed using MyoD specific antibodies. DAPI was used as counterstain. (F–H) Quantification of transfected cells expressing Pax7 (H), MyoD (I), or MyoG (J) (n = 3, mean ± SEM). (I) Scheme of the mouse MyoD gene, including known enhancer sequences (core enhancer [CE], distal regulatory region [DRR], and proximal region [PRR]) and an additional conserved sequence with predicted Hes1-binding sites located 10.5 kb upstream of MyoD transcription start site. NC1, NC2 correspond to the sequences used as negative controls. Brown bars below the gene and promoter represent conserved regions. (J) ChIP-PCR experiments analyzing Hes1 binding to the indicated sequences of MyoD (n = 3; mean ± SEM). Scale bars: (D,E) 500 µm. For statistical analysis, unpaired two-tailed Student's t-test was performed. (*) P < 0.05; (**) P < 0.01; (n.s.) nonsignificant.
Next, we tested whether Hes1 can directly repress MyoD. Overexpression of an HA-tagged Hes1 expressing plasmid resulted in robust down-regulation of MyoD and MyoG in primary muscle stem cells cultured for a short period (Fig. 3D–H). This is in accordance with the up-regulation of MyoD transcripts and protein observed in coHes1 mutant muscle stem cells in vivo during postnatal muscle growth (Fig. 1M; Supplemental Fig. S1J) and is also supported by previous findings that showed that MyoD transcripts are down-regulated after Hes1 overexpression (Wen et al. 2012). We therefore tested whether endogenous Hes1 directly binds to the MyoD locus by ChIP-PCR on C2C12 cells. We found that Hes1 binds to (1) the MyoD promoter, (2) the core enhancer previously defined by others (Chen and Goldhamer 2004), and (3) a highly conserved but previously uncharacterized sequence 10.5 kb upstream of the transcription start site containing several predicted Hes1-binding sites (Fig. 3I,J).
We tested genetically whether ablation of the Hes1 oscillator influences MyoD-Luc2 bioluminescence signals and oscillations. For this we briefly cultured muscle stem cells carrying a Hes1 mutation that was either introduced during development (coHes1) or by tamoxifen in the adult (TxHes1; see also Supplemental Material and Supplemental Fig. S1B). When Hes1 was absent, the dynamics of MyoD-Luc2 bioluminescence was altered; i.e., oscillations became unstable and periods of sustained expression were observed (Fig. 4A–D; see also Supplemental Fig. S4E,F for additional tracks). Furthermore, the intensity of the MyoD-Luc2 bioluminescence signal increased on average 1.5-fold, and control and mutant cells displayed heterogeneous expression (Fig. 4E). To quantify this, a semiautomated tracking system was used that identified activated stem cells over a period of 10 h, and Fourier transformation was used to assess oscillation stability (Fig. 4F–I). This revealed fewer cells that oscillated in a stable manner. This effect was more pronounced for adult than neonatal cells (Fig. 4F–I). We conclude that in the absence of Hes1, MyoD-Luc2 oscillations are unstable.
Figure 4.

Stable MyoD oscillations depend on the presence of the Hes1 oscillator. (A,B) Bioluminescence images of a cultured MyoD-Luc2 muscle stem cell isolated from newborn coHes1 mice and quantification of the bioluminescence signal. (C,D) Bioluminescence images from a cultured MyoD-Luc2 muscle stem cell isolated from an adult TxHes1 mouse and quantification of the bioluminescence signal. (E) Quantification of MyoD-Luc2 bioluminescence in a mixed culture of muscle stem cells from postnatal control and coHes1 mice; control but not coHes1 mice carried in addition the Pax7-GFP allele, which was used to identify control cells. Data are presented as dot plots showing the median. (F,G) Fourier transformation of bioluminescence signals of control, coHes1 and TxHes1 mutant mice displayed in Figures 2L,N, 4A,C. (H,I) The power was analyzed by measuring the area under the fast Fourier transform (FFT). Data are presented as dot plots and also show the mean (number of cells analyzed from postnatal control n = 32, coHes1 n = 26; adult control n = 17, TxHes1 n = 18). For statistical analysis, unpaired two-tailed Student's t-test was performed. (*) P < 0.05; (**) P < 0.01; (n.s.) nonsignificant.
MyoD oscillation in activated muscle stem cells in fiber culture and tissue explants
We also tested whether MyoD expression oscillates in activated muscle stem cells associated with myofibers (Fig. 5A). Stem cells were identified by Pax7-GFP+; MyoD-Luc2 bioluminescence was rarely detectable in stem cells from freshly isolated fibers but appeared upon culture. MyoD-Luc2 bioluminescence signals oscillated, and the oscillations were more stable than the ones observed in primary cultures (Fig. 5B,C; see Supplemental Fig. S5A for additional tracks). Moreover, all cells expressing MyoD-Luc2 displayed oscillatory expression. MyoD-Luc2 bioluminescence in stem cells on fibers from TxHes1 mutants was detectable but not oscillating (Fig. 5D,E; see Supplemental Fig. S5B for additional tracks). Instead, we observed long periods of sustained expression of MyoD-Luc2 that were irregularly interrupted; that is, bioluminescence was fluctuating randomly. Accordingly, quantification using Fourier transformations demonstrated that MyoD-Luc2 was oscillating in a stable manner in muscle stem cells on fibers obtained from control mice, but not from TxHes1 mice (Fig. 5F,G). Fiber-associated activated stem cells form colonies that contain differentiating MyoG+ cells after 3-d culture (Collins and Zammit 2009). Colonies from mice with a Hes1 mutation displayed more MyoD+ and MyoG+ and fewer Pax7+ cells than those of control fibers (Fig. 5H–J). Thus, ablation of the Hes1 oscillator in muscle stem cells resulted in unstable oscillations, long periods of sustained MyoD expression, and an increased propensity of the stem cells to differentiate.
Figure 5.

Unstable MyoD oscillations caused by Hes1 mutation results in increased differentiation of adult muscle stem cells in fiber culture. (A) Muscle fibers from an adult mouse (Pax7-nGFP; MyoD-Luc2) were cultured and visualized by bright field, fluorescence, and bioluminescence imaging. (B,C) Dynamic MyoD-Luc2 bioluminescence images of a myofiber-associated muscle stem cell and quantification of the bioluminescence signal. (D,E) Dynamic MyoD-Luc2 bioluminescence images of a myofiber-associated muscle stem cell isolated from an adult TxHes1;MyoD-Luc2;Pax7-nGFP animal and quantification of the bioluminescence signal. (F) Fourier transformation of bioluminescence signals in muscle stem cells observed in cultured fibers; the fibers were obtained from control and TxHes1 mutant mice, respectively, and are displayed in B and D. (G) The power was analyzed by measuring the area under the fast Fourier transform (FFT). Data are presented as dot plots and also show the mean (control n = 3; TxHes1 n = 3). (H) Immunohistological analysis of muscle stem cell colonies associated with fibers cultured for 72 h. Myofibers from control and coHes1 mutants were analyzed. (I,J) Quantification of the differentiation of muscle stem cells in cultured fiber (n = 3; mean ± SEM). Shown are the proportions of cells in the colonies that are positive for Pax7 (red), Pax7 and MyoD (yellow), and MyoD (green) (I) or Pax7 (red), Pax7 and MyoG (yellow), and MyoG (green) (J). Bars: H, 10 µm. For statistical analysis, unpaired two-tailed Student's t-test was performed. (*) P < 0.05; (***) P < 0.001; (n.s.) nonsignificant.
We also asked whether MyoD-Luc2 is dynamically expressed in activated stem cells in cultured muscle biopsies. MyoD-Luc2 bioluminescence was not observed in fresh biopsies but present after incubation in medium containing 10% horse serum. MyoD-Luc2 expression oscillated over long periods in such explants, and oscillating cells were still observable after 3 d in culture (Fig. 6A,B, see Supplemental Fig. S6A for additional tracks). Thus, when muscle stem cells were activated in a cellular environment that resembles the one they encounter in vivo, they express MyoD in an oscillatory manner. MyoD expression dynamics was dramatically changed in explants from TxHes1 mice (Fig. 6C,D; see Supplemental Fig. S6B for additional tracks). Thus, we observed random fluctuations and, more importantly, long periods of sustained expression. Quantification of Fourier transformations showed that MyoD-Luc2 was oscillating in a stable manner in muscle explants isolated from control but not TxHes1 mice (Fig. 6E,F). We also tested functional consequences of Hes1 ablation in activated stem cells after muscle injury (an outline of the experiment is shown in Fig. 6G). We used a Cre-inducible GFP reporter to label the myogenic cell lineage (see also Material and Methods). Pax7-GFP+ cells from TxHes1 mice isolated 4 d after muscle injury expressed MyoG more frequently than the corresponding cells from control mice, indicating that they had a higher propensity to differentiate (Supplemental Fig. S6C–G). Similarly, histological analysis of muscle 4 d after injury demonstrated increased numbers of MyoG+ cells (Fig. 6H,I; quantified in J). However, no significant changes in proliferation or apoptosis were observed (proportion of Pax7+ cells pulse-labeled with EdU in control and mutant animals, 15.0 ± 1.7% and 21.4 ± 3.9%, respectively; proportions of TUNEL + Pax7 cells in control and mutant animals, 1.3 ± 0.79 and 2.0 ± 0.65, respectively). Histological analysis of muscle 8 d after injury demonstrated that the newly formed fibers contained more nuclei in control than in TxHes1 mutant mice, but the diameter of the muscle fibers were similar (Fig. 6K,L, quantified in M; Supplemental Fig. S6H). Importantly, very few Pax7+ cells remained in the regenerated muscle of TxHes1 mice, indicating that the increased differentiation propensity severely interfered with the maintenance of the stem cell pool (Fig. 6K,L, quantified in N). We conclude that activated muscle stem cells in injured muscle are driven to differentiate when the Hes1 oscillator is lacking, thereby severely affecting the maintenance of the stem cell pool in vivo.
Figure 6.

Unstable MyoD oscillations caused by Hes1 mutation result in increased differentiation of muscle stem cells in vivo. (A,B) Dynamics of bioluminescence in a muscle stem cell from a MyoD-Luc2 animal in muscle tissue explant culture and quantification of the bioluminescence signal. (C,D) Dynamics of bioluminescence in a muscle stem cell from a TxHes1;MyoD-Luc2 animal in muscle tissue explant culture, and quantification of the bioluminescence signal. (E) Fourier transformation of bioluminescence signals in muscle stem cells observed in cultured fibers; the fibers were obtained from control and TxHes1 mutant mice, respectively, and are displayed in A and C. (F) The power was analyzed by measuring the area under the fast Fourier transform (FFT). Data are presented as dot plots and also show the mean (control n = 5; TxHes1 n = 5). (G) Outline of the regeneration experiment shown in H–N. The Hes1 mutation was introduced by tamoxifen in 3- to 4-mo-old animals, and the muscle was injured on the last day of tamoxifen treatment. (H,I) Immunohistological analysis of muscle from control and TxHes1 mutant mice 4 d after injury using antibodies against Pax7, MyoG, and collagen IV. (J) Quantification of the relative proportions of Pax7+ and MyoG+ cells in the regenerating muscle. (K,L) Immunohistological analysis of muscle from control and TxHes1 mutant mice 8 d after injury using antibodies against Pax7 and laminin (Lam). DAPI was used as counterstain. Arrowheads point to Pax7+ cells. (M) Quantifications of muscle fiber nuclei in control and TxHes1 mutant mice 8 d after injury (n = 3, mean ± SEM). (N) Quantification of Pax7+ cells/mm2 in muscle from control and TxHes1 mutant mice 8 d after injury (n = 3, mean ± SEM). Scale bars: (I,L) 30 µm. For statistical analysis, unpaired two-tailed Student's t-test was performed. (**) P < 0.01; (***) P < 0.001. n.s., nonsignificant.
Discussion
We report here that MyoD and Hes1 expression oscillates in activated muscle stem cells, regardless of whether the cells derive from postnatal or adult muscle. The observed oscillations were asynchronous. Further, Hes1 drives MyoD oscillation: when Hes1 was lacking, MyoD oscillations became unstable and MyoD expression was sustained. This culminated in a dynamic MyoD expression pattern typical of differentiating cells (summarized in Fig. 7). Furthermore, Hes1 ablation resulted in a higher differentiation probability of proliferating muscle stem cells both in vitro and in vivo, which depleted the muscle stem cell pool and interfered with muscle growth and repair. We conclude that oscillatory MyoD expression allows for the amplification of the activated stem cell pool to ensure correct muscle growth and regeneration.
Figure 7.
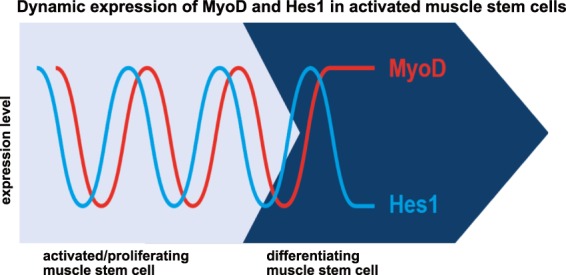
Hes1 and MyoD are dynamically expressed in activated muscle stem cells. Model showing oscillatory gene expression of Hes1 (blue) and MyoD (red) in activated muscle stem cells (pale blue). Sustained MyoD expression is associated with muscle stem cell differentiation (dark blue).
Oscillatory expression of Hes1 and MyoD
We show here that MyoD expression oscillates in proliferating muscle stem cells in vitro. Similarly, MyoD expression also oscillates in activated muscle stem cells associated with muscle fibers or in explants of muscle tissue. Thus, stable oscillations of MyoD can be observed under various conditions in activated muscle stem cells. In contrast, MyoD expression dynamics before fusion was markedly different and we observed long periods of sustained MyoD expression. These periods of sustained MyoD expression were occasionally interrupted; interruptions occurred randomly, that is, represent fluctuations. The dynamic expression of regulatory molecules is known to control cell fate. For instance, oscillatory expression of pro-neural genes facilitates proliferation, whereas sustained expression drives progenitors into neuronal differentiation. In addition, the oscillatory period can encode information. For instance, Ca2+ oscillations of different frequencies are decoded into distinct amounts of CaM kinase II kinase activity (Goldbeter et al. 1990; De Koninck and Schulman 1998). The differences in the oscillatory periods of MyoD in adult and postnatal muscle stem cells that we observe might thus influence cellular responses or reflect differences in their characteristics.
We observed that the transcriptional repressor Hes1 also oscillates in muscle stem cells. Mathematical modeling that relied on the assumption that Hes1 represses itself as well as MyoD transcription indicated that Hes1 might drive MyoD oscillations, a prediction that we verified experimentally. The short half-life (∼50 min) of MyoD protein is a prerequisite for the oscillations. The mitotic machinery was previously suggested to target MyoD for degradation (Kitzmann et al. 1998; Batonnet-Pichon et al. 2006). The ultradian oscillatory period of MyoD that we report here is shorter than the cell cycle, suggesting that additional mechanisms for MyoD degradation exist. Identification of such signals may shed new light on the regulatory mechanisms used to control myogenic differentiation. MyoD is well known to be expressed in undifferentiated cells, for instance, in activated muscle stem cells or C2C12 cells. To initiate terminal differentiation, MyoD depends on signal-dependent nuclear export of HDACs, BAF60c recruitment, and cooperation with MyoG that is only present in late myogenic stages (McKinsey et al. 2000; Cao et al. 2006; Forcales et al. 2012). Our observations indicate that the dynamics of MyoD, for example, oscillatory versus sustained expression, should be considered as further variable that controls differentiation (Fig. 7). Interestingly, oscillatory and sustained expression dynamics of NF-kB, active glucocorticoid receptor, and p53 were reported to affect target genes in distinct manners (Nelson et al. 2004; Stavreva et al. 2009; Purvis et al. 2012).
Hes/Hey factors mediating Notch signals in myogenic cells
Hes/Hey factors are well known mediators of Notch signals that have been intensively studied in the context of neurogenesis and somitogenesis (Kageyama et al. 2010). We demonstrate here that mutation of Hes1 enhances differentiation of muscle stem cells in vivo but does not impair their survival or proliferation. This uncontrolled differentiation results in a reduction of the stem cell pool and the formation of a small muscle, similar to the phenotypes observed in Rbpj or Dll1 mutants. However, compared with the drastic effects observed after Rbpj or Dll1 ablation, the Hes1 phenotype is mild (cf. this work and Schuster-Gossler et al. 2007; Vasyutina et al. 2007). In addition to Hes1, other members of the Hes/Hey family are induced by Notch signaling in muscle stem cells; for instance, Hey1 and Heyl. Ablation of both Hey1 and Heyl enhances differentiation (Fukada et al. 2011). Thus, the phenotypes of Hes1 and Hey1/Heyl mutant mice resemble each other, indicating that Hey1/Heyl and Hes1 might act in part redundantly and/or function cooperatively. It is currently unclear whether in addition to Hes1 the other members of the Hes/Hey family also oscillate in muscle progenitor cells and thus contribute to the dynamics of MyoD expression.
Functional outcome of dynamic MyoD and Hes1 expression
Regulatory molecules that control stem cell fate can oscillate and/or fluctuate stochastically, and the consequences of such oscillations and fluctuations are receiving increased attention since they were found to determine cell fate (Chambers et al. 2007; Shimojo et al. 2008, 2016; MacArthur et al. 2012; Imayoshi et al. 2013; Kumar et al. 2014). We report here that Hes1 and MyoD proteins oscillate in proliferating muscle stem cells. Oscillations in different muscle stem cells are asynchronous and are thus distinct from the synchronous oscillation observed in somitogenesis (Aulehla et al. 2003; Dequéant and Pourquié 2008; Kageyama et al. 2010; Oates et al. 2012). We show here that MyoD oscillations are unstable when Hes1 is ablated. Moreover, we observed that Hes1 mutant stem cell colonies in fiber cultures contained fewer cells that express Pax7 but not MyoD, and that the stem cell pool is no longer reconstituted in Hes1 mutant mice. This indicates that stem cell self-renewal also depends on Hes1. Our data indicate that as long as Hes1 and MyoD oscillate, activated cells remain in an ambivalent state that allows them to choose between fates. In contrast, when MyoD oscillation becomes unstable and expression is sustained, for instance, in the absence of Hes1, muscle stem cells favor entry into the differentiation program (Fig. 7). The oscillation of the Notch signaling component Hes1 in myogenic cells that we report here resembles the one observed in neuronal progenitors (Shimojo et al. 2008; Imayoshi et al. 2013). Thus, oscillatory expression of regulatory factors might represent a conserved and fundamental mechanism controlling stem cell fate.
Stable or unstable proteins are predicted to accumulate in markedly different manners when they are encoded by target genes of oscillatory factors. For instance, MyoD oscillations might lead to a stepwise accumulation of a stable target gene product, a mechanism that myogenic cells could use to “count” oscillations and time their differentiation. In contrast, if the target gene product were to be unstable, it could be expressed in an oscillatory manner. In addition, oscillatory and sustained expression of regulatory factors can differentially affect the transcriptional response (Sung et al. 2009; McMaster et al. 2011). Analysis of the expression dynamics of target genes will be required to reveal the full consequences of MyoD oscillation.
Materials and methods
MyoD-Luc2 mouse strain
MyoD-Luc2 mice were generated using CRISPR/Cas9 mediated homologous recombination. Luciferase cDNA was cloned in frame with MyoD coding sequence to generate a targeting vector and injected together with guide RNA targeting the 3′UTR of MyoD into fertilized eggs (Wefers et al. 2017). Correct integration was confirmed by Southern blot analysis of tissue. All breeding, housing, and experiments were conducted according to regulations established by the Max-Delbrueck-Centre for Molecular Medicine (MDC) and the Landesamt für Gesundheit und Soziales (LAGeSo, Berlin).
Isolation of muscle stem cells and single myofibers
Isolation of muscle stem cells was done as previously described (Bröhl et al. 2012). Briefly, muscle tissue was dissected, dissociated by NB 4G collagenase (Serva) and Dispase II (Roche) for 90 min at 37°C, and filtered through 100-, 40-, and 25-µm cell strainers. Conjugated antibodies against Sca-1, CD31, and CD45 (1:200; BD Biosciences) and an unconjugated antibody against Vcam1 (1:100; R&D Systems) combined with secondary antibodies (1:500; Dianova), and a FACSAria III cell sorter (BD Biosciences) were used for isolation. Dead cells and debris were excluded by propidium iodide staining (Invitrogen) and by gating on forward and side scatter profiles. Sorted (Vcam1+/Sca-1−/CD31−/CD45−) cells were either collected in Trizol reagent (Invitrogen), directly cytospun onto adhesive glass slides, or plated on matrigel-coated dishes. Myogenic cells 4 d after injury were isolated from Pax7Cre;Rosa-YFP (control) and TxHes1;Rosa-YFP (mutant) mice by GFP expression.
Induction of Notch signaling in cultured stem cells was done as described (Bröhl et al. 2012). For inhibition of de novo protein synthesis, cells were cultured for 3 h in the presence of 10 µM cycloheximide (Sigma-Aldrich).
Single myofibers were isolated from the extensor digitorum longus (EDL) or tibialis anterior (TA) muscle as described (Collins and Zammit 2009). Isolated myofibers were either directly fixed and immunostained or cultured in proliferation medium (DMEM (Invitrogen) containing 8 mM GlutaMAX (Life Technologies GmbH), 10% horse serum (Life Technologies GmbH), 0.5% chick embryo extract (MP Biomedicals), and 1% penicillin-streptomycin (Life Technologies GmbH).
Time-lapse bioluminescence imaging
Sixty-thousand isolated muscle stem cells were plated on matrigel inside a silicone ring (3 mm inner diameter), which was placed in a 35-mm glass bottom dish. Muscle stem cells were cultivated in growth medium (DMEM/F-12 [Life Technologies GmbH], 15% FCS [Sigma-Aldrich], 1% gentamycin [Life Technologies GmbH], 2.5 ng/mL bFGF [Sigma-Aldrich], supernatant of LIF-expressing cells) or differentiation medium (DMEM/F-12, 5% horse serum, 1% gentamycin). Cells were transfected 24 h after plating using the ViaFect reagent (Promega). The Hes1 reporter plasmid 1xUb-NLS-Luc2 was described previously (Kobayashi et al. 2009). Twenty-four hours after transfection, imaging was started after the addition of 1 mM luciferin (PJK GmbH). Images of luciferase signals of Hes1-Luc2 cells or cells containing the Hes1 reporter plasmid were acquired and analyzed as described (Imayoshi et al. 2013).
Mathematical modeling
We extended a qualitative Hes1 oscillator model (Hirata et al. 2002) to describe the dynamic Hes1 and MyoD levels. In the original model, Hes1 mRNA (HR), Hes1 protein (HP), and a Hes1-interacting factor (HF) are included and it is assumed that Hes1 protein negatively regulates Hes1 transcription. We extended the model and assumed that Hes1 protein analogously suppresses both MyoD and Hes1 transcription. Thus, the concentration of MyoD mRNA (MR), MyoD protein (MP), and MyoD-interacting factor (MF) are included in the extended model:
| (1) |
| (2) |
| (3) |
| (4) |
| (5) |
| (6) |
For the Hes1-related processes, we used the originally published parameters (Hirata et al. 2002). k1 = 0.3 and k8 = 0.6 rates of Hes1 and MyoD protein synthesis, respectively. k2 = 0.022 and rate constant of modulation of Hes1 and MyoD protein degradation by HF and MF, respectively. k3 = 0.031, k5 = 0.028, and k7 = 0.3 rate constants of degradation of the Hes1 protein, Hes1 transcript and HF (ln2/half life; half life = 22.3 min Hes1 protein; half life = 24.7 min Hes1 mRNA). k10 = 0.014, k12 = 0.0077, k14 = 0.03 rate constants of the degradation of MyoD protein, MyoD transcript and MF (ln2/half life; half life = 50 min MyoD protein (Lingbeck et al. 2003); half life = 90 min MyoD mRNA (Figueroa et al. 2003). k4 = 0.5 and k6 = 20.0 rate constants of synthesis of Hes1 transcripts and HF. k11 = 0.05 and k13 = 4.0 rate constants of synthesis of MyoD transcript and MF.
Immunohistochemistry, ChIP, RT-qPCR, live imaging of muscle fibres and muscle explant cultures, and quantifications of oscillations (e.g., stability, power, oscillatory period, amplitude and intensity) see the Supplemental Material.
Supplementary Material
Acknowledgments
We thank Manfred Gessler (University of Würzburg), Francois Guillemot (MRC National Institute for Medical Research) and David Ish-Horowicz (University College London) for generously providing Heyl, Hes5, and Hes7 mutant strains, respectively. We are grateful to Bettina Brandt, Vivian Schulz, and Pia Blessin for excellent technical assistance, and Petra Stallerow and Claudia Päseler for help with the animal husbandry. We also thank Hans-Peter Rahn for advice and help with cell sorting, and Bastiaan Pierik for technical help with the imaging setup, respectively. We also acknowledge Elijah Lowenstein, Thomas Müller, Minchul Kim, and Michael Strehle for critically reading the manuscript. This work was supported by the Deutsche Forschungsgemeinschaft (DFG)-funded MyoGrad international graduate program, a grant of AFM-Telethon and Agence Nationale de la Recherche (ANR)/DFG to C.B., an EMBO short-term fellowship to D.B., and a Grant-in-Aid for Scientific Research on Innovative Areas (16H06480) from the Ministry of Education, Culture, Sports, Science, and Technology (MEXT) of Japan to R. Kageyama and A.I.
Author contributions: I.L., D.B., and C.B. designed research. I.L., D.B., T.Z., A.I., M.T.C., J.G., and P.-L.R. performed research. V.K. and S.P. contributed new analytic tools. I.L., D.B., T.Z., and C.B. analyzed data. J.W. performed mathematical modeling. S.S. and P.S.Z. supervised muscle regeneration and fiber culture experiments, respectively. R. Kühn generated the MyoD-Luc2 mouse strain. R. Kageyama supervised Hes1 imaging and provided Hes1-Luc2 mouse strains and other reagents. T.W. provided the Hes1flox strain. C.B. and I.L. wrote the paper.
Footnotes
Supplemental material is available for this article.
Article published online ahead of print. Article and publication date are online at http://www.genesdev.org/cgi/doi/10.1101/gad.322818.118.
Freely available online through the Genes & Development Open Access option.
References
- Aulehla A, Wehrle C, Brand-Saberi B, Kemler R, Gossler A, Kanzler B, Herrmann BG. 2003. Wnt3a plays a major role in the segmentation clock controlling somitogenesis. Dev Cell 4: 395–406. 10.1016/S1534-5807(03)00055-8 [DOI] [PubMed] [Google Scholar]
- Batonnet-Pichon S, Tintignac LJ, Castro A, Sirri V, Leibovitch MP, Lorca T, Leibovitch SA. 2006. MyoD undergoes a distinct G2/M-specific regulation in muscle cells. Exp Cell Res 312: 3999–4010. 10.1016/j.yexcr.2006.09.001 [DOI] [PubMed] [Google Scholar]
- Bjornson CR, Cheung TH, Liu L, Tripathi PV, Steeper KM, Rando TA. 2012. Notch signaling is necessary to maintain quiescence in adult muscle stem cells. Stem Cells 30: 232–242. 10.1002/stem.773 [DOI] [PMC free article] [PubMed] [Google Scholar]
- Bröhl D, Vasyutina E, Czajkowski MT, Griger J, Rassek C, Rahn HP, Purfürst B, Wende H, Birchmeier C. 2012. Colonization of the satellite cell niche by skeletal muscle progenitor cells depends on Notch signals. Dev Cell 23: 469–481. 10.1016/j.devcel.2012.07.014 [DOI] [PubMed] [Google Scholar]
- Buas MF, Kadesch T. 2010. Regulation of skeletal myogenesis by Notch. Exp Cell Res 316: 3028–3033. 10.1016/j.yexcr.2010.05.002 [DOI] [PMC free article] [PubMed] [Google Scholar]
- Cao Y, Kumar RM, Penn BH, Berkes CA, Kooperberg C, Boyer LA, Young RA, Tapscott SJ. 2006. Global and gene-specific analyses show distinct roles for Myod and Myog at a common set of promoters. EMBO J 25: 502–511. 10.1038/sj.emboj.7600958 [DOI] [PMC free article] [PubMed] [Google Scholar]
- Chambers I, Silva J, Colby D, Nichols J, Nijmeijer B, Robertson M, Vrana J, Jones K, Grotewold L, Smith A. 2007. Nanog safeguards pluripotency and mediates germline development. Nature 450: 1230–1234. 10.1038/nature06403 [DOI] [PubMed] [Google Scholar]
- Chen JC, Goldhamer DJ. 2004. The core enhancer is essential for proper timing of MyoD activation in limb buds and branchial arches. Dev Biol 265: 502–512. 10.1016/j.ydbio.2003.09.018 [DOI] [PubMed] [Google Scholar]
- Collins CA, Zammit PS. 2009. Isolation and grafting of single muscle fibres. Methods Mol Biol 482: 319–330. 10.1007/978-1-59745-060-7_20 [DOI] [PubMed] [Google Scholar]
- Conboy IM, Rando TA. 2002. The regulation of Notch signaling controls satellite cell activation and cell fate determination in postnatal myogenesis. Dev Cell 3: 397–409. 10.1016/S1534-5807(02)00254-X [DOI] [PubMed] [Google Scholar]
- Czajkowski MT, Rassek C, Lenhard DC, Bröhl D, Birchmeier C. 2014. Divergent and conserved roles of Dll1 signaling in development of craniofacial and trunk muscle. Dev Biol 395: 307–316. 10.1016/j.ydbio.2014.09.005 [DOI] [PubMed] [Google Scholar]
- De Koninck P, Schulman H. 1998. Sensitivity of CaM kinase II to the frequency of Ca2+ oscillations. Science 279: 227–230. 10.1126/science.279.5348.227 [DOI] [PubMed] [Google Scholar]
- Delfini MC, Hirsinger E, Pourquié O, Duprez D. 2000. Delta 1-activated notch inhibits muscle differentiation without affecting Myf5 and Pax3 expression in chick limb myogenesis. Development 127: 5213–5224. [DOI] [PubMed] [Google Scholar]
- Dequéant ML, Pourquié O. 2008. Segmental patterning of the vertebrate embryonic axis. Nat Rev Genet 9: 370–382. 10.1038/nrg2320 [DOI] [PubMed] [Google Scholar]
- Figueroa A, Cuadrado A, Fan J, Atasoy U, Muscat GE, Munoz-Canoves P, Gorospe M, Munoz A. 2003. Role of HuR in skeletal myogenesis through coordinate regulation of muscle differentiation genes. Mol Cell Biol 23: 4991–5004. 10.1128/MCB.23.14.4991-5004.2003 [DOI] [PMC free article] [PubMed] [Google Scholar]
- Forcales SV, Albini S, Giordani L, Malecova B, Cignolo L, Chernov A, Coutinho P, Saccone V, Consalvi S, Williams R, et al. 2012. Signal-dependent incorporation of MyoD-BAF60c into Brg1-based SWI/SNF chromatin-remodelling complex. EMBO J 31: 301–316. 10.1038/emboj.2011.391 [DOI] [PMC free article] [PubMed] [Google Scholar]
- Fukada S, Yamaguchi M, Kokubo H, Ogawa R, Uezumi A, Yoneda T, Matev MM, Motohashi N, Ito T, Zolkiewska A, et al. 2011. Hesr1 and Hesr3 are essential to generate undifferentiated quiescent satellite cells and to maintain satellite cell numbers. Development 138: 4609–4619. 10.1242/dev.067165 [DOI] [PMC free article] [PubMed] [Google Scholar]
- Goldbeter A, Dupont G, Berridge MJ. 1990. Minimal model for signal-induced Ca2+ oscillations and for their frequency encoding through protein phosphorylation. Proc Natl Acad Sci 87: 1461–1465. 10.1073/pnas.87.4.1461 [DOI] [PMC free article] [PubMed] [Google Scholar]
- Gros J, Manceau M, Thomé V, Marcelle C. 2005. A common somitic origin for embryonic muscle progenitors and satellite cells. Nature 435: 954–958. 10.1038/nature03572 [DOI] [PubMed] [Google Scholar]
- Hirata H, Yoshiura S, Ohtsuka T, Bessho Y, Harada T, Yoshikawa K, Kageyama R. 2002. Oscillatory expression of the bHLH factor Hes1 regulated by a negative feedback loop. Science 298: 840–843. 10.1126/science.1074560 [DOI] [PubMed] [Google Scholar]
- Hirsinger E, Malapert P, Dubrulle J, Delfini MC, Duprez D, Henrique D, Ish-Horowicz D, Pourquié O. 2001. Notch signalling acts in postmitotic avian myogenic cells to control MyoD activation. Development 128: 107–116. [DOI] [PubMed] [Google Scholar]
- Imayoshi I, Isomura A, Harima Y, Kawaguchi K, Kori H, Miyachi H, Fujiwara T, Ishidate F, Kageyama R. 2013. Oscillatory control of factors determining multipotency and fate in mouse neural progenitors. Science 342: 1203–1208. 10.1126/science.1242366 [DOI] [PubMed] [Google Scholar]
- Kageyama R, Niwa Y, Shimojo H, Kobayashi T, Ohtsuka T. 2010. Ultradian oscillations in Notch signaling regulate dynamic biological events. Curr Top Dev Biol 92: 311–331. 10.1016/S0070-2153(10)92010-3 [DOI] [PubMed] [Google Scholar]
- Kassar-Duchossoy L, Gayraud-Morel B, Gomès D, Rocancourt D, Buckingham M, Shinin V, Tajbakhsh S. 2004. Mrf4 determines skeletal muscle identity in Myf5:Myod double-mutant mice. Nature 431: 466–471. 10.1038/nature02876 [DOI] [PubMed] [Google Scholar]
- Kassar-Duchossoy L, Giacone E, Gayraud-Morel B, Jory A, Gomes D, Tajbakhsh S. 2005. Pax3/Pax7 mark a novel population of primitive myogenic cells during development. Genes Dev 19: 1426–1431. 10.1101/gad.345505 [DOI] [PMC free article] [PubMed] [Google Scholar]
- Kitzmann M, Carnac G, Vandromme M, Primig M, Lamb NJ, Fernandez A. 1998. The muscle regulatory factors MyoD and myf-5 undergo distinct cell cycle-specific expression in muscle cells. J Cell Biol 142: 1447–1459. 10.1083/jcb.142.6.1447 [DOI] [PMC free article] [PubMed] [Google Scholar]
- Kobayashi T, Mizuno H, Imayoshi I, Furusawa C, Shirahige K, Kageyama R. 2009. The cyclic gene Hes1 contributes to diverse differentiation responses of embryonic stem cells. Genes Dev 23: 1870–1875. 10.1101/gad.1823109 [DOI] [PMC free article] [PubMed] [Google Scholar]
- Kopan R, Nye JS, Weintraub H. 1994. The intracellular domain of mouse Notch: a constitutively activated repressor of myogenesis directed at the basic helix–loop–helix region of MyoD. Development 120: 2385–2396. [DOI] [PubMed] [Google Scholar]
- Kumar RM, Cahan P, Shalek AK, Satija R, DaleyKeyser AJ, Li H, Zhang J, Pardee K, Gennert D, Trombetta JJ, et al. 2014. Deconstructing transcriptional heterogeneity in pluripotent stem cells. Nature 516: 56–61. 10.1038/nature13920 [DOI] [PMC free article] [PubMed] [Google Scholar]
- Kuroda K, Tani S, Tamura K, Minoguchi S, Kurooka H, Honjo T. 1999. Delta-induced Notch signaling mediated by RBP-J inhibits MyoD expression and myogenesis. J Biol Chem 274: 7238–7244. 10.1074/jbc.274.11.7238 [DOI] [PubMed] [Google Scholar]
- Lepper C, Partridge TA, Fan CM. 2011. An absolute requirement for Pax7-positive satellite cells in acute injury-induced skeletal muscle regeneration. Development 138: 3639–3646. 10.1242/dev.067595 [DOI] [PMC free article] [PubMed] [Google Scholar]
- Lingbeck JM, Trausch-Azar JS, Ciechanover A, Schwartz AL. 2003. Determinants of nuclear and cytoplasmic ubiquitin-mediated degradation of MyoD. J Biol Chem 278: 1817–1823. 10.1074/jbc.M208815200 [DOI] [PubMed] [Google Scholar]
- Lipan O, Wong WH. 2005. The use of oscillatory signals in the study of genetic networks. Proc Natl Acad Sci 102: 7063–7068. 10.1073/pnas.0403790102 [DOI] [PMC free article] [PubMed] [Google Scholar]
- MacArthur BD, Sevilla A, Lenz M, Müller FJ, Schuldt BM, Schuppert AA, Ridden SJ, Stumpf PS, Fidalgo M, Ma'ayan A, et al. 2012. Nanog-dependent feedback loops regulate murine embryonic stem cell heterogeneity. Nat Cell Biol 14: 1139–1147. 10.1038/ncb2603 [DOI] [PMC free article] [PubMed] [Google Scholar]
- Mauro A. 1961. Satellite cell of skeletal muscle fibers. J Biophys Biochem Cytol 9: 493–495. 10.1083/jcb.9.2.493 [DOI] [PMC free article] [PubMed] [Google Scholar]
- McKinsey TA, Zhang CL, Lu J, Olson EN. 2000. Signal-dependent nuclear export of a histone deacetylase regulates muscle differentiation. Nature 408: 106–111. 10.1038/35040593 [DOI] [PMC free article] [PubMed] [Google Scholar]
- McMaster A, Jangani M, Sommer P, Han N, Brass A, Beesley S, Lu W, Berry A, Loudon A, Donn R, et al. 2011. Ultradian cortisol pulsatility encodes a distinct, biologically important signal. PLoS One 6: e15766 10.1371/journal.pone.0015766 [DOI] [PMC free article] [PubMed] [Google Scholar]
- Megeney LA, Kablar B, Garrett K, Anderson JE, Rudnicki MA. 1996. MyoD is required for myogenic stem cell function in adult skeletal muscle. Genes Dev 10: 1173–1183. 10.1101/gad.10.10.1173 [DOI] [PubMed] [Google Scholar]
- Mourikis P, Gopalakrishnan S, Sambasivan R, Tajbakhsh S. 2012a. Cell-autonomous Notch activity maintains the temporal specification potential of skeletal muscle stem cells. Development 139: 4536–4548. 10.1242/dev.084756 [DOI] [PubMed] [Google Scholar]
- Mourikis P, Sambasivan R, Castel D, Rocheteau P, Bizzarro V, Tajbakhsh S. 2012b. A critical requirement for notch signaling in maintenance of the quiescent skeletal muscle stem cell state. Stem Cells 30: 243–252. 10.1002/stem.775 [DOI] [PubMed] [Google Scholar]
- Nelson DE, Ihekwaba AE, Elliott M, Johnson JR, Gibney CA, Foreman BE, Nelson G, See V, Horton CA, Spiller DG, et al. 2004. Oscillations in NF-κB signaling control the dynamics of gene expression. Science 306: 704–708. 10.1126/science.1099962 [DOI] [PubMed] [Google Scholar]
- Oates AC, Morelli LG, Ares S. 2012. Patterning embryos with oscillations: structure, function and dynamics of the vertebrate segmentation clock. Development 139: 625–639. 10.1242/dev.063735 [DOI] [PubMed] [Google Scholar]
- Purvis JE, Karhohs KW, Mock C, Batchelor E, Loewer A, Lahav G. 2012. p53 dynamics control cell fate. Science 336: 1440–1444. 10.1126/science.1218351 [DOI] [PMC free article] [PubMed] [Google Scholar]
- Relaix F, Rocancourt D, Mansouri A, Buckingham M. 2005. A Pax3/Pax7-dependent population of skeletal muscle progenitor cells. Nature 435: 948–953. 10.1038/nature03594 [DOI] [PubMed] [Google Scholar]
- Sambasivan R, Yao R, Kissenpfennig A, Van Wittenberghe L, Paldi A, Gayraud-Morel B, Guenou H, Malissen B, Tajbakhsh S, Galy A. 2011. Pax7-expressing satellite cells are indispensable for adult skeletal muscle regeneration. Development 138: 3647–3656. 10.1242/dev.067587 [DOI] [PubMed] [Google Scholar]
- Schuster-Gossler K, Cordes R, Gossler A. 2007. Premature myogenic differentiation and depletion of progenitor cells cause severe muscle hypotrophy in Delta1 mutants. Proc Natl Acad Sci 104: 537–542. 10.1073/pnas.0608281104 [DOI] [PMC free article] [PubMed] [Google Scholar]
- Seale P, Ishibashi J, Holterman C, Rudnicki MA. 2004. Muscle satellite cell-specific genes identified by genetic profiling of MyoD-deficient myogenic cell. Dev Biol 275: 287–300. 10.1016/j.ydbio.2004.07.034 [DOI] [PubMed] [Google Scholar]
- Shawber C, Nofziger D, Hsieh JJ, Lindsell C, Bögler O, Hayward D, Weinmaster G. 1996. Notch signaling inhibits muscle cell differentiation through a CBF1-independent pathway. Development 122: 3765–3773. [DOI] [PubMed] [Google Scholar]
- Shimojo H, Ohtsuka T, Kageyama R. 2008. Oscillations in notch signaling regulate maintenance of neural progenitors. Neuron 58: 52–64. 10.1016/j.neuron.2008.02.014 [DOI] [PubMed] [Google Scholar]
- Shimojo H, Isomura A, Ohtsuka T, Kori H, Miyachi H, Kageyama R. 2016. Oscillatory control of δ-like1 in cell interactions regulates dynamic gene expression and tissue morphogenesis. Genes Dev 30: 102–116. 10.1101/gad.270785.115 [DOI] [PMC free article] [PubMed] [Google Scholar]
- Stavreva DA, Wiench M, John S, Conway-Campbell BL, McKenna MA, Pooley JR, Johnson TA, Voss TC, Lightman SL, Hager GL. 2009. Ultradian hormone stimulation induces glucocorticoid receptor-mediated pulses of gene transcription. Nat Cell Biol 11: 1093–1102. 10.1038/ncb1922 [DOI] [PMC free article] [PubMed] [Google Scholar]
- Sung MH, Salvatore L, De Lorenzi R, Indrawan A, Pasparakis M, Hager GL, Bianchi ME, Agresti A. 2009. Sustained oscillations of NF-κB produce distinct genome scanning and gene expression profiles. PLoS One 4: e7163 10.1371/journal.pone.0007163 [DOI] [PMC free article] [PubMed] [Google Scholar]
- Vasyutina E, Lenhard DC, Wende H, Erdmann B, Epstein JA, Birchmeier C. 2007. RBP-J (Rbpsuh) is essential to maintain muscle progenitor cells and to generate satellite cells. Proc Natl Acad Sci 104: 4443–4448. 10.1073/pnas.0610647104 [DOI] [PMC free article] [PubMed] [Google Scholar]
- Weber D, Wiese C, Gessler M. 2014. Hey bHLH transcription factors. Curr Top Dev Biol 110: 285–315. 10.1016/B978-0-12-405943-6.00008-7 [DOI] [PubMed] [Google Scholar]
- Wefers B, Bashir S, Rossius J, Wurst W, Kühn R. 2017. Gene editing in mouse zygotes using the CRISPR/Cas9 system. Methods 121–122: 55–67. 10.1016/j.ymeth.2017.02.008 [DOI] [PubMed] [Google Scholar]
- Weintraub H, Davis R, Tapscott S, Thayer M, Krause M, Benezra R, Blackwell TK, Turner D, Rupp R, Hollenberg S, et al. 1991. The myoD gene family: nodal point during specification of the muscle cell lineage. Science 251: 761–766. 10.1126/science.1846704 [DOI] [PubMed] [Google Scholar]
- Wen Y, Bi P, Liu W, Asakura A, Keller C, Kuang S. 2012. Constitutive notch activation upregulates pax7 and promotes the self-renewal of skeletal muscle satellite cells. Mol Cell Biol 32: 2300–2311. 10.1128/MCB.06753-11 [DOI] [PMC free article] [PubMed] [Google Scholar]
Associated Data
This section collects any data citations, data availability statements, or supplementary materials included in this article.