

Abstract
Objectives
Formaldehyde is routinely used in pathology laboratories. The threshold limit value of formaldehyde determined by American and Japanese organizations is 0.1 ppm, which is similar to the indoor air quality guideline value (0.08 ppm). Therefore, maintaining low formaldehyde concentrations in the workplace is imperative. The purpose of this study was to reduce the concentration of formaldehyde in a hospital pathology laboratory, in which approximately 15 000 pathological diagnoses are conducted yearly, using hardware and software interventions.
Methods
Although this laboratory had various ventilation systems, the formaldehyde concentration was high. Based on the Japanese work environment measurement system, the workplace was categorized as control class III, suggesting that improvements to workplace conditions were required. First, engineering controls were implemented and workers were asked not to block the ventilation system and not to keep waste fluid tanks open. However, the workplace required further improvement. Next, using a video camera and a formaldehyde detector, we attempted to visually educate workers about how much formaldehyde is emitted from the sample container based on the type of action undertaken.
Results
After the first intervention, the workplace improved to control class II. Control class II indicates that the workplace condition is between classes I and III; a good workplace condition is classified as class I. Although the work environment was still categorized as control class II after the second intervention, this intervention led to the further improvements.
Conclusions
The hardware and software interventions and safe working habits were effective in improving the work environment.
Keywords: formaldehyde, occupational exposure, pathological laboratory, work environment
1. INTRODUCTION
Formaldehyde is a confirmed human carcinogen,1 and occupational exposure to formaldehyde causes irritation to the eye and upper airway.2, 3, 4 Therefore, it is important to control the concentration of formaldehyde in the workplace. The American Conference of Governmental Industrial Hygienists (ACGIH) stipulates that the threshold limit value of formaldehyde is 0.1 ppm (time‐weighted average) and 0.3 ppm (short‐term exposure limit) to minimize potential sensory irritation.5 Additionally, the Japan Society for Occupational Health (JSOH) stipulates that, based on irritation, the occupational exposure limits for formaldehyde are 0.12 mg/m3 (0.1 ppm) (time‐weighted average) and 0.24 mg/m3 (0.2 ppm) (occupational exposure limit‐ceiling).6 In 2010, the World Health Organization published 0.1 mg/m3 (0.08 ppm) as an indoor air quality guideline for short‐term (30‐minute) exposures to formaldehyde. Although approximately 0.2 mg/m3 was reported as the value associated with long‐term health effects, this value is above the guideline for short‐term effects.7 Therefore, to prevent short‐ and long‐term health effects, the aim should be 0.1 mg/m3 (0.08 ppm). Additionally, the Japan Ministry of Health, Labour and Welfare published guidelines in which they recommended that the threshold value for indoor formaldehyde concentrations is 0.1 mg/m3 (0.08 ppm).8
The guidelines on formaldehyde concentrations in the workplace and living environment are similar; therefore, if formaldehyde is handled, the formaldehyde concentration in the workplace should be strictly controlled. Formaldehyde is routinely used in hospital pathology laboratories; therefore, the control of formaldehyde concentrations is imperative in order to prevent excessive exposure.
In previous reports, local exhaust ventilation systems have been effective to minimize contact with formaldehyde in laboratories.9, 10 However, in the hospital pathology laboratory described in this study, although local exhaust ventilation systems were installed surrounding workplaces and formalin storage tanks, the work environment needed to be improved.
In this report, we describe a strategy for the reduction of formaldehyde concentrations in a hospital pathology laboratory using hardware and software interventions and for the improvement of the working environment, based on the results of the working environment measurement system in Japan.
2. METHODS
2.1. Pathological laboratory
The design of this hospital pathology laboratory is shown in Figure 1. Doctors and technicians work in this laboratory where approximately 15 000 pathological diagnoses are conducted annually. Workers handle the pathological samples treated with formalin on laminar tables, to which down‐flow push‐pull ventilation systems are attached (Figure 2A,B). There is a formalin bath used for soaking the samples located between the push‐pull ventilation (Figure 2C). The formalin dilution machine is located next to the soaking bath and there is a local ventilation system near the spout (Figure 2D). The storage tanks containing diluted formalin solution are also located between the push‐pull ventilation (Figure 2E). There are some sinks located in the laboratory and the ventilation systems are installed behind the sinks.
Figure 1.

Layout of the hospital pathology laboratory. The total area was 45 m2. The local exhaust devices were installed around the formaldehyde emission source
Figure 2.
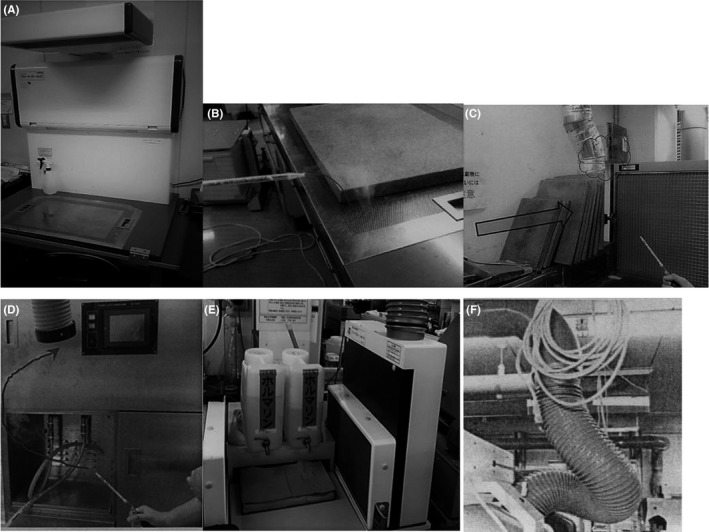
Ventilation systems installed in the pathology laboratory. (A) Laminar table on which the pathological samples were treated. (B) Ventilation system surrounding the work space. (C) Push‐pull ventilation for the formalin bath. (D) Local ventilation system for the formalin dilution machine. (E) Push‐pull ventilation for the formalin storage tanks. (F) Exhaust ducts from the laminar table
2.2. Working environment measurement system in Japan
The Japanese working environment measurement system was adopted in order to assess the workplace environment. In Japan, working environment control is one of the approaches used for occupational health control. It is used to eliminate or control for hazardous factors in the working environment, in order to reduce these factors to a level that will not cause any unacceptable risk to workers.
The first step in working environment control is the measurement of the working environment, which entails three processes.11 First, the airborne concentrations of chemicals in the workplace atmosphere must be measured. Second, the indices (1st evaluation value and 2nd evaluation value) must be calculated by statistical treatment of the measurement results. The 1st evaluation value (EA1) is the estimated value suited to 5% of the highest level among the actual value of the airborne substances while the 2nd evaluation value (EA2) is the estimated value of the arithmetic mean concentration. Third, the calculated values must be compared with the “administrative levels” that are stipulated for each hazardous chemical by the government, and the control class is then determined.
Control class is used in order to estimate whether the work environment is properly controlled. Control class I (EA1 < administrative level) indicates that workplace conditions are good and no action is required. Control class III (EA2 > administrative level) indicates that workplace conditions require improvement in order to reach control class I. Finally, control class II (EA1 ≥ administrative level ≥ EA2) indicates that workplace conditions are between control class I and III. Laboratories are encouraged to reach control class I by checking workplace conditions and taking necessary action.11 The administrative level for formaldehyde is stipulated as 0.1 ppm by the government.
2.3. The interventions to the workplace
In order to improve the work environment of this laboratory, hardware, and software improvements were implemented.
As hardware interventions, engineering controls, such as effective ventilation systems, were implemented. Although the formalin bath was placed between the push‐pull ventilation, investigation using the smoke tester showed that these systems did not work effectively (Figure 2C). Moreover, although pathological samples were treated on the laminar tables, the ventilation openings surrounding the work space were covered with a cutting board or other goods on some occasions and it was often ineffective. The exhaust ducts from the laminar tables were bent (Figure 2F) and did not have effective exhaust ability.
The push‐pull ventilation was covered, as shown in Figure 3A, and clear boards were placed beside the laminar tables (Figure 3B) in order to maintain the air current. The spout of the formalin dilution machine was also covered with clear boards to prevent diffusion (Figure 3C). The length of the exhaust ducts from the laminar tables was adjusted to a more appropriate length (Figure 3D).
Figure 3.

Engineering controls implemented for effective ventilation. (A) Coverings for the push‐pull ventilation. (B) Clear boards placed besides the laminar table. (C) Spout of the formalin dilution machine covered with the clear boards. (D) Length adjusted exhaust ducts from the laminar table
The software intervention entailed asking the doctors and technicians not to block the ventilators on the laminar tables while handling the samples and not to keep the formalin‐containing waste fluid tank open. Prior to this intervention, the waste fluid tanks were often kept open (Figure 4).
Figure 4.

Formalin‐containing waste fluid tanks without caps
After these initial interventions, the workplace required further improvement. In order to make further improvements to the working environment, another software intervention was needed, because all possible hardware interventions had been conducted. Thus, next we focused on the behavior of the workers. Using a video camera and a volatile organic compound detector, we investigated the formaldehyde concentration present for different operations. The technician was asked to wear a small video camera on her head and the camera recorded work operations for approximately 1 hour. At the same time, the formaldehyde concentration surrounding the technician was measured in real time with Tiger (Riken Keiki, Japan), which is a volatile organic compound detector that uses the photoionization detector system (Figure 5).
Figure 5.
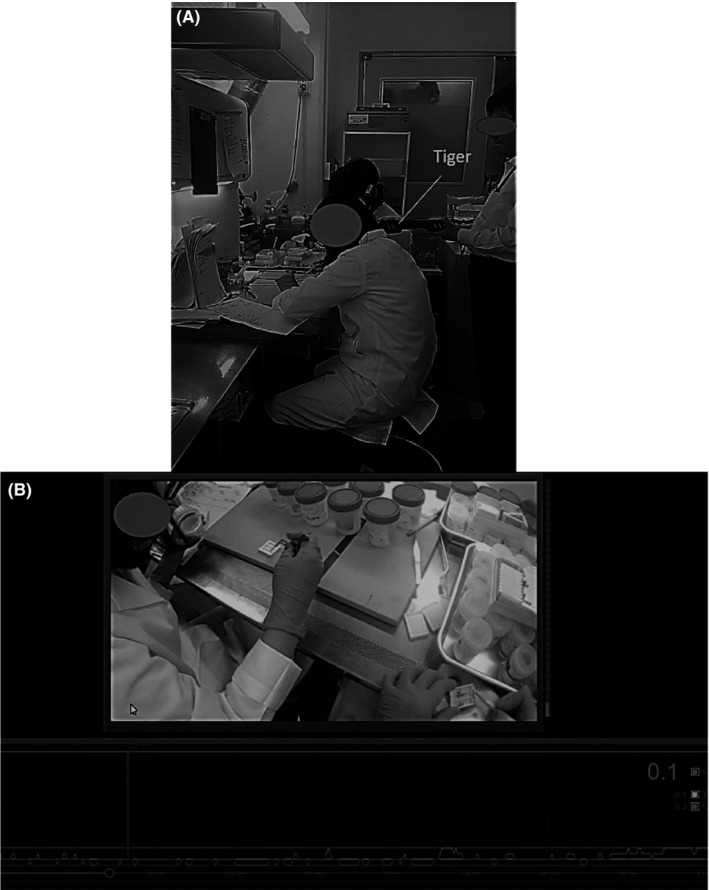
(A) Setting in which formaldehyde is being measured with Tiger. One of the workers can be seen with a small video camera on her head. (B) Video footage in addition to the measurement of the formaldehyde concentrations. The graph in the bottom panel indicates the real‐time measurement of the formaldehyde concentrations
3. RESULTS
All of the changes in the work environment measurements are summarized in Table 1.
Table 1.
Change in the work environment measurements before and after the interventions
| Formaldehyde concentration (ppm) | EA1 a | EA2 a | |
|---|---|---|---|
| Before the interventions | (1) 0.34, (2) 0.03, (3) 0.02, (4) 0.02, (5) 0.06 | 0.447 | 0.120 |
| After the engineering and software interventions | (1) 0.13, (2) 0.07, (3) 0.03, (4) 0.03, (5) 0.08 | 0.267 | 0.089 |
| After the intervention with video camera | (1) 0.11, (2) <0.01, (3) <0.01, (4) <0.01, (5) 0.07 | 0.228 | 0.061 |
EA1:1st evaluation value; EA2:2nd evaluation value.
Conducted in a single day.
Points (1)‐(5) in Figure 1 were the measuring points based on the working environment measurement system in Japan. Before the hardware and software interventions, the concentration of formaldehyde in points (1)‐(5) was 0.34, 0.03, 0.02, 0.02, and 0.06 ppm, respectively, and the work environment was categorized as control class III (EA1 = 0.447, EA2 = 0.120). The concentration near the formalin soaking bath and the laminar table (1) was high.
Following the engineering interventions and asking the workers not to block the ventilation systems or keep the waste fluid tank open, the formaldehyde concentrations in points (1)‐(5) improved to 0.13, 0.07, 0.03, 0.03, and 0.08 ppm, respectively, and the work environment was categorized as control class II (EA1 = 0.267, EA2 = 0.089). However, the formaldehyde concentrations near the formalin soaking bath and the laminar table (1) remained relatively high.
Using the visual education intervention we found that formaldehyde diffused when the technician opened the cap of the sample container; at that time the concentration elevated to 0.5 ppm. Additionally, the work was conducted at an extended distance from the ventilation systems. The ceiling limit of formaldehyde, as determined by the ACGIH and JSOH, was 0.3 and 0.2 ppm.5, 6 Therefore, we requested that the technicians handle the sample containers as quickly as possible and that they work near the ventilation systems.
Following the final intervention, the formaldehyde concentrations in points (1)‐(5) were 0.11, <0.01, <0.01, <0.01, and 0.07 ppm, respectively. Although, the work environment was still categorized as control class II (EA1 = 0.228, EA2 = 0.061), the formaldehyde concentrations tended to improve.
4. DISCUSSION
This study describes a strategy for the reduction of formaldehyde concentrations in hospital pathology laboratories using hardware and software interventions. Before the first intervention, when the formaldehyde concentrations at each point were compared, the concentration in point (1) was higher than that of other points. Therefore, it was thought that an intervention targeting point (1) was particularly needed. Surrounding point (1), there were laminar tables on which the formalin‐treated pathological samples were handled and the formalin soaking bath was placed. Thus, it was assumed that these devices were the source of formaldehyde emission.
There are several reports that have shown that engineering controls, such as effective ventilation systems, can lower the formaldehyde concentration in the workplace.12, 13, 14 In this study, in order to improve the ventilation system, the length of the exhaust ducts from the laminar tables was adjusted and the push‐pull ventilation was covered. Additionally, we asked the workers not to block the ventilation systems. Another previous study reported that appropriate storage was effective for the reduction of formaldehyde concentrations in the workplace.14 Therefore, we also asked the workers not to keep the waste fluid tank open to prevent formaldehyde diffusion. As a result of these interventions, the work environment improved.
Hospital workers often do not perceive exposure to hazardous chemicals despite the common presence of chemicals in a hospital.15 Asking the workers to pay attention to the handling of the bottles was not effective; therefore, we attempted to visually educate workers about how much formaldehyde is emitted from the bottles according to the type of action performed. Following this intervention, the work environment improved again, indicating that our educational intervention was valuable.
Although the work environmental measurement was still categorized as control class II following the second intervention, it is clear that the work environment had improved from the results. As mentioned above, these work environment measurements were all conducted in 1 day. The work environment measurement system in Japan suggests that these assessments be conducted for two continuous days, if possible. If the work environment is measured in a day, the calculation formula taking the empirical between‐day variation into consideration14 is used; the evaluation of the workplace can be more severe if measured in a day, as there might be less between‐day variation in the continuous 2‐day measurements. Therefore, in order to assess the actual improvement, the work environment should be measured for two continuous days.
In order to improve the hardware, clear boards were set beside the laminar tables. However, this was not done for all laminar tables because some workers complained that the boards made work difficult, thus decreasing work efficiency. Although the engineering interventions lowered the formaldehyde concentration in this study, it is important to consider both aspects of occupational safety and working efficiency when hardware improvements are implemented.
Workers habits could be observed visually to determine formaldehyde exposure and the formaldehyde concentrations could be detected using a formaldehyde detector. We found high‐formaldehyde concentrations that exceed the ceiling limit of formaldehyde. After requesting that workers be conscious of handling formaldehyde following the report of the measurement results, the work environment improved. Therefore, visual education was effective in increasing workers awareness of the careful handling of formaldehyde. Izak et al16 found that an understanding of the features of formaldehyde can contribute to the prevention of formaldehyde overexposure. It is important to generate safe working habit in which workers are always conscious of formaldehyde exposure risks while working.
In order to maintain low formaldehyde concentrations, installing local exhaust ventilation alone is not enough to protect from formaldehyde, and the performance of the ventilation systems should also be confirmed. In addition, both hardware interventions and software interventions should be considered. Moreover, it is necessary to ensure workers are aware of the careful handling of formaldehyde.
The limitations of this study are that each result was measured on 1 day only, and this was not a long‐term evaluation. Therefore, there is a possibility that the categorized control class may not represent the constant work environment.
5. CONCLUSIONS
Local exhaust systems alone are not effective in maintaining low formaldehyde concentrations. It is important to consider both hardware and software interventions for improvement of formaldehyde concentrations in a hospital laboratory. Furthermore, it is imperative that workers are aware of the risks and appropriate handling of formaldehyde.
DISCLOSURE
Approval of the research protocol: N/A. Informed Consent: With respect to ethical considerations for the technician with video camera, after we explained the objective of this study to the technicians, one technician showed an interest in this study and offered to participant voluntarily. Registry and the Registration No. of the study/trial: N/A. Animal Studies: N/A.
CONFLICT OF INTEREST
Author IK is an employee of Kubota Corporation. Author YT is an employee of Riken Keiki Co., Ltd. The other authors have no conflict of interest.
AUTHOR CONTRIBUTIONS
MO integrated this study and drafted the manuscript; KI and YT conceived the idea; and ST gave some advice.
ACKNOWLEDGMENT
This study was financially supported by Jichi Medical University.
Ogawa M, Kabe I, Terauchi Y, Tanaka S. A strategy for the reduction of formaldehyde concentration in a hospital pathology laboratory. J Occup Health. 2019;61:135–142. 10.1002/1348-9585.12018
REFERENCES
- 1. IARC . Working group on the evaluation of carcinogenic risks to humans. Formaldehyde, 2‐butoxyethanol and 1‐tert‐butoxy‐2‐propanol. IARC Monogr Eval Carcinog Risks Hum. 2006;88:280. [PMC free article] [PubMed] [Google Scholar]
- 2. Horvath EP Jr, Anderson H Jr, Pierce WE, et al. Effects of formaldehyde on the mucous membranes and lungs. A study of an industrial population. JAMA. 1988;259:701‐707. [PubMed] [Google Scholar]
- 3. Alexandersson R, Hedenstierna G. Pulmonary function in wood workers exposed to formaldehyde: a prospective study. Arch Environ Health. 1989;44:5‐11. [DOI] [PubMed] [Google Scholar]
- 4. Kilburn KH, Warshaw R, Thornton JC. Pulmonary function in histology technicians compared with women from Michigan: effects of chronic low dose formaldehyde on a national sample of women. Br J Ind Med. 1989;46:468‐472. [DOI] [PMC free article] [PubMed] [Google Scholar]
- 5. American Conference of Governmental Industrial Hygienists (ACGIH) . Formaldehyde Documentation of the TLVs and BEIs with Other Worldwide Occupational Exposure Values. Cincinnati, OH: ACGIH; 2017. [Google Scholar]
- 6. The Japanese Society of Occupational Health . Recommendation of occupational exposure limits (2017–2018). J Occup Health. 2017;59:436‐469. [DOI] [PMC free article] [PubMed] [Google Scholar]
- 7. World Health Organization . WHO Guidelines for Indoor Air Quality: Selected Pollutants. Copenhagen: WHO; 2010. http://www.euro.who.int/__data/assets/pdf_file/0009/128169/e94535.pdf. Accessed June 28, 2018. [PubMed] [Google Scholar]
- 8. Kenichi A, Iwao U, Koichi I. The regulations for indoor air pollution in Japan: a public health. J Risk Res. 2008;11:301‐314. [Google Scholar]
- 9. d'Ettorre G, Criscuolo M, Mazzotta M. Managing formaldehyde indoor pollution in anatomy pathology departments. Work. 2017;56:397‐402. [DOI] [PubMed] [Google Scholar]
- 10. Ghasemkhani M, Jahanpeyma F, Azam K. Formaldehyde exposure in some educational hospitals of Tehran. Ind Health. 2005;43:703‐707. [DOI] [PubMed] [Google Scholar]
- 11. Japan Association of Working Environment Measurement . Working Environment Measurement System in Japan. http://www.jawe.or.jp/english/pdf/WEMS20100520.pdf. Accessed June 28, 2018.
- 12. Koda S, Kumagai S, Ohara H. Environmental monitoring and assessment of short‐term exposures to hazardous chemicals of a sterilization process in hospital working environments. Acta Med Okayama. 1999;53:217‐223. [DOI] [PubMed] [Google Scholar]
- 13. Kurose T, Kodera H, Aoyama H, et al. Formaldehyde concentration in the air and in cadavers at the gross anatomy laboratory in Hiroshima University. Hiroshima J Med Sci. 2004;53:33‐37. [PubMed] [Google Scholar]
- 14. Higashikubo I, Miyauchi H, Yoshida S, et al. Assessment of workplace air concentrations of formaldehyde during and before working hours in medical facilities. Ind Health. 2017;55:192‐198. [DOI] [PMC free article] [PubMed] [Google Scholar]
- 15. Roy DR. Histology and pathology laboratories. Chemical hazard prevention and medical/health surveillance. AAOHN J. 1999;47:199‐205. [PubMed] [Google Scholar]
- 16. Izak BD. A pragmatic approach to formalin safety in anatomical pathology. Lab Med. 2009;40:740‐746. [Google Scholar]