

Abstract
Objectives
The aim of this study was to study measurement properties of the Dutch Language Version of the Brief Resilience Scale (BRS‐DLV) in blue and white collar workers employed at multiple companies and to compare the validity and factor structure to other language versions.
Methods
Workers (n = 1023) were assessed during a cross‐sectional health surveillance. Construct validity was tested with exploratory and confirmatory factor analyses (EFA and CFA) and hypothesis testing. Reliability was tested with Cronbach's alpha.
Results
A two‐factor structure of the BRS‐DLV had good model fit in both EFA and CFA, which could be explained by difficulties of workers with reversed order items. After excluding these inconsistent answering patterns, a one‐factor structure showed good model fit resembling the original BRS (χ2 = 16.5; CFI & TLI = 0.99; SRMR = 0.02;RMSEA = 0.04). Internal consistency is sufficient (Cronbach's α = 0.78). All five hypotheses were confirmed, suggesting construct validity.
Conclusions
Reliability of the BRS‐DLV is sufficient and there is evidence of construct validity. Inconsistent answering, however, caused problems in interpretation and factor structure of the BRS‐DLV. This can be easily detected and handled because item 2, 4 and 6 are in reversed order. Other language versions differ in factor structure, most likely because systematic errors are not corrected for. To collect valid data, it is advised to be aware of inconsistent answering of respondents.
Keywords: employability, factor structure, health prevention, reliability, resilience, validity
1. INTRODUCTION
While half of all adults in the world experience at least one traumatic event during their lifetime, not all of them develop clinical psychopathology afterwards.1, 2 One fundamental subject of research within Positive Psychology has been the aspect of noticeable individual differences in how people react and cope with highly aversive events. Research has shown that some people can cope effectively with these events, whereas others cannot. A factor which was found to be strongly connected with positive coping is resilience.3
Resilience can be defined as an adaptive response to adversity. Resilience contains three components, namely recovery, sustainability and growth.4 Moreover, resilient people show short‐term reactions to adverse events and are able to maintain their level of functioning.5, 6 Other studies show that less resilient people can also recover from adverse events, but they are greatly affected in their level of functioning during the recovery process.5 Adverse events may result in negative thoughts and feelings 7 and may in severe cases lead to depression, or in the worst case to suicide.7 Early identification of decreased resilience may lead to effective prevention of related disorders in a healthy population. So, measuring resilience in eg the working environment enables health professionals to identify workers at risk for sustained employability and prevent them from dropping out due to health related problems.
Previously, significant positive correlations were identified between resilience and work engagement.8 Negative correlations were identified between resilience and psychological complaints.9 Additionally, resilience is related to many life style factors including, smoking,10 recreation 11 and diet.12
For this purpose, measuring resilience in a short and practical way may be of additional value for preventive health screening in the work context. To meet these demands, the screening instrument should be brief, practically applicable, yet valid. The Brief Resilience Scale (BRS) contains six items and has previously been validated in English,13 Spanish,14 Portuguese,15, 16, 17 Malaysian16 and Chinese.17 There are, however, some differences between these different language versions in factor structure that need further exploration. A Dutch validation study has been performed in a small sample (N = 40) of elderly patients admitted to a nursing house.18 The Dutch translation is not freely available however, and has not been confirmed by the original author of the BRS. Therefore the aim of this study was to formally translate the BRS into Dutch (BRS‐DLV) and to test the reliability and validity of the BRS‐DLV in a cohort of workers. Additionally, the validity of the BRS‐DLV will be compared to other language versions and implications will be discussed.
2. METHODS
2.1. Design and participants
A cross‐sectional design was carried out. In the Netherlands, employers of moderate and large companies are required to offer their workers a voluntary health assessment, performed by an independent occupational healthcare supplier (OHS). Data from workers’ health assessment were collected between November 2015 and June 2016. In the Netherlands, employers are obligated to offer their workers a health surveillance, therefore, workers from divisions of 12 companies in the Netherlands were recruited via open advertisements on the work floor. Participation was on voluntary basis. Workers were a mix of both blue and white collar workers. All workers between 18 and 65 years of age were invited to participate. Excluded were workers who were on sick leave at the time of the workers’ health assessment or workers who were on temporary work.
2.2. Ethics
This study was performed within care as usual, however the BRS was added to the original protocol. The Medical Ethics Committee of the University Medical Center Groningen in the Netherlands decided that formal approval of the study was not necessary, because all workers were subjected to care as usual only. The research team analyzed all data anonymously. All participants signed informed consent stating that their data will be used for scientific purposes and all data will be handled anonymously. Employers were kept unaware of the results of the individual worker. This study has been performed in accordance with the Declaration of Helsinki.
2.3. Measurements
The following questionnaires were administered:
Resilience was measured with a new Dutch forward‐backward translation of the Brief Resilience Scale (BRS‐DLV). The original Brief Resilience Scale was developed by Smith et al,19 who also verified this Dutch version. The BRS‐DLV contains six items scored on a 5‐point Likert scale from 1 = strongly disagree to 5 = strongly agree. Items 2, 4 and 6 are negatively phrased, for example “I tend to take a long time to get over set‐backs in my life”. Total scores were mean scores of all answers and thus ranged from one to five. Higher scores indicate a better developed ability of resilience. The original BRS and its Dutch translation can be found in Appendix A. A factor analysis showed that the BRS is unidimensional and 55%‐67% of the variance could be explained by this factor. Cronbach's alpha was between 0.80 and 0.91 and test‐retest reliability was 0.69 for 1 month and 0.62 for 3 months.13
Work Ability was measured with the short form of the Work Ability Index (WAI‐SF). The WAI‐SF consists of seven items.19 The WAI‐SF has been shown to be valid for determination of sustained employability 20 and is internally consistent (Cronbach's alpha 0.72‐0.80).21 The scale ranges between 7 to 49, with higher scores indicating better workability.
Work Engagement was measured with the Utrecht Work Engagement Scale‐9 (UWES‐9).22, 23 The UWES‐9 consists of nine questions and measures “work engagement”. It consists of three subscales, measuring dedication (three questions), vigor (three questions), and absorption (three questions), with a 0‐6 point scale per question. The total scale ranges between 0 to54, with a higher score indicating more engagement. Model fit of the three subscales is good (RMSEA:0.04; NFI and CFI>0.95). Psychometric properties of the questionnaire are good.22, 23
Psychological problems were measured with the General Health Questionnaire‐1224, 25 consisting of 12 questions with 4 possible answers; 2 are valued positive (score =0) and 2 negative (score =1). The scale ranges between 0‐12, with a lower score indicating less functional psychological problems. Internal consistency is good with Cronbach's α = 0.90.24
Perceived Workload was measured with subscales of the Questionnaire on the Experience and Evaluation of Work (QEEW, in Dutch: VBBA)26: Need for recovery (11 items) – Work pace (11 items) ‐ Perceived mental strain (9 items). Subscale scores range between 0‐100, and a lower score indicates more favorable situations. Internal consistency varies between 0.67 and 0.94 (Cronbach's α) .26
-
A lifestyle questionnaire asking about Physical Activity, Smoking, Alcohol, Nutrition and Recreation. The questionnaire is descriptive in nature, based on the Dutch guidelines27 and has not been validated as an outcome measure. Altogether the questionnaire contained 72 questions. 22 questions were about physical activity, 14 about smoking, 11 questions about alcohol, 15 questions about diet, and 10 questions concerning recreation. Results are scored on a dichotomous scale, with a zero reflecting healthy behavior and behavior with moderate and high risk were scored 1. The cut‐off values for healthy behavior were:
Physical activity: at least 5 days per week for 30 minutes low intensity activity AND at least 2 days per week 20 minutes intensity activity.
Smoking: non‐smoker.
Alcohol: ≤5 days per week and ≤15 drinks per week.
Nutrition: ≥4 days per week 3 meals plus ≥4 days per week 200 gram vegetables.
Recreation: ≤ 4 points on eight items on recreation and sleep and two items on motivation to change was considered healthy behavior. Recreation and sleep were scored on a 0‐2 scale (0: no problems 2: frequently problems). Motivation to change unhealthy behavior was scored with 0 or 4 (0: not motivated 4: motivated).
Personal (age, sex, level of education) and work characteristics (working hours per week, number of years employed) were collected.
2.4. Analyses
2.4.1. Missing values, normality and floor/ceiling effects
The questionnaire was sent online. The online questionnaire could not be completed unless all questions were answered. Normality was checked and floor and ceiling effects are presented and were considered relevant when>15%.28
2.4.2. Construct validity
Following the COSMIN criteria, construct validity was defined as the degree to which the scores of the instrument are consistent with hypotheses based on the assumption that the instrument validly measures the construct to be measured.28 Construct validity covers cross cultural validity (the degree to which the performance of the items on a translated or culturally adapted instrument is an adequate reflection of the performance of the items of the original version of the instrument), structural validity (the degree to which the scores of the BRS is an adequate reflection of the dimensionality of the construct to be measured) and hypotheses testing.
2.5. Cross cultural validity
The BRS was translated with a forward‐backward translation by two independent native professional translators and was discussed with two of the researchers (RS, MSD) to make sure the goal of the questionnaire was maintained. The first author of the original BRS study approved the final backward‐translated version.
2.6. Structural validity
To study the structural validity, two databases were randomly (sampling method with replacement) drawn from the total database consisting of 1023 cases. The first representing 511 and the second representing 512 cases. Because the BRS has been validated previously with mixed results, and no data in cohorts of workers are available, an exploratory factor analysis (EFA) was performed on the first dataset. Confirmatory factor analyses (CFA) were performed on the second dataset with one and two‐factor structure solutions. Structural equation modeling with maximum likelihood was applied on EFA and CFA. Competing factor structures (1 and 2 factors) were tested on optimal fitting of the model. To test best model fit, multiple fit indices were calculated. A Chi‐square test was performed to test the overall structure of the model, reflecting its underlying data. The Comparative Fit Index (CFI) and Tucker Lewis Index (TLI) were inspected to correct for sample size sensitivity. The standardized root mean‐square residual (SRMS) and the root mean‐square error of approximation (RMSEA) were calculated to detect misfitting of the model, Akaike's information criterion (AIC) was used to balance the goodness‐of‐fit model with parsimony in number of parameters being estimated. The following cut points were used to determine model fit: A non‐significant Chi‐square test is preferred, with lower values indicating better fit. CFI and TLI >0.95,29 SRMR is adequate with values <0.0830 and RMSEA <0.05 reflects a close fit .31
2.7. Checking model robustness
In the validation study of the Spanish BRS two latent factors were identified as “positively formulated and negatively formulated items”. This could be due to respondents having difficulty with reversal of the even items (item 2,4,6 of the BRS).14 The reversal of items was originally intended by the authors to “reduce the effects of social desirability and positive response bias13”. To control for these possible inconsistencies and check if reversal of items does what they intend (identify social desirability and positive response bias), it was decided to manually remove all respondents filling in patterns unlikely to reflect resilience. To do so we manually removed all patterns reflecting six times on the high or the low end of the scale. For example six times “(strongly) disagree” or “(strongly) agree” is very unlikely to reflect a one‐factor structure of resilience. To check for consistency of the manual removal, latent class analyses were performed to identify if inconsistent patterns can be reflected by a latent class. After removal of inconsistent patterns, a robustness check was performed and all analyses were reran. Factor analyses were performed with MPlus 8.0. P‐values < 0.05 are considered significant.
2.8. Hypothesis testing
Pearson correlation coefficients for continuous data or independent t‐tests with dichotomous variables were calculated with related constructs. For hypothesis testing, studies were identified with significant correlations between resilience and psychological complaints,9 smoking,10 engagement,8 recreation11 and diet.12 Therefore hypothesis testing was performed with five related constructs: Workers have significant higher scores on the BRS when they: (a) Do not smoke,10 (b). Spend more time in recreational activity11 and (c) Have a healthy diet.12 The BRS has significant correlations with: (d) psychological complaints9 and (e) with work engagement.8
Furthermore, exploratory hypothesis were tested, although previously in literature, concerning our target group (a) no direct associations were identified between resilience and possible related constructs or (b) associations were reported, but in other study populations: (f) Resilience was related to physical activity in a child population32; (g) Alcohol use was reported to be related to resilience with contradictory results in two studies10, 33; (h,i,j) Work related psychopathology was related to resilience,34 but no direct relations were tested with need for recovery, work ability and work pace; (k) A previous study reported on the relation of burnout and resilience, however this was not directly related to mental strain.35
Interpretation of correlations: 0.00 to 0.25, little or none; 0.26 to 0.50, fair; 0.51 to 0.75, moderate to good; above 0.75, good to excellent.36 Following the COSMIN criteria for hypotheses testing, the criterion of more than 75% confirmed hypothesis was set.28 Hypothesis testing was performed with SPSS 24.
2.8.1. Reliability
To estimate internal consistency, Cronbach's alpha including explained variance was calculated for the best model. A Cronbach's alpha between 0.70 and 0.90 is considered as acceptable internal consistency.37 A minimum of 100 participants is recommended.28
3. RESULTS
3.1. Workers
One thousand and twenty‐three workers were included in the study. Descriptive statistics are provided in Table 1. Included workers were employed in transportation sector (bus companies, car companies), furniture construction, water authorities and included both white and blue collar workers.
Table 1.
Characteristics of workers (N = 1023)
| Characteristic | Mean ± SD or N (%) |
|---|---|
| Gender male | 794 (78) |
| Age | 44 (10) |
| Body mass index | 26.0 (4.5) |
| Years at current work | 10 (10) |
| Working hours per week | 36.6 (6.1) |
| BRS | 3.6 (0.6) |
| WAI‐SF | 42.3 (4.5) |
| Engagement | 4.2 (1.0) |
| Psychological complaints | 1.4 (2.3) |
| Need for recovery | 21.9 (19.1) |
| Work pace | 35.4 (13.5) |
| Perceived mental strain | 70.7 (16.4) |
BRS, Brief Resilience Scale; WAI‐SF, work ability index‐short form.
3.2. Missing values, normality and floor/ceiling effects
All workers provided full data. Mean (3.6), median (3.7), mode (4), skewness (0.07) and kurtosis (0.05) indicate a normal distribution. There was no minimal score (floor effect). Ceiling effect was present in 21 cases (5%) and was considered irrelevant. The cases were included and analyzed as normal.
3.3. Construct validity
The first dataset consisted of 511 for EFA and the second of 512 respondents for CFA.
3.3.1. Structural validity
Results from both the EFA and CFA indicate that the one‐factor structure has insufficient model fit coefficients (Higher χ2 compared to a two‐factor structure, TLI, SRMR and RMSEA below the predefined cut‐off score). The two‐factor structure showed good fit indices in both EFA and CFA and performs better than the one‐factor structure on all model fit indices. Comparison of the two models is presented in Table 2. In Figure 1, the factor model and factor loadings of the best performing model (model 4; Table 2) are presented.
Table 2.
Fit indices of EFA and CFA of one and two‐factor models
| Model | Description | N | Model χ2 | df | P | CFI | TLI | SRMR | RMSEA (90CI) | AIC |
|---|---|---|---|---|---|---|---|---|---|---|
| 1 | EFA (1 factor) | 511 | 86.1 | 9 | <0.01 | 0.90 | 0.83 | 0.06 | 0.13 (0.11‐0.16) | 7479 |
| 2 | EFA (2 factors) | 511 | 11.4 | 4 | 0.02 | 0.99 | 0.96 | 0.02 | 0.06 (0.02‐0.10) | 7414 |
| 3 | CFA 1 factor | 512 | 65.2 | 9 | <0.01 | 0.93 | 0.88 | 0.05 | 0.11 (0.09‐0.14) | 7376 |
| 4 | CFA 2 factors | 512 | 25.4 | 8 | <0.01 | 0.98 | 0.96 | 0.03 | 0.07 (0.04‐0.1) | 7338 |
EFA, exploratory factor analysis; CFA, confirmatory factor analysis; χ2, chi square; df, degrees of freedom; CFI Comparative Fit Index; TLI, Tucker Lewis Index; SRMR, standardized root mean‐square residual; RMSEA, root mean square error of approximation; AIC, Akaike's information criterion.
Figure 1.
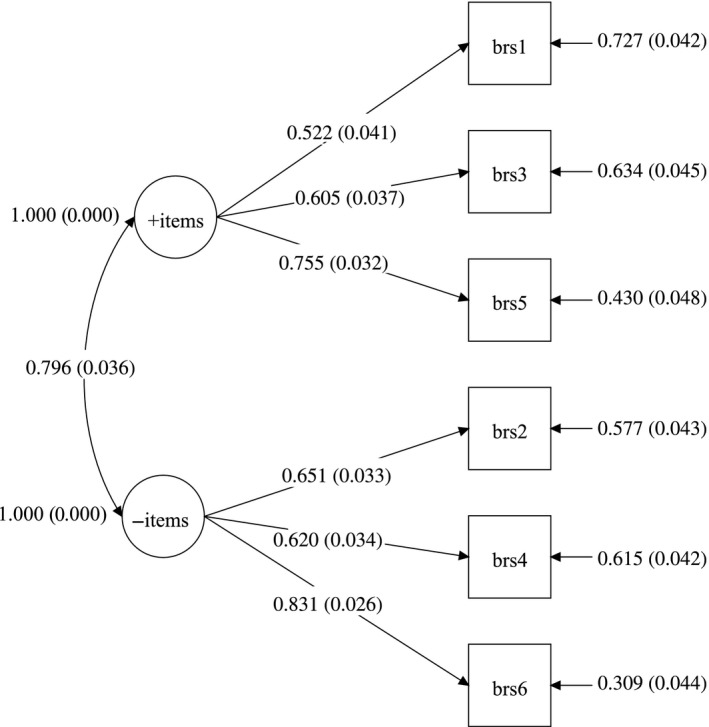
Factor loadings and correlations between factors of Confirmatory Factor Analysis structure of model 4 as presented in Table 2
3.3.2. Robustness inconsistency
In total, 24 cases (5%) from the first dataset were excluded and 15 cases (3%) from the second database were excluded, because of inconsistent answering (see explanation under the header “checking model robustness” in the Methods section). With latent class analyses on the first dataset, a solution with five latent classes (Entropy: 0.97; meaning good separation of classes)38 was identified, in which one class (N = 24) represented the cases that were manually removed. After rerunning the analyses, it appeared that both a one‐factor and a two‐factor have excellent fit indices (see Table 3). It appeared that, when allowing correlated measurement error in the model, the model fit significantly improved. There was, however, no plausible rationale for these correlations. Therefore, it was decided to not include this in our final model. The factor models of both CFAs (models 7 and 8 in Table 3) are presented in Figure 2A,B.
Table 3.
Robustness analysis presenting fit indices after removal of inconsistent answers
| Model | Description | N | Model χ2 | df | P | CFI | TLI | SRMR | RMSEA (90% CI) | AIC |
|---|---|---|---|---|---|---|---|---|---|---|
| 5 | EFA 1 factor | 487 | 46.8 | 9 | <0.01 | 0.95 | 0.92 | 0.04 | 0.09 (0.07‐0.12) | 6803 |
| 6 | EFA 2 factor | 487 | 15.6 | 4 | <0.01 | 0.99 | 0.94 | 0.02 | 0.08 (0.04‐0.12) | 6781 |
| 7 | CFA 1 | 497 | 16.5 | 9 | 0.06 | 0.99 | 0.99 | 0.02 | 0.04 (0.00‐0.07) | 6875 |
| 8 | CFA 2 | 497 | 11.4 | 8 | 0.18 | 1.0 | 0.99 | 0.02 | 0.03 (0.00‐0.07) | 6872 |
EFA, exploratory factor analysis; CFA, confirmatory factor analysis; χ2, chi square; df, degrees of freedom; CFI Comparative Fit Index; TLI, Tucker Lewis Index; SRMR, standardized root mean‐square residual; RMSEA, root mean square error of approximation; AIC: Akaike's information criterion.
Figure 2.
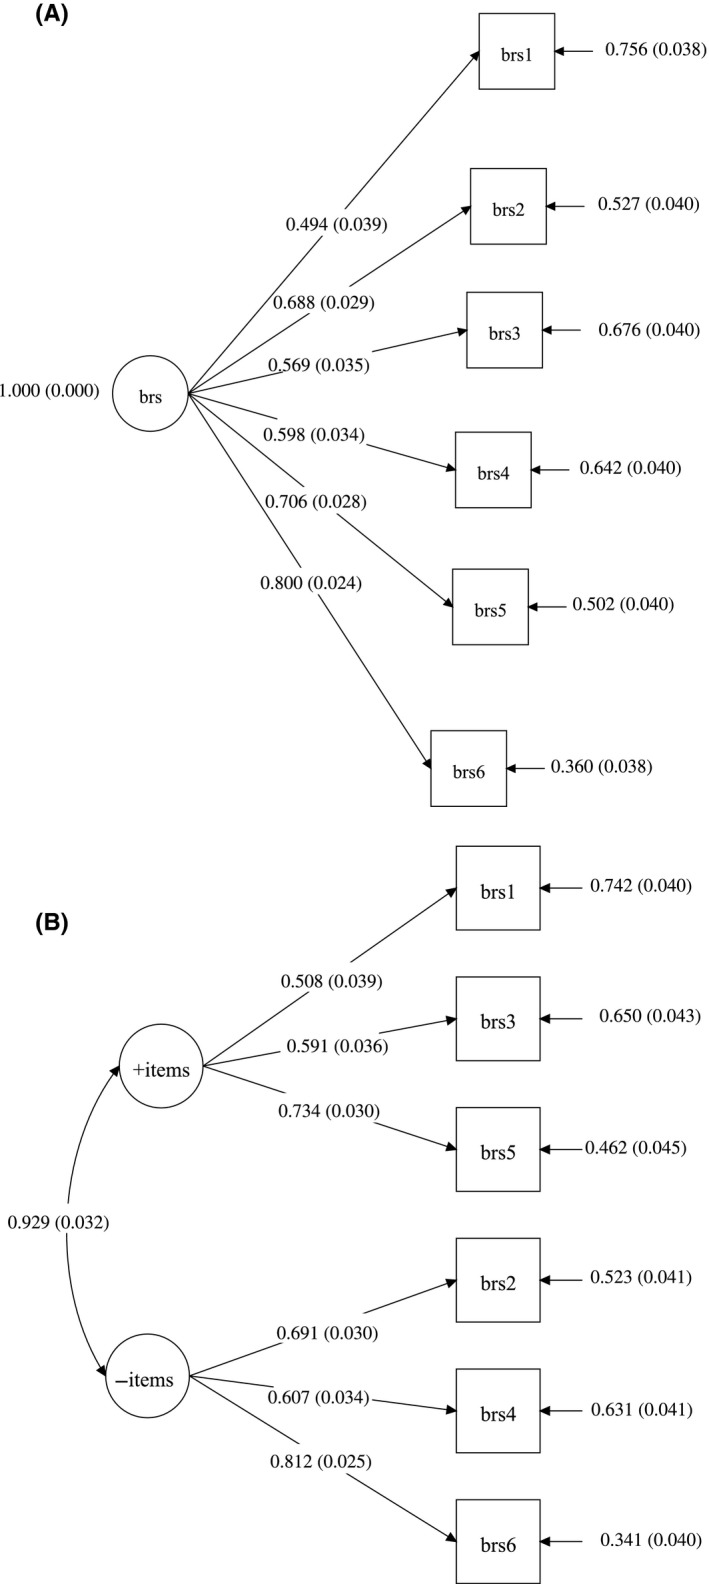
(A, B) Factor loadings and correlations between factors of Confirmatory Factor Analysis structure of a one‐factor structure (A) and a two‐factor structure (B) including factor loadings. Figure 2A represents Model 7 and figure 2B represents model 8
3.3.3. Hypothesis testing
Data of 28 cases were excluded, because of inconsistent answering. The results of 995 participants are presented. In Table 4, correlations and t‐tests of the BRS and related constructs are presented. Based on results, 5 out of the 5 hypotheses were confirmed, which support construct validity. Additionally, in the exploratory hypotheses, significant correlations were found with need for recovery and the work ability index. Work pace, perceived mental strain, alcohol use and physical activity appeared not to be related in this study sample.
Table 4.
Correlations of the BRS with other health related state measures
| Hypothesis number | Measure | Correlation coefficient or t‐value | P‐value | Hypothesis met? |
|---|---|---|---|---|
| 1 | Smokinga | −2.1 | 0.03 | Yes |
| 2 | Recreationa | 3.73 | <0.01 | Yes |
| 3 | Dieta | 4.05 | <0.01 | Yes |
| 4 | Psychological complaints | −0.33 | <0.01 | Yes |
| 5 | Engagement | 0.34 | <0.01 | Yes |
| Exploratory hypotheses | ||||
| 6 | Physical activitya | −1.3 | 0.18 | No |
| 7 | Alcohola | −0.87 | 0.39 | No |
| 8 | Need for recovery | −0.33 | <0.01 | Yes |
| 9 | Work ability index | 0.40 | <0.01 | Yes |
| 10 | Work pace | −0.07 | 0.06 | No |
| 11 | Perceived mental strain | −0.04 | 0.11 | No |
t‐values.
3.4. Reliability
Internal consistency was presented for model 7 because this model is theoretically most sound. The Cronbach's alpha of model 7 was 0.78. Total explained variance of the model was 49%.
4. DISCUSSION
The results of this study indicate that the BRS‐DLV is internally consistent and has good model fit in a two‐factor structure similar to the Spanish Version and good fit of a one‐factor structure after removal of inconsistently scored items. Significant correlations of the BRS‐DLV with recreation, diet, smoking, work engagement, need for recovery, work ability and psychological complaints provide evidence for construct validity.
With regards to factor structure, a one‐factor structure of the BRS cannot simply be confirmed in a sample of blue and white collar workers. Previous validation studies of the Portuguese and Spanish BRS reflect our data, however, the conclusion slightly differed. In the Portuguese BRS, it was shown that item 5 did not fit the one‐factor model, which was excluded in their analysis. Furthermore, the one‐factor model only explained 49% of the variance.15 In the Spanish validation study, results of the factor analyses indicated the presence of a second order bifactorial structure, having adequate fit. It is however, arguable if the two latent factors identified as “positive items” and “negative items” have theoretical value, because the structures have no meaning. A more plausible explanation of this bifactorial structure is the reversed order in which questions are formulated. While the original author,13 included these reversed items to increase reliability in a clinical setting, it might be that in an open cohort of workers, this causes a response bias. Another reason may be respondent fatigue because besides the BRS, many questionnaires were administered. This may also be the case in the healthy cohorts in Brazil15 and Spain14 and correction for this response bias should be taken into account when interpreting the results. Compared to the Chinese and Portuguese version (using undergraduate students), explained variance and eigenvalues are not significantly different to our study (46% and 43% respectively compared to 49% in the current study). In the Chinese version, a one‐factor structure with principal component analysis was identified, but CFA was not conducted.17 In the Malaysian version of the BRS, administered in 120 international students, a one‐factor structure was identified with EFA. CFA's were not performed.16 Covariance matrices of those studies were not obtained after contacting the authors by email. Summarized, the BRS appears to have higher internal consistency in clinical settings13, 18 compared to healthy populations.15, 17
With regard to construct validity, all five hypotheses were verified, strengthening the evidence for construct validity. We also identified new correlations with need for recovery and work ability. In contrast to Ho et al,32 there were no significant correlations with physical activity in an adult working population. No correlation was identified with alcohol, which is in accordance to Goldstein et al.10 With regards to physical activity, we found no correlations. A previous study, however, did find that resilience mediates the relation between regular physical exercise and depression.39 They found small but significant differences between resilience and regular physical exercise. It is unclear how exactly these differences can be interpreted, but one reason could be that both measurement instruments differed from the current study.
A general strength of this study was the number of workers included and the minimal number of missing values on the BRS (zero). Next, this study was performed in daily life including workers in a broad range of professions. This enables the use of the BRS‐DLV for use in daily occupational health care.
A limitation of this study is the use of the lifestyle questionnaire, reflecting the constructs of exercise, smoking, alcohol, recreation and diet. While the questionnaire has been advised by Dutch National Institute for Public Health and the Environment, the questionnaire itself has not been extensively validated.27 We chose however to use this questionnaire, to keep the burden for workers as low as possible. Additionally, longitudinal validity (ie responsiveness) has not been tested in this study and should be the object of future study. Reproducing the study in more clinical setting with patients suffering from psychopathology will give better insight in the usability of the BRS‐DLV for clinical purposes. A third limitation is the manual removal of invalid answering patterns. The original author did not provide any quantitative cut‐scores for removal. However, we resolved this by checking the removal pattern post hoc with latent class analyses, which led to similar outcomes. It was therefore concluded that manual removal of invalid answering patterns is feasible by clinical observation. Future studies may focus on identification of social desirability answers of respondents with latent class analyses. Lastly, the recruitment of subjects went via open advertisements. This could have led to selection bias which limits generizability to the whole working population.
5. CONCLUSION
Concluding, reversal of items indeed leads to identification of a small sub‐group having inconsistent answering patterns. After removing these respondents manually, a one‐factor structure has good model fit and reliability and construct validity of the Dutch Language Version of the BRS are good. It is advised to both clinicians and researchers to be aware for inconsistent answering of respondents by checking and if needed correcting the data.
DISCLOSURE
Approval of the research protocol: The research protocol was approved by the medical ethics committee of Groningen, The Netherlands. Informed consent: All participants signed informed consent prior to participation. Registry and registration number: N/A. Animal studies: N/A.
CONFLICT OF INTEREST
The funding for this study was provided by expertise center Tech for Future in the Netherlands: number TFF150101. The funding source had no role in the design, practice or analysis of this study. Authors declare no Conflict of Interests for this article.
AUTHOR CONTRIBUTION
RS, MSD, HJB, RES, FGO and KMS made substantial contributions to the conception or design of the research or the acquisition and analysis of data. RS, MSD, HJB, RES, FGO, KMS and MFR: Drafting the work or revising it critically for important intellectual content. RS, MSD, HJB, RES, FGO, KMS and MFR: Final approval of the version to be published. RS, MSD, HJB, RES, FGO, KMS and MFR: Agreement to be accountable for all aspects of the work in ensuring that questions related to the accuracy or integrity of any part of the work are appropriately investigated and resolved.
ACKNOWLEDGMENT
We thank Immens/Informens B.V. for their help in data collection. This study was funded by expertise center Tech for Future in the Netherlands: number TFF150101.
APPENDIX A.
BRIEF RESILIENCE SCALE AND DUTCH TRANSLATION
| Item | English BRS | Dutch language version of the BRS |
|---|---|---|
| 1 | I tend to bounce back quickly after hard times | Na een moeilijke periode veer ik meestal gemakkelijk weer terug |
| 2 | I have a hard time making it through stressful events (R) | Ik vind het moeilijk om me door stressvolle gebeurtenissen heen te slaan. (R) |
| 3 | It does not take me long to recover from a stressful event | Het kost me weinig tijd om te herstellen van een stressvolle gebeurtenis |
| 4 | It is hard for me to snap back when something bad happens (R) | Ik vind het moeilijk om het snel van me af te schudden als er iets ergs is gebeurd. (R) |
| 5 | I usually come through difficult times with little trouble | Ik sla me meestal redelijk probleemloos door moeilijke periodes heen. |
| 6 | I tend to take a long time to get over set‐backs in my life (R) | Het kost me meestal veel tijd om over tegenslagen in mijn leven heen te komen. (R) |
Items can be scored on a 5‐point Likert scale: 1 = strongly disagree; 2 = disagree; 3 = neutral; 4 = agree; 5 = strongly agree
(R)= Reverse Items (5 = 1, 4 = 2, 3 = 3, 2 = 4, 1 = 5)
Soer R, Six Dijkstra MWMC, Bieleman HJ, et al. Measurement properties and implications of the Brief Resilience Scale in healthy workers. J Occup Health. 2019;61:242–250. 10.1002/1348-9585.12041
REFERENCES
- 1. Ozer EJ, Best SR, Lipsey TL, et al. Predictors of posttraumatic stress disorder and symptoms in adults: a meta‐analysis. Psychol Bull. 2003;129(1):52‐73. [DOI] [PubMed] [Google Scholar]
- 2. Shalev AY, Freedman S, Peri T, et al. Prospective study of posttraumatic stress disorder and depression following trauma. Am J Psychiatry. 1998;155(5):630‐637. [DOI] [PubMed] [Google Scholar]
- 3. Windle G, Bennett KM, Noyes J. A methodological review of resilience measurement scales. Health Qual Life Outcomes. 2011;4(9):pp. 8‐7525‐9‐8. [DOI] [PMC free article] [PubMed] [Google Scholar]
- 4. Zautra AJ, Arewasikporn A, Davis MC. Resilience, promoting well‐being through recovery, sustainability and growth. Res Hum Dev. 2010;7(3):221‐238. [Google Scholar]
- 5. Mancini AD, Bonanno GA. Resilience in the face of potential trauma: clinical practices and illustrations. J Clin Psychol. 2006;62(8):971‐985. [DOI] [PubMed] [Google Scholar]
- 6. Mancini AD, Bonanno GA. Predictors and parameters of resilience to loss: toward an individual differences model. J Pers. 2009;77(6):1805‐1832. [DOI] [PMC free article] [PubMed] [Google Scholar]
- 7. Portzky M, Wagnild G, De Bacquer D, et al. Psychometric evaluation of the Dutch Resilience Scale RS‐nl on 3265 healthy participants: a confirmation of the association between age and resilience found with the Swedish version. Scand J Caring Sci. 2010;24(Suppl 1):86‐92. [DOI] [PubMed] [Google Scholar]
- 8. Mache S, Vitzthum K, Wanke E, et al. Exploring the impact of resilience, self‐efficacy, optimism and organizational resources on work engagement. Work. 2014;47(4):491‐500. [DOI] [PubMed] [Google Scholar]
- 9. Hopkins KD, Shepherd CC, Taylor CL. Relationships between Psychosocial Resilience and Physical Health Status of Western Australian Urban Aboriginal Youth. PLoS ONE. 2015;10(12):e0145382. [DOI] [PMC free article] [PubMed] [Google Scholar]
- 10. Goldstein AL, Faulkner B, Wekerle C. The relationship among internal resilience, smoking, alcohol use, and depression symptoms in emerging adults transitioning out of child welfare. Child Abuse Negl. 2013;37(1):22‐32. [DOI] [PubMed] [Google Scholar]
- 11. Buchecker M, Degenhardt B. The effects of urban inhabitants’ nearby outdoor recreation on their well‐being and their psychological resilience. J Outdoor Recreation Tourism. 2015;10:55‐62. [Google Scholar]
- 12. Lutz LJ, Gaffney‐Stomberg E, Williams KW, et al. Adherence to the dietary guidelines for Americans is associated with psychological resilience in young adults: a cross‐sectional study. J Acad Nutr Diet. 2017;117(3):396‐403. [DOI] [PubMed] [Google Scholar]
- 13. Smith BW, Dalen J, Wiggins K, et al. The brief resilience scale: assessing the ability to bounce back. Int J Behav Med. 2008;15(3):194‐200. [DOI] [PubMed] [Google Scholar]
- 14. Rodriguez‐Rey R, Alonso‐Tapia J, Hernansaiz‐Garrido H. Reliability and validity of the Brief Resilience Scale (BRS) Spanish Version. Psychol Assess. 2016;28(5):e101‐e110. [DOI] [PubMed] [Google Scholar]
- 15. Lins G, Hanel P, Cavalcanti TM, et al. Brief Resilience Scale: Testing its factorial structure and invariance in Brazil. Universitas Psychologica. 2016;15(2):397‐408. [Google Scholar]
- 16. Amat S, Subhan MhD, Wan Jaafar WM, et al. Evaluation and psychometric status of the brief resilience scale in a sample of Malaysian International students. Asian Soc Sci. 2014;10(18):240‐245. [Google Scholar]
- 17. Lai J, Yue XD. Using the brief resilience scale to assess Chinese people's ability to bounce back from stress . Sage Open. 2014;4;242‐250. [Google Scholar]
- 18. Leontjevas R, de Beek WO, Lataster J, Jacobs N. Resilience to affective disorders: a comparative validation of two resilience scales. J Affect Disord. 2014;168:262‐268. [DOI] [PubMed] [Google Scholar]
- 19. Tuomi K, Ilmarinen J, Jahkola A, et al. The Work Ability Index, 2nd edn Helsinki: Helsinki Finnish Institute of Occupational Health;1998. [Google Scholar]
- 20. Alavinia SM, de Boer AG, van Duivenbooden JC, et al. Determinants of work ability and its predictive value for disability. Occup Med (Lond). 2009;59(1):32‐37. [DOI] [PubMed] [Google Scholar]
- 21. Tuomi K, Vanhala S, Nykyri E, Janhonen M. Organizational practices, work demands and the well‐being of employees: a follow‐up study in the metal industry and retail trade. Occup Med (Lond). 2004;54(2):115‐121. [DOI] [PubMed] [Google Scholar]
- 22. Schaufeli WB, Bakker AB. Test manual for the Utrecht Work Engagement Scale. Utrecht: The Netherlands; 2003. [Google Scholar]
- 23. Schaufeli WB, Bakker AB, Salanova M. The measurement of work engagement with a short questionnaire ‐ a cross‐national study. Educ Psychol Manag. 2006;66(4):701‐716. [Google Scholar]
- 24. Koeter M, Ormel J. General Health Questionnaire, Nederlandse bewerking: Handleiding. The Netherlands: Lisse; 1991. [Google Scholar]
- 25. Sluiter JK, Hulshof C. Hulpdocument voor bedrijfsartsen bij de ontwikkeling en uitvoering van preventief medisch onderzoek bij werkenden. (translation: guide for occupational physicians for developing and applying a preventive medical exam for workers). Amsterdam, The Netherlands: Coronel Institute for Work and Health;2013. [Google Scholar]
- 26. vanVeldhoven M, Meijman TF, Broersen J, Fortuin RJ. Handleiding VBBA. Amsterdam, The Netherlands: SKB Vragenlijst Services; 2002. [Google Scholar]
- 27. National Institute for Public Health and the Environment, RIVM . Nationaal Zorgkompas 2016. 2016; https://www.volksgezondheidenzorg.info, Dec 10, 2016.
- 28. Mokkink LB, Terwee CB, Knol DL, et al. The COSMIN checklist for evaluating the methodological quality of studies on measurement properties: a clarification of its content. BMC Med Res Methodol. 2010;18(10):22. [DOI] [PMC free article] [PubMed] [Google Scholar]
- 29. Ullman JB, Bentler PM. Structural Equation Modelling In: Weiner IB, Schinka JA, Velicer WF, eds. Handbook of Psychology. 2nd ed Hoboken NJ: John Wiley and Sons inc; 2003. p. 607–634. [Google Scholar]
- 30. Hu L, Bentler PM. Fit indices in covariance structural equation modeling: sensitivity to underparameterized model misspecification. Psychol Method. 1998;3:424‐453. [Google Scholar]
- 31. MacCallum RC, Browne MW, Hazuki MS. Power analysis and determination of sample size for covariance structure modeling. Psychol Method. 1996;1(2):130‐149. [Google Scholar]
- 32. Ho FK, Louie LH, Chow CB, et al. Physical activity improves mental health through resilience in Hong Kong Chinese adolescents. BMC Pediatr. 2015;22(15):48. [DOI] [PMC free article] [PubMed] [Google Scholar]
- 33. Green KT, Beckham JC, Youssef N, Elbogen EB. Alcohol misuse and psychological resilience among U.S. Iraq and Afghanistan era veterans. Addict Behav. 2014;39(2):406‐413. [DOI] [PMC free article] [PubMed] [Google Scholar]
- 34. Rees CS, Breen LJ, Cusack L, Hegney D. Understanding individual resilience in the workplace: the international collaboration of workforce resilience model. Front Psychol. 2015;4(6):73. [DOI] [PMC free article] [PubMed] [Google Scholar]
- 35. Rushton CH, Batcheller J, Schroeder K, Donohue P. Burnout and resilience among nurses practicing in high‐intensity settings. Am J Crit Care. 2015;24(5):412‐420. [DOI] [PubMed] [Google Scholar]
- 36. Portney LG, Watkins AD. Foundations of Clinical Research; Applications to Practice, 3rd edn Upper Saddle River, NJ: Pearson Prentice Hall, Inc; 2009. [Google Scholar]
- 37. Streiner DL, Norman GR. Health Measurement Scales: A Practical Guide to their Development and Use, 4th edn New York, NY: Oxford University Press Inc.; 2008. [Google Scholar]
- 38. Asparouhov T, Muthén BO. Auxiliary variables in mixture modeling: a 3‐Step approach using Mplus. February 7, 2013;No. 15.
- 39. Yoshikawa E, Nishi D, Matsuoka Y. Association between regular physical exercise and depressive symptoms mediated through social support and resilience in Japanese company workers: a cross‐sectional study. BMC Public Health. 2016;16(553):242‐8. [DOI] [PMC free article] [PubMed] [Google Scholar]