

SUMMARY
The majority of individuals with amyotrophic lateral sclerosis (ALS) and frontotemporal dementia (FTD) exhibit neuronal cytoplasmic inclusions rich in the RNA binding protein TDP43. Even so, the relation between the RNA binding properties of TDP43 and neurodegeneration remains obscure. Here, we show that engineered mutations disrupting a salt bridge between the RNA recognition motifs of TDP43 interfere with RNA binding and eliminate the recognition of native TDP43 substrates. The same mutations dramatically destabilize TDP43, alter its subcellular localization, and abrogate TDP43-dependent neuro-degeneration. Worms harboring homologous TDP-1 mutations phenocopy knockout strains, confirming the necessity of salt bridge residues for TDP43 function. Moreover, the accumulation of functional TDP43, but not RNA binding-deficient variants, disproportionately affects transcripts encoding ribo-some and oxidative phosphorylation components. These studies demonstrate the significance of the salt bridge in sustaining TDP43 stability and RNA binding properties, factors that are crucial for neurodegeneration arising from TDP43 deposition in ALS and FTD.
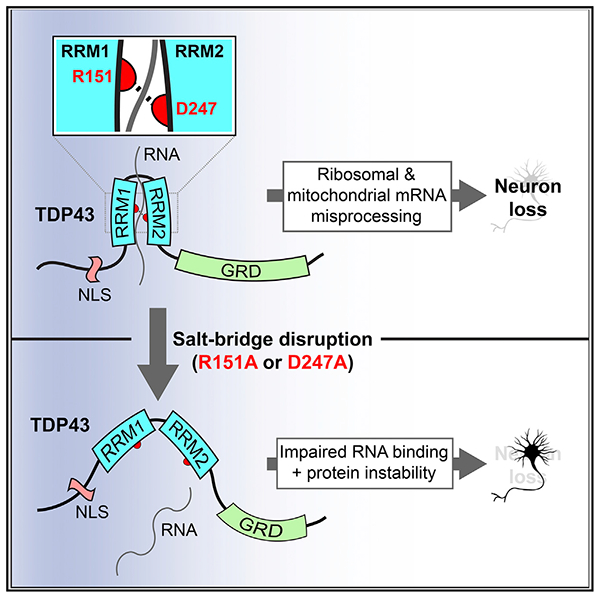
Graphical Abstract
In Brief
Flores et al. uncover essential roles for an intramolecular salt bridge in the function of TDP43, an RNA binding protein implicated in neurodegenerative diseases. Salt bridge interruption attenuates TDP43 RNA binding affinity and specificity, destabilizes the protein, and prevents TDP43-mediated neurotoxicity arising from misprocessing of ribosomal and mitochondrial transcripts.
INTRODUCTION
Amyotrophic lateral sclerosis (ALS) and frontotemporal dementia (FTD) share key genetic and pathologic features (Robberecht and Philips, 2013). Mutations affecting several RNA binding proteins (RBPs) cause familial ALS and FTD, including TDP43, fused in sarcoma (FUS), heterogeneous nuclear ribonucleoprotein A1 (hnRNPA1) and hnRNPA2B1, matrin-3 (MATR3), and T-cell intracellular antigen 1 (TIA1) (Therrien et al., 2016). Many of the most common mutations responsible for ALS and FTD, including C9orf72 hexanucleotide expansions (DeJesus-Hernandez et al., 2011; Renton et al., 2011), result in neuronal cytoplasmic inclusions rich in TDP43 (Neumann et al., 2006; Arai et al., 2006), a nuclear RBP involved in RNA processing, stability, and transport (Ratti and Buratti, 2016), and TDP43 pathology likewise characterizes the majority of sporadic ALS and FTD cases (Neumann et al., 2006). These observations implicate dysfunctional RNA metabolism as a convergent pathogenic mechanism responsible for neurodegeneration in ALS and FTD (Barmada, 2015).
TDP43 contains 2 highly conserved RNA recognition motifs (RRM1 and RRM2) that exhibit distinct properties. RRM1 has a higher affinity for RNA, while RRM2 enhances the specificity of RNA recognition by RRM1 (Buratti and Baralle, 2001; Ayala et al., 2005; Kuo et al., 2009; Furukawa et al., 2016). In Drosophila, RRM1 deletion or substitution of Trp113 to Ala eliminates RNA binding and prevents TDP43-mediated toxicity (Ayala et al., 2005; Ihara et al., 2013). Likewise, the mutation of 2 key phenylalanine residues (Phe147/149 to Leu) within RRM1 interferes with RNA binding (Buratti and Baralle, 2001; Ayala et al., 2011), and similar mutations rescue TDP43-dependent toxicity in yeast and Drosophila (Elden et al., 2010; Voigt et al., 2010). Despite the apparently critical relation between RNA binding and TDP43-mediated toxicity, little is known about the significance of TDP43 sequence-specific RNA binding and the RNA substrates mediating TDP43-related neuron loss.
More than 40 different pathogenic mutations within the gene encoding TDP43 (TARDBP) underlie familial ALS, FTD, or both (Barmada and Finkbeiner, 2010). Disease-associated TARDBP mutations elicit gain-of-function toxicity by interfering with TDP43 autoregulation (White et al., 2018; Fratta et al., 2018; Koyama et al., 2016), enhancing cytoplasmic TDP43 mislocalization and deposition, and affecting TDP43 clearance (Barmada et al., 2010, 2014; Nishimura et al., 2014; Watanabe et al., 2013; Ling et al., 2010). Supporting the link between TDP43 turnover and neurodegeneration, toxicity is directly proportional to TDP43 abundance in individual neurons, and accelerating TDP43 turnover extends neuronal survival and mitigates disease phenotypes in disease models (Barmada et al., 2014). In addition, TDP43 in primary neurons displays a longer half-life than it does in fibroblasts or transformed cell lines (Barmada et al., 2014; Watanabe et al., 2013; Ling et al., 2013), indicating preferential stabilization of the protein in neurons and suggesting cell type-specific differences that could contribute to selective neuronal vulnerability in ALS and FTD. However, the factors responsible for maintaining TDP43 stability are unknown.
Upon RNA binding, intramolecular interactions between RRM1 and RRM2, mediated by a salt bridge between Arg151 (located in RRM1) and Asp247 (located in RRM2) are necessary for maintaining the ability of TDP43 to recognize RNA (Lukavsky et al., 2013). Here, we show that the RRM1-RRM2 salt bridge is pivotal, not only for the RNA binding properties of TDP43 but also for its stability. TDP43 variants lacking the salt bridge are unable to bind RNA substrates, rapidly degraded, and ultimately incapable of triggering neurodegeneration, despite cytoplasmic mislocalization in many cases. Furthermore, although TDP43 overexpression engenders widespread changes in RNA abundance and splicing, most splicing events are unrelated to the RNA binding ability of TDP43. Among the transcripts selectively affected by functional TDP43, the ribosomal and oxidative phosphorylation pathways are strongly enriched, emphasizing a potential role for TDP43 in regulating protein synthesis and energy production.
RESULTS
The R151-D247 Salt Bridge Is Essential for Nucleic Acid Binding by TDP43
To determine the significance of the RRM1-RRM2 salt bridge for TDP43 function, we mutated the residues participating in this interaction—Arg151 (R151) and Asp247 (D247)—to Ala (Figures 1A and 1B). We then purified recombinant TDP43 in Escherichia coli and tested the ability of each variant to bind RNA in vitro via electromobility shift assays (EMSAs). We first asked whether disruption of the RRM1-RRM2 salt bridge affects the affinity of TDP43 for repetitive UG elements (UG12; Buratti and Baralle, 2001; Ayala et al., 2005). Mobility shifts were noted for all three variants (Figure 1C), indicating that the salt bridge is not necessary for RNA binding per se.
Figure 1. Disruption of the R151-D247 Salt Bridge Impairs Nucleic Acid Recognition by TDP43.

(A) Structure of TDP43 RRM1 and RRM2, generated in FirstGlance in Jmol (PDB:4BS2), deposited by Lukavsky et al. (2013). TDP43 (blue) is shown in complex with UG-repeat RNA (green), highlighting the R151-D247 salt bridge (red).
(B) TDP43 schematic depicting the RRM1-RRM2 salt bridge and F147-F149.
(C) EMSA of increasing concentrations (12 fmol–4 pmol) of recombinant TDP43 variants mixed with labeled (UG)12 (100 pM).
(D, F, and H) Increasing concentrations (0.01–25 μM) of TDP43(WT) (D), TDP43(R151A) (F), and TDP43(D247A) (H) were added to labeled (UG)12 (100 pM).
(E, G, and I) Kd and h were calculated from 3 independent replicates for TDP43(WT) (E), TDP43(R151A) (G), and TDP43(D247A) (I).
(J and K) EMSA of TDP43 variants at increasing protein concentrations (0.5–16 pmol) incubated with 100 pM of labeled (GC)12 (J) or (AT)12 (K).
(L and M) RNA IP of EGFP-tagged TDP43(WT), TDP43(F147L, F149L), TDP43(R151A), or TDP43(D247A) expressed in HEK293T cells. The abundance of bound TARDBP (L) or MALAT1 (M) transcripts was measured by qRT-PCR. ****p < 0.0001, one-way ANOVA with Dunnett’s test.
Arrowheads in (C), (D), (F), (H), (J), and (K) indicate protein-DNA complexes, while arrows point to unbound oligonucleotides. For (E), (G), and (I) Kd and h were determined by nonlinear least-squares regression; #p < 0.0001 for comparison with TDP43(WT) by extra sum-of-squares F test. For (L) and (M), data were pooled from 3 independent replicates. All plots show mean ± SEM.
To investigate the affinity and cooperativity of RNA binding by TDP43 variants, we incubated increasing concentrations of protein with a constant amount of labeled (UG)12 (Figures 1D–1I). The calculated dissociation constant (Kd) for TDP43(WT [wild type]) in these assays was 0.35 ± 0.10 nM, which is similar to estimates from previous studies (Buratti and Baralle, 2001; Ayala et al., 2005; Kuo et al., 2009, 2014; Mackness et al., 2014; Furukawa et al., 2016), and the Hill slope (h) was 1.6 ± 0.04, suggesting cooperative binding (Kuo et al., 2009; Tollervey et al., 2011). Both the R151A and D247A mutations significantly reduced the affinity of TDP43 for (UG)12 (Kd = 1.1 ± 0.11 nM and 1.7 ± 0.03 nM, respectively; Figures 1F–1I), without substantially affecting binding cooperativity.
Because TDP43 is capable of recognizing DNA as well as RNA (Buratti and Baralle, 2001; Ayala et al., 2005), we also conducted binding studies using (TG)12 DNA oligonucleotides in place of (UG)12, noting analogous mobility shifts for all 3 TDP43 variants (Figure S1A). Direct titration studies of TDP43(WT) demonstrated a Kd of 7.4 ± 0.34 nM (Figures S1B and S1C), almost 20-fold lower than that for (UG)12. The R151A and D247A mutations further reduced affinity, with respective Kd values of 13.7 ± 1.5 nM and 18.7 ± 16.2 nM (Figures S1D–S1G), and also impaired cooperative binding, as indicated by modest reductions in the calculated Hill slope. These data indicate that the salt bridge is required for maintaining the affinity of TDP43 for UG- and/or TG-rich sequences, but the specific consequences of salt bridge-disrupting mutations are distinct for RNA and DNA.
We next asked whether disruption of the RRM1-RRM2 salt bridge affects the sequence specificity of TDP43. No significant mobility shifts were detected upon the incubation of TDP43(WT), TDP43(R151A), or TDP43(D247A) with (GC)12 sequences, even at the highest protein concentrations (Figure 1J). However, we observed clear shifts for both TDP43(R151A) and TDP43(D247A), but not TDP43(WT), in the presence of (AT)12 oligomers (Figure 1K), suggesting aberrant sequence specificity.
To examine the significance of the RRM1-RRM2 salt bridge for TDP43 RNA binding in cellulo, we overexpressed EGFP-tagged TDP43 variants in HEK293T cells. As a control, we also overexpressed EGFP-tagged TDP43(F147L, F149L), a variant harboring mutations of two critical phenylalanine residues within RRM1 required for nucleic acid binding (Buratti and Baralle, 2001). Following transfection, each TDP43 variant was immuno-precipitated using anti-EGFP antibodies and bound RNA assessed by qRT-PCR (RNA immunoprecipitation [IP]). As expected, 2 endogenous TDP43 substrates, TARDBP and MALAT1 (Ayala et al., 2011; Tollervey et al., 2011; Bhardwaj et al., 2013; Polymenidou et al., 2011; Guo et al., 2011), were immunoprecipitated with TDP43(WT) but not TDP43(F147L, F149L) (Figures 1L and 1M). We also noted striking reductions in TARDBP and MALAT1 transcripts bound to TDP43(R151A) and TDP43(D247A). In combination with our previous findings, these results indicate that the salt bridge is vital for sequence specificity as well as the affinity of nucleic acid binding by TDP43, and in its absence, TDP43 is unable to recognize native RNA targets.
The RRM1-RRM2 Salt Bridge Is Required for TDP43-Mediated Neurodegeneration
The majority of ALS and FTD cases arise sporadically, yet nevertheless display TDP43 pathology (Neumann et al., 2006; Scialò et al., 2016; Traxinger et al., 2013), and overexpression of TDP43(WT) in multiple model systems reproduces the key features of disease, including cytoplasmic TDP43 mislocalization, ubiquitinated TDP43 aggregates, and neurodegeneration (Elden et al., 2010; Barmada et al., 2010, 2014; Wils et al., 2010; Johnson et al., 2008; Liachko et al., 2010; Wang et al., 2011). Given the effects of salt bridge-disrupting mutations on TDP43 RNA binding (Figure 1) and prior evidence indicating the importance of RNA binding for TDP43-dependent toxicity (Elden et al., 2010; Ihara et al., 2013), we surmised that TDP43(R151A) and TDP43(D247A) would display reduced toxicity in comparison to TDP43(WT) when overexpressed. To test this, we cultured primary mixed cortical neurons from rodents and transfected them with vectors encoding mApple, to visualize the cell body, and EGFP-tagged versions of TDP43(WT), TDP43(R151A), TDP43(D247A), or TDP43(F147L, F149L). Neurons were also transfected with mApple and EGFP alone, as a negative control. Using automated microscopy (Barmada et al., 2010, 2014; Malik et al., 2018; Archbold et al., 2018), we imaged transfected neurons at regularly spaced intervals for 10 days. Individual neurons were tracked and the time of death determined programmatically by assessing the changes in cellular morphology (i.e., blebbing) or loss of mApple fluorescence (Figure 2A), which are sensitive indicators of cell death (Arrasate et al., 2004; Barmada et al., 2014, 2015). Differences in survival were measured relative to a reference group and expressed as a hazard ratio (HR). As in previous investigations (Barmada et al., 2010, 2014, 2015), TDP43(WT) overexpression significantly increased the risk of death over EGFP alone (p < 2 3 10−16). The F147L-F149L mutation effectively reduced TDP43-dependent toxicity: the HR for the comparison of TDP43(F147L, F149L) to TDP43(WT) was 0.27, indicating a >70% reduction in toxicity (Figure 2B). Similarly, the R151A and D247A mutations each decreased the toxicity of overexpressed TDP43 by 75% and 68%, respectively. We noted a further reduction in toxicity upon overexpression of the double mutant TDP43(R151A, D247A) (Figure S1H), which is consistent with residual RNA binding associated with each of the individual mutations (Figure 1).
Figure 2. Disruption of the RRM1-RRM2 Salt Bridge Abrogates TDP43-Mediated Neurotoxicity.

(A) Automated fluorescence microscopy. Individual neurons were programmatically identified (green outlines) and given unique identifiers (numbers). Cell death (red outlines) was determined by loss of fluorescence, rounding of the soma, or elimination of neuritic processes. Scale bar: 20 μm.
(B) Overexpressing TDP43(WT)-EGFP significantly increases the cumulative risk of death compared to EGFP (HR = 5.04, p < 2 × 10⁻¹⁶). Mutations that disrupt the salt bridge (R151A or D247A) or eliminate RNA binding (F147L, F149L) significantly reduce the risk of death compared to neurons expressing TDP43(WT) (HR = 0.25, 0.32, and 0.27, respectively; p < 2 × 10⁻¹⁶ for all comparisons).
(C) Deletion of RRM2 or both RRM1-RRM2 significantly improves survival compared to TDP43(WT) (HR = 0.51 and 0.31, respectively, p < 2 × 10⁻¹⁶ for both comparisons). RRM1 deletion reduces the risk of death compared to TDP43(WT) (HR = 0.26, p < 2 × 10⁻¹⁶) and EGFP alone (HR = 0.7, p < 2 × 10⁻¹⁶).
(D) Expression of TDP43(M337V)-EGFP significantly increases the risk of death (HR = 4.26, p < 2 × 10⁻¹⁶) compared to EGFP. The F147L-F149L, R151A, and D247A mutations significantly reduce the toxicity of TDP43(M337V)-EGFP (HR = 0.34, 0.26, and 0.39, respectively; p < 2 × 10⁻¹⁶ for all comparisons).
n, number of neurons. ***p < 2 × 10⁻¹⁶; Cox proportional hazards. Survival analyses were pooled from 3 independent experiments, with 8 wells per condition for each replicate.
We next asked whether the deletion of RRM1 or RRM2 could recapitulate the effects of each mutation on TDP43-dependent toxicity. When expressed in primary mixed cortical neurons, both TDP43(ΔRRM1) and TDP43(ΔRRM2) were significantly less toxic than TDP43(WT) (p < 2 × 10⁻¹⁶ for both comparisons; Figure 2C). In fact, neurons expressing TDP43(ΔRRM1) displayed a reduced risk of death in comparison to the negative control, suggesting a neuroprotective effect associated with this construct and further implying that RRM1 is necessary for TDP43-related toxicity. Conversely, TDP43(ΔRRM2) overexpression increased the risk of death by 42% in comparison to EGFP alone. In light of the ability of RRM1, but not RRM2, to bind RNA in vitro (Buratti and Baralle, 2001; Kuo et al., 2009; Furukawa et al., 2016), these observations provide strong evidence linking RNA binding to toxicity from TDP43 overexpression.
To determine whether the RRM1-RRM2 salt bridge is required for mutant TDP43-related neurodegeneration, we transfected rodent primary cortical neurons with EGFP alone or EGFP-tagged versions of the pathogenic TDP43(M337V) variant carrying the R151A, D247A, or F147L-F149L mutations. Using automated microscopy and survival analysis, we observed significant reductions in toxicity when the R151A, D247A, or F147L-F149L mutations were introduced on the pathogenic M337V background (Figure 2D). The TDP43(D247A, M337V) double mutant displayed more toxicity than the other variants, suggesting that the D247A mutation prevents most but not all of the neurodegeneration associated with the M337V mutation. Nonetheless, these data demonstrate that the RRM1-RRM2 salt bridge and RNA binding are essential for toxicity caused by the overexpression of WT and pathogenic mutant TDP43.
Mutations that Disrupt the RRM1-RRM2 Salt Bridge Enhance TDP43 Turnover
The RRM1-RRM2 salt bridge helps maintain the tertiary structure of TDP43 (Lukavsky et al., 2013), which in turn may be important for protein folding and stabilization. To assess the stability of TDP43, we turned to optical pulse labeling (OPL), a technique that enables the measurement of protein half-life within living cells (Barmada et al., 2014; Tsvetkov et al., 2013; Gupta et al., 2017). TDP43 variants were tagged with Dendra2, a GFP that is irreversibly converted to a red fluorescent state by 405 nm light (Chudakov et al., 2007) (Figure 3A). Each 405-nm pulse creates a finite amount of photoconverted, red fluorescent TDP43-Dendra2 that is degraded over time, reflecting TDP43-Dendra2 turnover within each cell (Barmada et al., 2014).
Figure 3. Mutations that Interfere with the RRM1-RRM2 Salt Bridge or RNA Binding Destabilize TDP43.

(A) Optical pulse labeling (OPL) of primary cortical neurons. Neurons transfected with EGFP and TDP43-Dendra2 variants were pulsed with 405 nm of light and imaged by automated microscopy. Scale bar: 50 μm.
(B) The R151A, D247A, and F147L-F149L mutations significantly reduce the half-life of TDP43-Dendra2 ****p < 0.01, 1-way ANOVA with Dunnett’s test.
(C) Cumulative frequency plot of protein half-life data. n, number of neurons.
(D) Six hours before OPL, cells were treated with either DMSO or 500 nM MG132.
****p < 0.01, 1-way ANOVA with Tukey’s test. For (B), data pooled from 4 biological replicates. For (D), data accumulated from 400–2,000 cells per condition, over 3 biological replicates. Plots in (B) and (D) show median (horizontal line), interquartile range (box), and maximum/minimum (vertical lines).
Primary cortical neurons were transfected with Dendra2-tagged TDP43 variants and imaged by automated microscopy after a brief 405-nm pulse. Single-cell red fluorescence intensities were tracked over time and the half-life of TDP43 was calculated for neurons expressing each variant (Figures 3B and 3C). In this way, we observed a striking destabilization of TDP43(R151A) and TDP43(D247A)—the median half-life decreased from 58.5 h for TDP43(WT)-Dendra2 to 15.3and 21.8 h for Dendra2-tagged versions of TDP43(R151A) and TDP43(D247A), respectively. The F147L-F149L mutation similarly reduced the half-life of TDP43, indicating that deficiencies in RNA binding, disruption of intramolecular interactions, or both are sufficient to destabilize TDP43.
Many misfolded proteins are quickly degraded by the ubiquitin-proteasome system (UPS) during or soon after translation (Wang et al., 2013). To assess the contribution of the UPS to TDP43 variant clearance, we treated neurons expressing each of the Dendra2-tagged TDP43 variants with MG132, a reversible UPS inhibitor (Kisselev and Goldberg, 2001), and then gauged the protein half-life by OPL (Figure 3D). In each case, MG132 treatment effectively prolonged the half-life of TDP43, almost completely restoring the stability of each RNA binding-deficient variant to that of WT TDP43 (Figure 3D). These results imply that manipulations that prevent TDP43 from binding RNA or interfere with the RRM1-RRM2 salt bridge trigger protein mis-folding and subsequent degradation by the UPS.
Both RNA Binding and Protein Stability Drive TDP43-Dependent Toxicity
To assess whether reduced RNA binding or accelerated protein turnover underlie the ability of salt bridge-disrupting mutations to prevent TDP43-mediated neurodegeneration, we pursued 2 complementary strategies. We asked whether TDP43-related toxicity could be recapitulated by replacing the TDP43 RNA recognition motifs, RRM1 and RRM2, with those of a different RNA binding protein (Figure 4A). Neurons overexpressing TDP43(PUM2), a chimera consisting of the RNA binding domain of Pumilio 2 (PUM2, a murine Puf protein [Van Etten et al., 2012; White et al., 2001]) in place of RRM1 and RRM2, displayed a significantly elevated risk of death in comparison to EGFP alone (p < 2 × 10⁻¹⁶; Figures 4B and 4C). No difference in survival was observed between cells expressing TDP43(WT) or TDP43(PUM2), indicating that the PUM2 RNA binding domain fully complemented RRM1-RRM2 in reproducing TDP43-dependent toxicity. In contrast, only slight toxicity was observed upon the overexpression of the PUM2 RNA binding domain alone (Figure 4B). We then blocked PUM2 substrate recognition by mutating 3 conserved residues within helix 7 of the PUM2 RNA binding domain (mPUM2 [Wang et al., 2002]). These mutations reduced the toxicity of TDP43(PUM2) (Figure 4B), reinforcing the relation between RNA binding activity and neurodegeneration. Whereas TDP43(PUM2) exhibited a diffuse nuclear distribution, TDP43(mPUM2) formed multiple, spherical nuclear puncta (Figure 4C). As discussed below, we observed similar nuclear puncta in neurons expressing TDP43(F147L, F149L), suggesting that TDP43 forms nuclear puncta when it fails to bind to RNA, analogous to the related RNA binding proteins FUS (Maharana et al., 2018) and MATR3 (Iradi et al., 2018; Malik et al., 2018).
Figure 4. RNA Binding and Protein Stability Are Essential for TDP43-Dependent Neurode-generation.

(A) Schematic of TDP43 hybrid constructs.
(B) TDP43(PUM2)-EGFP expression significantly increased the cumulative risk of death compared to EGFP (HR = 2.54, p < 2 × 10⁻¹⁶). Expression of the PUM2 RNA binding domain (RBD) marginally elevated the risk of death compared to EGFP (HR =1.19, p = 3.78 × 10⁻⁵). RNA binding-deficient versions of the PUM2 RBD (mPUM2) significantly reduced the risk of death compared to TDP43(PUM2)-EGFP (HR = 0.45, p < 2 × 10⁻¹⁶).
(C) Images of neurons overexpressing mApple (red fluorescent protein [RFP]) and EGFP-tagged TDP43(WT), TDP43(PUM2), or TDP43(mPUM2). Scale bar: 5 μm.
(D) Expression of TDP43(PP7) reduced the risk of death in comparison to TDP43(WT) (HR = 0.73, p < 2 × 10⁻¹⁶) but remained significantly toxic compared to EGFP (HR = 2.05, p < 2 × 10⁻¹⁶).
(E) Boxplot of TDP43-Dendra2 variant half-life, determined by OPL.
(F) Median TDP43-Dendra2 half-life decreased from 51.9 to 19.8 h with the addition of the destabilizing CL degron.
(G) Both TDP43(WT)-Dendra2 and TDP43(WT)-Dendra2-CL significantly elevated the risk of death compared to Dendra2 (HR = 1.82 and 1.18, p < 2 × 10⁻¹⁶ and p = 1.23 × 10⁻¹⁰, respectively). TDP43(WT)-Dendra2-CL was significantly less toxic compared to TDP43(WT)-Dendra2 (HR = 0.64, p < 2 × 10⁻¹⁶).
Data pooled from 3 independent replicates for (B) and (D) and 4 replicates for (E), (F), and (G). For (B) and (D)–(G), n, number of neurons; ***p < 2 × 10⁻¹⁶; Cox proportional hazards. In (E), ***p < 0.05, 1-way ANOVA with Dunnett’s test. In (F), ****p < 0.0001, unpaired t test. Plots in (E) and (F) show median (horizontal line), interquartile range (box), and maximum/minimum (vertical lines).
Since the PUM2 target sequence (UGGANAUA) (Van Etten et al., 2012) shares some similarity with the UG-rich sequences bound by TDP43 (Polymenidou et al., 2011; Tollervey et al., 2011), we suspected that the recapitulation of TDP43-dependent toxicity by TDP43(PUM2) could be due to overlapping RNA substrates. We therefore replaced the TDP43 RRM1-RRM2 domains with the RNA binding domain of the bacteriophage PP7 coat protein (Lim and Peabody, 2002). Unlike PUM2, the PP7 coat protein binds unique RNA stem-loop structures not commonly found in eukaryotic cells (Chao et al., 2008; Wu et al., 2012). While TDP43(PP7) overexpression was less toxic than TDP43(WT), it was still more toxic than EGFP alone (Figure 4D). These data suggest that the sequence specificity required for TDP43-mediated toxicity is not as important as the ability to bind RNA.
We next focused on the relation between TDP43 stability and neurodegeneration by fusing TDP43(PUM2) and TDP43(PP7) to Dendra2, enabling the measurement of their half-life in primary neurons by OPL (Figure 4E). The half-life of Dendra2-tagged TDP43(PUM2) in neurons was indistinguishable from that of TDP43(WT), while TDP43(PP7) was significantly less stable (p < 0.0001). These results mirror survival data in Figures 4B and 4D, suggesting a direct correlation between protein stability and toxicity upon TDP43 overexpression.
We then accelerated TDP43 clearance by fusing a destabilizing sequence (CL1) (Bence et al., 2001; Gilon et al., 1998) to TDP43(WT)-Dendra2. By OPL, we noted a marked reduction in the half-life of TDP43(WT)-Dendra2-CL1 compared to TDP43(WT)-Dendra2 (Figure 4F), as expected. Furthermore, in longitudinal analyses of neuronal survival, the artificially destabilized TDP43(WT)-Dendra2-CL1 fusion was significantly less toxic than was TDP43(WT)-Dendra2 (p < 2 × 10⁻¹⁶; Figure 4G), confirming the link between TDP43 stability and toxicity. These data imply that mutations that eliminate RNA binding or disrupt the RRM1-RRM2 salt bridge mitigate toxicity not only by interfering with RNA recognition but also by destabilizing TDP43.
Manipulation of the RRM1-RRM2 Salt Bridge Modifies TDP43 Stability and Toxicity
Among the residues that interact non-covalently with Arg, Glu forms the most stable interaction, followed by Asp and Arg itself (White et al., 2013; Magalhaes et al., 1994). We therefore generated the D247E mutation, which we predicted would form a stronger interaction with R151. We also swapped the residues participating in the salt bridge (R151D-D247R) (Figure 5A). EGFP-tagged versions of each TDP43 variant were overex-pressed in HEK293T cells and bound transcripts assessed by RNA IP. In contrast to TDP43(WT), TDP43 variants carrying R151D or D247R (Figures S1I and S1J), D247E, or R151DD247R (Figures 5B and 5C) were incapable of pulling down TARDBP and MALAT1 transcripts. Thus, RNA recognition by TDP43 depends on the unique properties of the R151-D247 interaction. We also created Dendra2-tagged versions of these TDP43 variants, expressed them in primary cortical neurons, and measured the half-life of TDP43 by OPL (Figures 5D and 5E). Compared to TDP43(WT), each variant demonstrated accelerated turnover, suggesting that targeted manipulation of the RRM1-RRM2 salt bridge, including changes meant to strengthen the salt bridge, ultimately impair RNA binding and destabilize the protein.
Figure 5. Arg151 Mutations Interrupt the Proportional Relation between TDP43 Stability and Toxicity.

(A) Illustration of TDP43 variants tested in (B)–(F).
(B and C) RNA IP of TARDBP (B) and MALAT1 (C) transcripts in HEK293T cells expressing EGFP-tagged TDP43 variants.
(D) Significant decreases in protein half-life were observed for all TDP43 variants compared to TDP43(WT), as determined by OPL.
(E) Cumulative frequency plot of data shown in (D).
(F) By automated neuronal survival analysis, TDP43(WT)-EGFP was significantly toxic compared to EGFP (HR = 4.42, p < 2 × 10⁻¹⁶). All TDP43 variants were less toxic than TDP43(WT)-EGFP (R151D, HR = 0.23; D247R, HR = 0.48; R151D-D247R, HR = 0.21; D247E, HR = 0.6; p < 2 × 10⁻¹⁶ for all comparisons). Cells expressing either TDP43(D247R)-EGFP or TDP43(D247E)-EGFP demonstrated a significantly elevated risk of death compared to those expressing EGFP (HR = 2.2 and 2.76, respectively; p < 2 × 10⁻¹⁶ for both comparisons).
(G and H) While no relation was observed between half-life and toxicity for R151 variants (G), D247A variants displayed a linear relation between half-life and toxicity (H).
For (B) and (C), data were pooled from 3 independent experiments, ****p < 0.05, Kruskal-Wallis with Dunn’s test. For (D), data were pooled from 4 replicates, ****p < 0.05, 1-way ANOVA with Dunnett’s test. For (F), data represent 3 replicates, ***p < 2 × 10⁻¹⁶, Cox proportional hazards. n, number of neurons. For (G) and(H), error bars represent 95% confidence intervals. In (H), r2 calculated by nonlinear least-squares regression.
In light of these data, we predicted that such modifications to the RRM1-RRM2 salt bridge would mitigate TDP43-dependent toxicity in neurons. By automated microscopy and survival analysis (Figure 5F), both TDP43(D247E) and TDP43(R151DD247R) were less toxic than TDP43(WT), consistent with our expectations. However, unlike TDP43(R151D-D247R)-expressing neurons, cells transfected with TDP43(D247E) exhibited a greater risk of death than EGFP alone. Neurons expressing TDP43(R151D) showed no difference in survival compared to those transfected with EGFP alone, while TDP43(D247R) over-expression was toxic in comparison to EGFP (p < 2 × 10⁻¹⁶; Figure 5F). These data show that any mutation of R151 completely prevents TDP43-mediated toxicity upon overexpression.
If R151 is indeed required for TDP43-related toxicity, then R151 mutations should outweigh other factors governing TDP43 toxicity, including protein half-life. To test this, we compared the half-life of each TDP43 variant (as measured by OPL) with the risk of death in primary neurons overexpressing each variant (Figures 5G and 5H). Among the R151 variants, TDP43(R151A) displayed the shortest half-life, followed by TDP43(R151D) and TDP43(R151D-D247R). Despite their distinct half-lives, all of the R151 variants exhibited identical and minimal toxicity when overexpressed (Figure 5G). Conversely, the D247 variant toxicity is directly proportional to half-life, with the least stable variant (D247A) demonstrating minimal toxicity and the most stable variant (D247E) exhibiting the greatest toxicity (Figure 5H). These results not only confirm the critical nature of the R151 residue for TDP43-related toxicity but also indicate that half-life is an important predictor of neurodegeneration when this residue is intact.
Mutations Affecting RNA Binding Alter Subcellular TDP43 Localization and Dynamics
Given the physical proximity of the RRM1-RRM2 salt bridge to the putative TDP43 nuclear export signal (NES) (Winton et al., 2008; Ayala et al., 2008), we asked whether salt bridge integrity affects subcellular TDP43 localization. We noted mild to moderate cytoplasmic TDP43 mislocalization in association with all of the mutations, with the exception of the D247E and F147LF149L double mutant (Figure S2A). To gauge TDP43 localization quantitatively, we measured TDP43-EGFP abundance within the nuclear and cytoplasmic compartments of transfected neurons and calculated a nuclear-cytoplasmic ratio (NCR) reflecting the distribution of TDP43 in each cell (Archbold et al., 2018) (Figures S2B and S2C). All of the mutations except D247E and F147LF149L reduced the measured NCR; in fact, the NCR was slightly but significantly higher in cells expressing TDP43(D247E) and TDP43(F147L, F149L) (p < 0.0001). Since many variants were unable to recognize endogenous TDP43 targets by RNA IP (Figures 1 and 4) and displayed reduced toxicity in comparison to TDP43(WT) (Figures 2 and 4), these findings suggest that (1) nuclear TDP43 localization is independent of RNA binding per se and that (2) toxicity arising from cytoplasmic TDP43 mislocalization requires RNA binding and/or protein stability.
We also noted the formation of infrequent nuclear and cytoplasmic puncta in cells expressing TDP43(R151D), TDP43 (R151D-D247R), and TDP43(D247A), as well as multiple nuclear puncta in neurons transfected with TDP43(F147L, F149L). Mirroring this phenomenon, several TDP43 variants were enriched within the detergent-insoluble fraction of transfected HEK293T cells (Figures S3A–S3C), suggesting a phase transition that is similar to that observed for RNA binding-deficient MATR3 variants in neurons (Malik et al., 2018) and myoblasts (Iradi et al., 2018). To explore this phenomenon further, we imaged neurons expressing TDP43(F147L, F149L) at hourly intervals (Figure S3D), noting the liquid-like coalescence of smaller puncta into larger granules (Shin and Brangwynne, 2017; Lin et al., 2015). We also used fluorescence recovery after photobleaching (FRAP) to measure the dynamics of nuclear TDP43(F147L, F149L) (Malik et al., 2018). Diffuse nuclear TDP43(F147L, F149L) displayed rapid recovery after bleaching that was identical to that of TDP43(WT) (Figures S3E and S3F). Small puncta exhibited a similarly rapid return of fluorescence (Figures S3G and S3H), but large granules demonstrated almost no recovery after photo-bleaching, suggesting a gel-like state. Thus, RNA binding- deficient TDP43(F147L, F149L) forms nuclear puncta resembling liquid droplets, but within a span of hours, these granules coalesce into gel-like structures with limited internal rearrangement. These data demonstrate that RNA binding regulates TDP43 localization, distribution, and dynamics in neurons, in addition to its effects on protein stability and neurotoxicity.
Salt Bridge-Disrupting Mutations Interfere with TDP43 Autoregulation and Function
TDP43 regulates its own expression through a negative feedback loop in which it binds to the 3′UTR of its own RNA, triggering degradation (Ayala et al., 2011; Polymenidou et al., 2011; Weskamp and Barmada, 2018). To determine whether salt bridge-disrupting mutations affect TDP43 autoregulation, we used a fluorescent reporter consisting of the mCherry open reading frame upstream of TARDBP exon 6 and 3′ UTR (Figure S4A) (Barmada et al., 2015). As expected, TDP43(WT)-EGFP overexpression effectively reduced reporter abundance in HEK293T cells (Figures S4B and S4C). Conversely, TDP43-EGFP variants carrying the R151A, D247A, or F147L-F149L mutations were unable to decrease reporter levels. We observed an analogous pattern in rodent primary neurons (Figure S4D), consistent with prior results suggesting that RNA binding is required for TDP43 autoregulation (Ayala et al., 2011).
TDP43 regulates the splicing of hundreds of transcripts, including cystic fibrosis transmembrane conductance regulator (CFTR) mRNA (Buratti et al., 2001; Polymenidou et al., 2011). To assess TDP43 splicing activity, we applied a minigene commonly used to measure TDP43-dependent splicing of CFTR exon 9 (Figures S5A–S5D) (Buratti et al., 2001; Ayala et al., 2006). In contrast to TDP43(WT), none of the RNA binding-deficient TDP43 variants tested here were capable of suppressing CFTR minigene splicing. Instead, each variant appeared to inhibit minigene splicing, indicating a possible dominant-negative effect on endogenous TDP43 function. To pursue this question further, we fused TDP43(WT) to HaloTag (England et al., 2015) and co-expressed this with EGFP-tagged TDP43 variants in HEK293T cells (Figure S5E). Unlike EGFP or HaloTag alone, TDP43(WT)-HaloTag effectively co-precipitated TDP43(WT)-EGFP, which is consistent with the results of prior studies (Afroz et al., 2017; Budini et al., 2015). None of the mutations tested (R151A, D247A, and F147L-F149L) affected the ability of TDP43 to self-associate (Figure S5F). These results suggest that RNA binding-deficient TDP43 variants may impair native TDP43 function by sequestration. Even so, these variants are substantially less toxic than TDP43(WT) in primary neurons (Figure 2), implying that toxicity is largely driven by gain-of-function mechanisms in this model system.
All of the previous experiments were performed in cells expressing endogenous TDP43, making it difficult to ascertain the functional significance of salt bridge disruption. To circumvent this limitation, we investigated analogous mutations in Caenorhabditis elegans by CRISPR/Cas9 genome engineering (Prior et al., 2017). The RRM1 and RRM2 domains of TDP43 are highly conserved across species (Ayala et al., 2005) (Figure S6A), such that the R219A mutation in C. elegans TDP-1 is homologous to R151A in human TDP43. As the R151A mutation elicited the greatest phenotypic differences in our studies and the D247 residue is not as conserved, we chose to target R151A for further study in C. elegans by using CRISPR/Cas9 to create homozygous tdp-1(R219A) knockin animals.
Because the TDP43(R151A) mutation interferes with RNA binding (Figure 1) and destabilizes the protein (Figure 3), we suspected that the tdp-1 (R219A) mutation would functionally mirror the phenotypes observed in TDP-1 knockout animals (Ash et al., 2010; Zhang et al., 2012). Supporting this, we observed a significant decrease in body length for both tdp-1(R219A) worms and tdp-1(ok803) knockout animals (Figures S6B and S6C). Locomotor metrics (track length, wavelength, and amplitude) were similarly reduced in tdp-1(R219A) and tdp-1(ok803) worms compared to WT animals (Figures S6D–S6F), while body bending in liquid media was reciprocally increased in tdp-1(R219A) and tdp-1(ok803) nematodes (Figure S6G). We also confirmed a modest but significant increase in the lifespan of tdp-1(ok803) animals (Zhang et al., 2012; Vaccaro et al., 2012) that was replicated by tdp-1(R219A) worms (Figure S6H). These data indicate that the R219 residue, homologous to R151A in human TDP43, is required for native TDP-1 function in C. elegans.
Overexpression of WT TDP43, but Not Salt Bridge Mutants, Affects Ribosomal and Mitochondrial Transcripts
Given the consistent toxicity associated with WT TDP43, but not variants carrying salt bridge-disrupting mutations, we reasoned that the transcriptomic comparison of cells expressing each of the variants would highlight the RNAs that are most closely associated with toxicity. We therefore overexpressed EGFP-tagged versions of TDP43(WT), TDP43(R151A), and TDP43(D247A) in HEK293T cells, purified total mRNA, and performed high-throughput RNA sequencing to assess differences in transcript abundance and splicing associated with each variant. HEK293T cells transfected with EGFP alone and TDP43(F147L, F149L) served as negative controls for these experiments (Figure 6A).
Figure 6. TDP43(WT) Overexpression Selectively Affects Ribosomal and Oxidative Phosphorylation Pathways.

(A) TDP43 schematic depicting variants used for RNA sequencing (RNA-seq).
(B) Venn diagram illustrating differentially expressed genes (DEGs) for each condition, in comparison to EGFP alone.
(C) TARDBP transcript levels were similar among all TDP43 variants, demonstrating equivalent overexpression in each case.
(D) Venn diagram showing significant enrichment for functional pathways according to GO analysis.
(E–G) Among downregulated mRNAs, transcripts involved in the ribosomal (E) and oxidative phosphorylation (F) pathways were highly enriched (FDR = 6.8 × 10⁻⁵ and 0.03, respectively), with a trend toward enrichment for transcripts related to RNA transport (G, FDR = 0.222).
From an average of >26 million reads, we mapped 17,620 unique transcripts in each of the conditions, identifying 1,026 differentially expressed genes (DEGs) in cells overexpressing TDP43(WT) that were not detected upon the overexpression of the other TDP43 variants (Figure 6B), despite equivalent expression levels (Figure 6C). We then classified transcripts according to Gene Ontology (GO; Figure 6D) (Szklarczyk et al., 2017), highlighting a profound enrichment for ribosomal and oxidative phosphorylation pathways among RNAs affected by TDP43(WT) (false discovery rate [FDR] = 6.8 × 10⁻⁵ and 0.03, respectively; Figures 6E and 6F). We also noted a non-significant trend (FDR = 0.222) toward enrichment for the RNA transport pathway (Figure 6G). The effects of TDP43 variants on gene expression followed the same pattern observed in neuronal survival assays (Figure 2); in each case, the differences were greatest for TDP43(WT), intermediate for TDP43(D247A), and minimal for TDP43(R151A) and TDP43(F147L, F149L), suggesting a proportional relation between toxicity and differential gene expression in the ribosomal and oxidative phosphorylation pathways.
One of the primary functions of TDP43 is the suppression of unannotated (cryptic) exons (Ling et al., 2015; Humphrey et al., 2017; Tan et al., 2016; Polymenidou et al., 2011). We therefore investigated the differences in splicing by calculating a percent splicing index (PSI) for all of the events (Goldstein et al., 2016), in the process identifying 9,339 unique events that were significantly (FDR <0.05) changed >1.5-fold by TDP43(WT)-EGFP overexpression (Figure 7A). Only 3,968 of these splicing events(42.5%) were unique to TDP43(WT) (Figures 7B–7D), which alone among the tested variants demonstrated appreciable binding to native substrates (Figure 1) and toxicity upon overexpression (Figure 2). Thus, more than half of the splicing events attributable to TDP43 overexpression occur independently of direct RNA binding by TDP43 and have minor consequences for cellular survival.
Figure 7. TDP43(WT) Overexpression Promotes Intron Retention and Exon Skipping.

(A–D) A total of 9,339 differential splicing events involving 4,819 genes were noted upon TDP43(WT)-EGFP expression (A). Of these, 34.2% were also detected in cells expressing TDP43(F147L, F149L)-EGFP (B), 29.3% with TDP43(R151A)-EGFP (C), and 38.7% with TDP43(D247A)-EGFP (D).
(E) A total of 3,968 transcripts (42.5%) were selectively spliced by TDP43(WT)-EGFP.
(F) Heatmap of the 50 top repressed and 50 top included splicing events. See also Table S1.
(G) Categorization of TDP43(WT)-specific splicing events. RI, intron retention; A3SS, alternative 3′ splice sites; A5SS, alternative 5′ splice sites; ALE, alternative last exon; AFE, alternative first exon; AS, alternative start; SE, skipping of 1 exon; S2E, skipping of 2 exons; MXE, mutually exclusive exons.
(H and I) Representative examples of abnormal splicing in NDUFS6 (H) and ITPR3 (I) transcripts, with schematic diagrams of exons (E) and splice junctions (J) above heatmaps displaying the read density for each junction. Unannotated exons/junctions are shown in red.
By GO analysis, the ribosome pathway was significantly overrepresented among TDP43(WT)-specific splicing events (Figure 7E; FDR = 1.4 × 10⁻¹³), which is consistent with TDP43(WT)-associated DEGs (Figure 6). These events were also highly enriched for the spliceosome, proteasome, and RNA transport pathways (Table S1). To visualize the genes affected the most by TDP43(WT)-induced splicing abnormalities, we plotted the 100 splicing events with the largest magnitude change, including the 50 top repressed and included events (Figure 7F). In keeping with the results of the GO analysis, several genes within this list function within nucleocytoplasmic transport (KPNA2, TNPO1, and NXF1) and ribosomal (RPS16 and RPS20) pathways. Abnormal splicing was most apparent for TDP43(WT), intermediate for TDP43(D247A), and minimal for TDP43(R151A) and TDP43(F147L, F149L). Thus, as with DEGs (Figure 6), the splicing changes observed for TDP43(WT) were most profound, followed by TDP43(D247A) and lastly TDP43(R151A) and TDP43(F147L, F149L).
In agreement with the purported function of TDP43 as a splicing repressor (Polymenidou et al., 2011; Tollervey et al., 2011; Ling et al., 2015), the largest single category of splicing changes elicited by TDP43(WT) overexpression featured abnormal intron retention (36%) (Figure 7G). The second most common change involved exon skipping (34%), followed by alternative cassette splicing or the use of alternative start sites. We also noted several unannotated splicing events or junctions among those influenced selectively by TDP43(WT) (Figures 7H and 7I), in keeping with the ability of TDP43 to suppress cryptic exon inclusion (Ling et al., 2015; Humphrey et al., 2017; Tan et al., 2016).
Lastly, we asked whether TDP43-mediated misprocessing of ribosomal and oxidative phosphorylation RNAs has functional implications for neurons. Using surface sensing of translation (SUnSET) (Schmidt et al., 2009; Tank et al., 2018), we assessed global protein synthesis rates via the incorporation of puromycin into nascently translated proteins (Figure S7A). Compared to neurons expressing EGFP, only TDP43(WT)-EGFP-expressing neurons exhibited significant reductions in puromycin conjugates (p < 0.001 for all comparisons), which is indicative of TDP43(WT)-selective deficits in protein synthesis (Figure S7B). Mitochondrial size and shape are closely tied to function (Magrané et al., 2014; Koopman et al., 2007), and our recent studies demonstrated morphological abnormalities in mitochondria from ALS patient-derived cells (Tank et al., 2018). To visualize mitochondrial morphology, we treated neurons with tetramethylrhodamine (TMRE), a cell-permeable dye that labels active mitochondria (Mitra and Lippincott-Schwartz, 2010), and calculated a coefficient of variation (CV) for the TMRE signal in each cell, representative of mitochondrial punctateness within individual neurons (Figures S7C and S7D) (Sharkey et al., 2018; Tank et al., 2018). Among the variants tested, only TDP43(WT) and TDP43(D247A) significantly affected mitochondrial CV (p <0.01 for both comparisons). These findings suggest that the TDP43(WT)-related transcriptomic abnormalities affect both protein translation and mitochondrial morphology, which is consistent with previous studies of ALS patient-derived cells (Tank et al., 2018).
DISCUSSION
Here, we took advantage of the intricate relation between protein structure and function to probe the RNA binding properties of TDP43 and how these characteristics dictate its stability and propensity for toxicity in neuronal models of ALS and FTD. Engineered mutations disrupting the intramolecular salt bridge between the RRMs of TDP43 reduce the affinity and sequence specificity of nucleic acid binding by TDP43. As a result, TDP43 is (1) incapable of recognizing its native substrates, (2) rapidly degraded by the UPS, and (3) no longer toxic upon over-expression in neurons. We also leveraged the intrinsic contrast between TDP43(WT) and TDP43 variants lacking an intact RRM1-RRM2 salt bridge to identify the transcriptomic changes most significantly associated with TDP43-dependent toxicity, thereby implicating dysfunction within the ribosomal and oxidative phosphorylation pathways in ALS and FTD characterized by TDP43 deposition.
The protective effect of the R151A and D247A mutations was comparable to that of mutations that eliminate RNA binding altogether (F147L-F149L) or deletion of RRM1 itself. Notably, the R151A mutation phenocopied the F147L-F149L double mutant closely, while the D247A mutation elicited an intermediate phenotype. Since the majority of high-affinity RNA binding is accomplished by RRM1 (Buratti and Baralle, 2001; Ayala et al., 2005; Furukawa et al., 2016), TDP43(D247A) may still recognize many conventional TDP43 targets. Supporting this notion, the number of DEGs and alternatively spliced transcripts in cells overexpressing TDP43(D247A) were more similar to TDP43(WT) than other TDP43 variants, and TDP43(D247A) expression dis rupted mitochondrial morphology in rodent primary neurons, albeit less potently than TDP43(WT).
In light of the dual effects of salt bridge-disrupting mutations on TDP43 RNA binding and stability, we pursued several approaches to determine which of these outcomes was most closely tied to TDP43-dependent toxicity. First, we substituted the RNA binding domains of PUM2 or PP7 for those of TDP43, noting that chimeric proteins incorporating the PUM2 RNA binding domain completely recapitulated TDP43-mediated toxicity, while those containing the PP7 RNA binding domain partially restored toxicity. Second, TDP43 chimeras harboring RNA binding-deficient versions of the PUM2 RNA binding domain were less toxic in neurons. Third, the stability of each TDP43 chimera was directly proportional to its toxicity upon overexpression. Fourth, enhancing TDP43 turnover via fusion with the CL1 degron mitigated neurotoxicity. These data indicate that both RNA binding and protein stability are central factors underlying TDP43-dependent toxicity.
Supporting this notion, we observed a distinct relation between the D247 variant stability and TDP43-related toxicity in primary neurons, but a similar correlation was not observed for R151 variants. One possibility is that RNA recognition via RRM1, which requires the R151 residue (Lukavsky et al., 2013), is crucial for downstream toxicity mediated by TDP43. With RRM1 intact, alterations to protein stability can further modulate the severity of toxicity in TDP43-overexpressing cells. Since the half-life of TDP43 within neurons is substantially longer than in other cell types (Barmada et al., 2014; Watanabe et al., 2013; Ling et al., 2010), the proportional relation between TDP43 stability and toxicity may contribute to the enhanced susceptibility of neurons to TDP43-mediated cell death.
RNA binding-deficient TDP43 variants were consistently mislocalized, suggesting that the nucleocytoplasmic transport of TDP43 is closely linked to its ability to bind RNA (Ederle et al., 2018). Despite the previously noted toxicity of cytoplasmic TDP43 (Ihara et al., 2013; Barmada et al., 2010), however, all mislocalized TDP43 variants were less toxic than TDP43(WT), likely due to their inability to bind RNA or protein destabilization. We also noted that TDP43(F147LF149L) formed nuclear liquid-like droplets that resemble those formed by RNA binding-deficient versions of MATR3, a protein implicated in ALS, FTD, and distal myopathy (Iradi et al., 2018; Malik et al., 2018; Johnson et al., 2014). Nuclear TDP43(F147L-F149L) droplets matured quickly into viscous gels, confirming an essential role for RNA binding in maintaining the solubility of TDP43, MATR3, and other ALS-related proteins (Iradi et al., 2018; Malik et al., 2018; Maharana et al., 2018). We suspect that similar granules were not detected for TDP43 variants harboring R151 or D247 mutations because of residual RNA binding (Figure 1).
TDP43(WT) overexpression recapitulates core aspects of sporadic ALS and FTD (Elden et al., 2010; Barmada et al., 2010, 2014; Wils et al., 2010; Johnson et al., 2008; Liachko et al., 2010; Wang et al., 2011), and disease-associated TARDBP mutations elicit gain-of-function toxicity in animal models (White et al., 2018; Fratta et al., 2018), mirrored by TDP43 overexpression. While useful for investigating TDP43-dependent mechanisms of neurodegeneration, overexpression complicates the study of loss-of-function mutations such as those affecting the TDP43 RRM1-RRM2 salt bridge. We therefore created C. elegans strains expressing endogenous tdp-1(R219A), a variant homologous to human TDP43(R151A). These animals were almost identical to tdp-1 knockout animals in morphology, behavior, and lifespan, suggesting that the R219A mutation completely inactivates TDP1. Unlike other TDP43 orthologs in Drosophila and mice (Diaper et al., 2013; Feiguin et al., 2009; Sephton et al., 2010; Kraemer et al., 2010), C. elegans TDP1 is not required for survival, but it is similar to mammalian TDP43 in many other aspects, including its ability to recognize UG-rich sequences with high affinity (Ayala et al., 2005). Mutating R219 in C. elegans TDP1 or R151 in human TDP43 eliminates TDP43 function via effects on RNA binding, protein stability, or both. Supporting this conclusion, TDP43(R151A) is incapable of participating in conventional TDP43 functions, including TDP43 autoregulation and CFTR minigene splicing.
TDP43 is a splicing repressor (Polymenidou et al., 2011; Tollervey et al., 2011) whose depletion promotes the inclusion of cryptic exons within target transcripts (Humphrey et al., 2017; Tan et al., 2016; Ling et al., 2015). Conversely, TDP43 overexpression elicits exon skipping in most cases (Bose et al., 2008; Hazelett et al., 2012; Fratta et al., 2018). In accordance with these findings, intron retention and exon skipping were the most frequent splicing changes associated with TDP43(WT) overexpression. Furthermore, ribosomal protein encoding transcripts were highly and selectively enriched among misspliced RNA in cells overexpressing TDP43(WT). Like many RNA binding proteins, including TDP43, ribosomal proteins bind their own transcripts and regulate their abundance by modulating mRNA splicing (Burgos et al., 2017; Nomura et al., 1980). TDP43 may therefore regulate ribosomal protein-encoding transcripts by repressing their splicing, much like ribosomal proteins themselves. We also detected enrichment for RNA transport and proteolysis pathways among differentially spliced transcripts in cells overexpressing TDP43(WT), but not TDP43 variants unable to bind RNA. These results reflect global deficits in RNA transport and proteolysis observed in ALS and FTD models (Freibaum et al., 2015; Zhang et al., 2015; Jovičić et al., 2015; Boeynaems et al., 2016; Gupta et al., 2017; Guo et al., 2018), testifying to the conserved nature of these abnormalities and indicating a potential niche for TDP43 in maintaining nucleocytoplasmic trafficking and protein homeostasis.
TDP43 recognizes thousands of RNAs bearing UG-rich sequences (Polymenidou et al., 2011; Tollervey et al., 2011). Using a series of RNA binding-deficient TDP43 variants, we selectively highlighted transcripts affected by functional TDP43. Among these RNAs, transcripts encoding components of the ribosomal and oxidative phosphorylation pathways were consistently downregulated in a pattern that is strikingly similar to that observed in human induced pluripotent stem cells (iPSCs) from individuals with pathogenic C9orf72 mutations, one of the most common mutations responsible for ALS and FTD (Renton et al., 2011; DeJesus-Hernandez et al., 2011), and in iPSCs overexpressing TDP43 (Tank et al., 2018). These observations imply that dysregulation of ribosomal and oxidative phosphorylation pathways are convergent downstream events in ALS and FTD pathogenesis, inextricably linked to TDP43 deposition and RNA binding. Accordingly, therapies that act on these pathways are likely to be particularly effective in extending neuronal survival and preventing neurodegeneration in ALS and FTD.
STAR★METHODS
CONTACT FOR REAGENT AND RESOURCE SHARING
Further information and requests for resources and reagents should be directed to and will be fulfilled by the Lead Contact, Sami Barmada (sbarmada@umich.edu).
EXPERIMENTAL MODEL AND SUBJECT DETAILS
HEK293T cell culture
Human embryonic kidney (HEK) 293T cells were cultured in DMEM (GIBCO), 10% FBS, 100 units/mL Penicillin/Streptomycin at 37°C in 5% CO2. HEK293T cells are originally female in origin, are easily transfected, and have been transformed with SV40 T-antigen.
Primary neuron culture
All vertebrate animal work was approved by the Committee on the Use and Care of Animals (UCUCA) at the University of Michigan. All experiments were performed in accordance with UCUCA guidelines and designed to minimize animal use. Rats (Rattus norvegicus) were housed single in chambers equipped with environmental enrichment, and cared for by veterinarians from the Unit for Laboratory Animal Medicine at the University of Michigan. All individuals were trained and approved in the care of along-term maintenance of rodents, in accordance with the NIH-supported Guide for the Care and Use of Laboratory Animals. All personnel handling the rats and administering euthanasia were properly trained in accordance with the University of Michigan Policy for Education and Training of Animal Care and Use Personnel. Euthanasia followed the recommendations of the Guidelines on Euthanasia of the American Veterinary Medical Association. Primary mixed cortical neurons were dissected from embryonic day 19–20 Long-Evans rat pups and cultured at 0.6 × 10⁶ cells/mL in 96 well cell culture plates (TPP), as previously described (Barmada et al., 2014, 2015). Brains from individual pups in each litter were pooled to maximize cell counts prior to plating; as a result, primary cortical neurons used for all studies include an even mix of cells from both male and female pups. Following dissection and plating, neurons were cultured in NEUMO photostable medium containing SOS supplement (Cell Guidance Systems) at 37°C in 5% CO2.
C.elegans
Wild-type (N2), ok803 and TDP-1(R151A) worms were grown at 20°C on nematode growth medium (NGM) plates seeded with OP50 Escherichia coli. Behavioral analyses were performed on adult hermaphrodites, as these constitute > 95% of the worm population.
METHOD DETAILS
Plasmids
The plasmids pGW1-TDP43(WT)-EGFP, pGW1-TDP43(WT)-Dendra2, pGW1-TDP43(M337V)-EGFP, pGW1-EGFP, and pGW1-mApple were created as described previously (Barmada et al., 2010, 2014). Primers used for site-directed mutagenesis or PCR amplification (Table S2) were ordered from Integrated DNA Technologies (IDT). TDP43 variants were generated from TDP43(WT)-EGFP, TDP43(M337V)-EGFP, or TDP43(WT)-Dendra2 by site-directed mutagenesis using the Pfu Ultra high-fidelity polymerase (Agilent Technologies) according to the manufacturer’s protocol (Table S2).
To create TDP43(PUM2)-EGFP, the PUM2 RNA binding domain (courtesy of Dr. Aaron Goldstrohm) was excised from pFN21APUM2-R6SYE (a PUM2 variant in which the RNA recognition amino acids of the 6th repeat are mutated to SYE (Van Etten et al., 2012) using XmaI and AgeI, and ligated into pGW1-EGFP cut with the same enzymes, generating pGW1-PUM2-EGFP. We then amplified amino acids 1–106 of TDP43(WT) from pGW1-TDP43(WT)-EGFP using PrimeStar GXL DNA polymerase (Takara) following the manufacturer’s protocol (Table S2). The 318 bp product was digested with BstBI and XmaI restriction enzymes and ligated into pGW1-PUM2-EGFP that had been cut with the same enzymes. Next, amino acids 263–414 of TDP43(WT) from pGW1-TDP43(WT)-EGFP were amplified by PCR (Table S2). The resulting 453 bp fragment was digested with AgeI and ligated into pGW1-TDP43(AA1–106)-PUM2-EGFP that had also been cut with AgeI, generating pGW1-TDP43(PUM2)-EGFP. To create an RNA binding-deficient version of this construct (pGW1-TDP43(mPUM2)-EGFP), 3 critical residues within helix 7 of the PUM2 RNA binding domain (Wang et al., 2002) were mutated by site-directed mutagenesis (Table S2).
To make pGW1-TDP43(PP7)-EGFP, the TDP43(PUM2)-EGFP plasmid described above was cut with XmaI and AgeI to remove both PUM2 (1044 bp fragment) and the C-terminal end (AA263–414) of TDP43. A 850 bp fragment encoding the RNA binding domain of PP7 (plasmid pHR-PP7-3xmCherry (Yan et al., 2017), courtesy of Dr. Nils Walter) was amplified by PCR (Table S2) and ligated into TDP43(AA1–106)-EGFP-pGW1 cut with XmaI and AgeI. The vector was then digested with AgeI to re-insert the C-terminal end of TDP43 to generate the final product, pGW1-TDP43(PP7)-EGFP.
For pGW1-TDP43(ΔRRM1–2)-EGFP, the pGW1-TDP43(AA1–106)-PUM2-EGFP plasmid described above was digested with XmaI and AgeI to remove the PUM2 fragment. The C-terminal end of TDP43 (AA263–414) was then amplified by PCR using the primers described above and inserted into the cut vector. To generate TDP43(ΔRRM1)-EGFP or TDP43(ΔRRM2)-EGFP, we first amplified the RRM2 and RRM1 domains from pGW1-TDP43-EGFP by PCR (Table S3). The TDP43(ΔRRM1–2)-EGFP construct was then cut with XmaI followed by insertion of the PCR products encoding the RRM2 or RRM1 domains, respectively, cut with the same enzyme.
To generate pGW1-TDP43(WT)-Dendra2-CL1, TDP43(WT) was PCR amplified from pGW1-TDP43(WT)-EGFP (Table S3) and ligated into pGW1-empty vector using NheI and AgeI restriction sites. The Dendra2-CL1 sequence with flanking AgeI and SalI restriction sites was ordered as a G-block from IDT (see Table S3 for sequence), digested with AgeI and SalI and inserted into pGW1-TDP43(WT) cut with the same enzymes to make TDP43(WT)-Dendra2-CL1.
For pGW1-TDP43(PUM2)-Dendra2 and pGW1-TDP43(PP7)-Dendra2, TDP43(PUM2) and TDP43(PP7), respectively, were excised from pGW1-TDP43(PUM2)-EGFP or pGW1-TDP43(PP7)-EGFP using HindIII and AgeI restriction enzymes. The fragments were inserted into pGW1-Dendra2 cut with the same enzymes to generate either pGW1-TDP43(PUM2)-Dendra2 or pGW1-TDP43(PP7)-Dendra2.
To generate pGW1-TDP43(WT)-TEV-Halo, HaloTag was PCR amplified from pFN21A-PUM2-R6SYE (a gift from A. Goldstrohm at the University of Minnesota) and ligated into the pGW1 empty vector using XbaI and SbfI restriction enzymes. TDP43(WT) was amplified from pGW1-TDP43(WT)-EGFP and digested with NheI and AgeI and inserted into the pGW1-Halo cut vector. Then annealed oligonucleotides corresponding to the TEV protease sequence was inserted into pGW1-TDP43(WT)-HaloTag using AgeI and XbaI restriction enzymes to create pGW1-TDP43(WT)-TEV-Halo (Table S2).
Purification of recombinant TDP43
TDP43(WT), TDP43(R151A) or TDP43(D247A) was expressed in BL21 DE3 E. coli cells from the plasmid pE-6xHis-SUMOTDP43(WT) (a gift from Dr. James Shorter). Induction was carried out with 1 mM isopropyl-β-D-1-thiogalactopyranoside and cells were grown at 15°C for 16h. Cell pellets were resuspended in lysis buffer (50 mM HEPES, 2% Triton X-100, 300 mM NaCl, 5% glycerol, 50 mM imidazole, 2 mM BME, EDTA-free protease inhibitor cocktail, 5 μM pepstatin, and 20 mg/mL lysozyme) and incubated on ice for 30 minutes. Following sonication on ice, cell lysates were centrifuged for 20 min at 11,000 × g at 4°C. Recombinant protein was purified by binding to Ni-NTA resin (QIAGEN), rinsed with 25 mL of wash buffer 4 times (50 mM HEPES, 2% Triton X-100, 300 mM NaCl, 5% glycerol, 50 mM imidazole, and 2 mM BME), and released with 2 mL of elution buffer (50 mM HEPES, 500 mM NaCl, 300 mM imidazole, 5% glycerol, and 5 mM DTT) at room temperature (RT), collecting five 2 mL fractions. Protein was dialyzed twice for 1h in 1 L of final buffer (50 mM HEPES and 500 mM NaCl), and dialyzed once in 1 L of final buffer overnight at 4°C.
Electromobility shift assays (EMSAs)
Binding assays were performed with purified full-length recombinant TDP43 protein and either ssRNA labeled probes tagged with a 5′ 800nm infrared (IR) moiety or ssDNA or ssRNA labeled probes tagged with a 5′ 700nm IR moiety (IDT; Table S3). Binding reactions were performed in binding buffer (12.5 mM HEPES, pH 7.8, 50 mM KCl, 2.5 mM MgCl2, 0.5 mM TCEP, 25 μg/mL BSA, 0.01% NP-40) with 50% glycerol, 1 μg/μl poly-dIdC, 100 pM of labeled probe, and recombinant protein (concentrations indicated in figure legends). Reactions were incubated on ice for 5 min followed by 25 min at RT. Electrophoresis of 6% acrylamide gels were performed at 100 V. Images were acquired using the LI-COR Odyssey platform.
RNA immunoprecipitation
HEK293T cells were transfected with WT and pGW1-TDP43-EGFP variants using Lipofectamine 2000 (ThermoFisher) following the manufacturer’s protocol. Forty-eight hours post-transfection, cell pellets were resuspended in lysis buffer (50 mM HEPES, pH 7.5, 50 mM KCl, 0.5% sodium deoxycholate, 0.1% SDS, 0.5% NP-40, 0.5 mM DTT, and EDTA-free protease inhibitor cocktail) and incubated on ice for 30 min. Following sonication on ice, cell lysates were centrifuged at 13,000 × g for 10 min at 4°C. 400 μg protein was added to Dynabeads Protein G magnetic beads (Invitrogen) and 1 μg/μl of anti-GFP (Rabbit, Immunology Consultants Laboratory) and incubated overnight at 4°C. Protein/antibody/bead complexes were washed with 50 mM HEPES pH 7.5, 300 mM KCl, 0.5% NP-40, 0.5 mM DTT, and EDTA-free protease inhibitor cocktail.
RT-PCR and Quantitative RT-PCR
Total RNA was extracted using RNeasy Mini Kit (QIAGEN) following the manufacturer’s protocol. To synthesize cDNA, 1 μg of total RNA was used in a 20 μL reaction volume with the Bio-Rad iScript cDNA synthesis kit according the manufacturer’s protocol. The reactions were incubated at 25°C for 5 min, 42°C for 30 min, and 85°C for 5 min. PCR was carried out in a 25 μL reaction volume with 0.5 μL of cDNA, 200 nM primers (Table S3), and GoTaq Master Mix (Promega). For quantitative RT-PCR (qRT-PCR), reactions were carried out using Step One Plus Realtime PCR system (Applied Biosystems). Reactions were carried out using SYBR Green Master Mix (Applied Biosystems), with 200 nM primers, and 0.5 μL cDNA, according to the following parameters: 4 min at 95°C, then 30 cycles at 95°C for 30 s, 58°C for 30 s and 72°C for 30 s. Relative gene expression was calculated using the ΔΔCt method. Values obtained from TDP43 variants were scaled to those from TDP43(WT) and plotted in GraphPad Prism.
Differential solubility
HEK293T cells were transfected with WT and pGW1-TDP43-EGFP variants using Lipofectamine 2000 (Thermofisher) according to the manufacturer’s protocol. Cells were washed and collected in cold PBS 48h after transfection. Cells were centrifuged at 7,000 × g for 5 min at 4°C and resuspended in RIPA buffer with protease inhibitors. Following lysis on ice for 15 min, cells were centrifuged at 21,000 × g for 15 min at 4°C. The supernatant was removed and saved as the RIPA-soluble fraction. The RIPA-insoluble pellet was then washed in 1 mL RIPA, and contents were resuspended in urea buffer (7 M urea, 2 M thiourea, 4% CHAPS, 30 mM Tris, pH 8.5). Samples were centrifuged at 21,000 × g for 15 min at 4°C, and the supernatant was saved as the urea-soluble fraction.
For SDS-PAGE, stock sample buffer (10% SDS, 20% glycerol, 0.0025% bromophenol blue, 100 mM EDTA, 1 M DTT, 20 mM Tris, pH 8) was diluted in all samples. For RIPA-soluble fractions, 10 ug of sample were boiled for 10 min. For urea-soluble fractions, equal volumes of sample for each condition were mixed 1:1 with water, and these samples were not boiled. Samples were then loaded onto 4%–15% gradient gels (Bio-Rad). After transfer to 0.2 μm PVDF membrane (Bio-Rad), blots were incubated in 3% BSA in0.2% Tween-20 with the following antibodies: mouse anti-GAPDH (Millipore, MAB374; dilution 1:1000) and rabbit anti-TDP43 (Cell Signaling; dilution 1:1000). Blots were then washed in 0.2% TBST and incubated at RT for 1h with AlexaFluor goat anti-mouse 594 (ThermoFisher) and goat anti-rabbit 488 (ThermoFisher), both diluted 1:10,000 in 3% milk in 0.2% TBST. Blots were washed in0.2% TBST before imaging with the LI-COR Odyssey platform.
Primary neuron transfections
At in vitro day (DIV) 3–4, primary neurons were transfected with 0.2 μg DNA and 0.5 μL Lipofectamine 2000 (ThermoFisher) per well, per the manufacturer’s protocol, with the exception that cells were incubated with Lipofectamine/DNA complexes for only 20 min at 37°C before rinsing. For live-cell nuclear staining, cells were rinsed with media containing Hoechst 33258 Dye (Invitrogen) at 1:5000. Following transfection, cells were maintained in NEUMO photostable medium containing SOS supplement (Cell Guidance Systems). For experiments that involved MG132 (Millipore), drug was added to a final concentration of either 25 nM or 500 nM 18h post-transfection; cells were imaged 6h following drug addition. For TMRE treatment, neurons were incubated 48h post-transfection with a final concentration of 200 nM TMRE (Abcam) for 15 min at 37°C. For puromycin treatment, neurons were incubated with0.5 μg/mL of puromycin (Sigma-Aldrich) for 20 min at 37°C 48–72h post-transfection. The neurons were then fixed and imaged as described below.
Longitudinal fluorescence microscopy
Automated longitudinal fluorescence microscopy began 24h post-transfection for 10d, as previously described (Arrasate et al., 2004; Barmada et al., 2010, 2015; Tsvetkov et al., 2013; Archbold et al., 2018; Malik et al., 2018). Briefly, images were acquired by an inverted Nikon Ti microscope equipped with a 20× objective lens, a PerfectFocus system, a Lambda XL Xenon lamp (Sutter) with 5 mm liquid light guide (Sutter), and either an Andor iXon3 897 EMCCD camera or Andor Zyla4.2 (+) sCMOS camera. All stage, shutter, and filter wheel movements were carried out by custom code written in publicly available software (μManager, ImageJ) (Weskamp et al., 2019). For OPL, neurons were pulsed with 500msec per frame of 405nm light prior to image acquisition.
Imaging fixed neurons
Primary cortical neurons were isolated and plated onto glass coverslips. Neurons were transfected with EGFP or TDP43-EGFP variants as described previously. Forty-eight hours post-transfection, neurons were washed twice with PBS and fixed with 4% paraformaldehyde for 10 min at RT. Coverslips were mounted onto slides using ProLong Gold Antifade Mountant with DAPI to stain nuclei (Thermo Fisher). Fluorescent images were taken using a Zeiss AxioImager M2 microscope with Apotome. Images were acquired using a 63× objective with oil and apotome structured illumination. Image analysis was performed using FIJI.
For SUnSET, after fixation neurons were permeabilized with 0.1% Triton X-100 in PBS for 20 min at room temperature (RT), equilibrated with 10 mM glycine in PBS for 10 min at RT, then blocked in 0.1% Triton X-100, 3% BSA and 0.2% goat serum in PBS for 1h at RT. Primary antibody (mouse anti-puromycin, Sigma) was added directly to block at a dilution of 1:10000, and the samples incubated overnight at 4C. Neurons were rinsed twice quickly and 3 times for 10 min each with PBS, then placed back in block solution containing secondary antibodies (goat anti-mouse Cy5, Jackson ImmunoResearch) diluted 1:250. Neurons were then rinsed twice quickly in PBS, and 3 times for 10 min each in PBS before mounting onto slides with ProLong Gold Antifade Mountant with DAPI (ThermoFisher) and imaging as above.
C. elegans CRISPR/Cas9 mutant generation
For all experiments, the Bristol N2 strain was used as the wild-type control and was the parental strain for all transgenic lines created in this study. N2 animals were modified by CRISPR/Cas9 gene editing using direct injection of CRISPR/Cas9 ribonucleoproteins as previously described (Prior et al., 2017). In brief, single-stranded oligonucleotide homology directed repair templates (ssODN-HDR) containing 40–50 bp 5′ and 3′ homology arms flanking the 20-mer sgRNA target site were designed containing the edit of interest, a unique in-frame restriction site (SacI), and conservative nucleotide changes to prevent sgRNA:Cas9cleavage. The ssODN-HDR templates were ordered as Ultramers from Integrated DNA Technologies (IDT), and recombinant S. pyogenes Cas9 nuclease was purchased from IDT as well. A synthetic single guide RNA (5′- UUU GUC AGA AUG UCA UCA GU-3′) was purchased from Synthego, Inc. The R219A ssODN-HDR repair template contained the following sequence: 5′- TCT TCT TCA GAT AAA ACG AAA GTC GGA TGG AAA CTC AAA AGG ATT TGG ATT CGT TGC GAT GAG CTC TGT AGG TGA ACA AAA TAA AGT ATT AGC TAT CCC ACA GCA CAT GAT TGA TGG TCG –3′. Correctly edited animals were backcrossed six times to N2 and the entire tdp-1 genomic DNA open reading frame was analyzed by PCR and Sanger sequencing.
Behavioral and longevity assays in C. elegans
For all behavioral assays, synchronized L4 larval animals were obtained using sodium hypochlorite. For all assays, the scorer was blind to the genotype. For locomotion assays, 10–15 seven-day adult worms were picked and transferred to 35mm NGM plates seeded with OP50.Worms were filmed for one-minute using custom built video-acquisition hardware, and locomotor metrics were analyzed using WormLab software (MBF Biosciences). For locomotion assays on NGM plates, at least 127 animals/genotype were quantified in 3 replicate trials. For thrash assays, 10–15 animals were placed in 1 mL of M9 media at room temperature. After a one-minute acclimation period, a one-minute video was recorded and analyzed using the thrash assay function in WormLab software (MBF Biosciences). At least 96 animals/genotype were quantified in 3 replicate trials. Longevity assays were conducted at 20°C to minimize temperature fluctuations and ensure constant conditions. For each strain at least 20 L4 larvae were transferred to NGM plates containing OP50 E. coli lawns. A total of at least 5 plates were used per strain for a total of at least 100 worms per strain. Longevity assays were replicated in 3 independent trials. Animals were transferred every 2–3d as needed to a fresh plate. The viability of the worms was assessed daily, and animals that failed to respond to stimulation by touch were considered dead. In respect to the timeline, day 0 reflected the day L4 larvae were transferred to NGM plates containing OP50 E. coli lawns.
Fluorescence recovery after photobleaching
Photobleaching experiments were conducted as described previously (Malik et al., 2018). Briefly, primary neurons were dissected as before and plated in LAB-TEK 8-well borosilicate chambers (ThermoFisher). On DIV 4, wells were transfected with 100 μg of pGW1-mApple and 100 μg of TDP43-EGFP constructs each. One to two days after transfection, neurons were imaged with a Nikon A1 confocal microscope controlled by Nikon Elements software and equipped with a 60× objective lens, heating chamber at 37°C, and CO2 line. For granule and diffuse photobleaching, ROIs corresponding to half the nucleus or half the granule, respectively, were drawn in Elements and a 488 nm laser at 1 pulse/s × 7 s used to bleach TDP43-EGFP variants in the selected area, followed by subsequent imaging to track recovery over time.
TDP43-Halo pull down assay
HEK293 cells were co-transfected with EGFP or TDP43-EGFP variants and either TDP43-TEV-Halo or Halo control using Lipofectamine 2000. Approximately 48h post-transfection, cell pellets were lysed in 100 μL of lysis buffer (50 mM Tris-HCl, 150 mM NaCl, 1% Triton X-100, 0.1% NaDeoxycholate) and incubated on ice for 25 min. Following sonication, 100 μg of lysate was added to 100 μL of HaloLink Resin. The HaloLink Resin was washed with equilibration buffer (100 mM Tris (pH 7.5), 150 mM NaCl, 1 mg/mL BSA, 0.005% IGEPAL) 3 times for 2 min at 800 × g prior to loading the lysate. The lysate and HaloLink Resin mixture were incubated at RT for 30 min. The mixture was centrifuged for 2 min at 800 × g, and the supernatant was discarded. The pellet was washed twice with 500 μL of wash buffer (100 mM Tris (pH 7.5), 150 mM NaCl, 1 mg/mL BSA, 0.005% IGEPAL), followed by two additional washes incubated at RT for 5 min. After the last wash, samples were treated with TEV protease (Sigma-Aldrich) for 1h at 30°C. Samples were resuspended in 20 μL elution buffer (1% SDS, 50 mM Tris-HCl (pH 7.5)), and boiled for 10 min at 95°C for SDS-PAGE. 10 μg of lysate were also boiled and loaded as input onto a 10% gel. Following transfer to 0.2 μm PVDF membrane (Bio-Rad), blots were incubated in 3% BSA in 0.2% Tween-20 with the following antibodies: mouse anti-GAPDH (Millipore, MAB374; dilution 1:1000), mouse anti-GFP (Life Technologies; dilution 1:1000) and rabbit anti-TDP43 (Cell Signaling; dilution 1:1000). Blots were then washed in 0.2% TBST and incubated at RT for 1h with AlexaFluor goat anti-mouse 594 (ThermoFisher) and goat anti-rabbit 488 (ThermoFisher), each diluted 1:10,000 in 3% milk in 0.2% TBST. Blots were washed in 0.2% TBST before imaging with the LI-COR Odyssey platform.
CFTR splicing assay
HEK293 cells were co-transfected with EGFP-tagged TDP43 variants and the CFTR minigene using Lipofectamine 2000. 48h post-transfection, total RNA was extracted using RNeasy Mini Kit (QIAGEN) following the manufacturer’s protocol. cDNA was synthesized using the Bio-Rad iScript cDNA synthesis kit according the manufacturer’s protocol, and RT-PCR was accomplished as described in Ayala et al., 2006.
TARDBP autoregulation reporter assay
HEK293 cells or rodent primary cortical neurons were co-transfected with a fluorescent reporter, mCherry, located upstream TARDBP exon 6 and 3′UTR (described in Barmada et al., 2015), as well EGFP-tagged TDP43 variants using Lipofectamine 2000. Forty-eight hours post-transfection, HEK293 cell lysates were subjected to Western Blotting with rabbit anti-mCherry (Abcam, 1:1000) and mouse anti-GAPDH (Millipore, 1:1000). In primary neurons, reporter abundance was measured by automated fluorescence microscopy (as described above), 6d post-transfection.
QUANTIFICATION AND STATISTICAL ANALYSIS
Statistical analyses were performed in either R or GraphPad Prism. Statistical differences among half-lives, nuclear/cytoplasmic ratios, and locomotor metrics were determined by one-way ANOVA with either Dunnett’s multiple comparisons test or Tukey’s post hoc test in GraphPad Prism. For qRT-PCR analyses, differences among groups were determined using the Kruskal-Wallis test. Statistical parameters are reported in the figure legends. Additional descriptions of quantification and statistical analyses for specific assays are described below:
EMSA analysis
Intensities for each of the IR-labeled probe/protein complexes were determined using Image Studio 2.0 and plotted in GraphPad Prism. The dissociation constant and Hill coefficient were determined in GraphPad Prism using the nonlinear least-squares regression fit equation: F = Ch/(Kd + Ch), where F is the fraction bound, C is the ligand concentration, Kd is the dissociation constant, and h is the Hill coefficient.
Optical pulse labeling analysis
Half-life was determined for individual cells by using a custom-written R script that fits log-transformed TRITC intensities for each cell, normalized to the intensity measured immediately following photoconversion, to a linear equation (Barmada et al., 2014). Protein half-life (t1/2) was calculated from photoconverted (red) TDP43-Dendra2 intensity using the following formulas: It = I0 − Imin) × e(−K×t) + Imin and t1=2 = ln(2)/K, where I0 is the initial intensity after photoconversion, Imin is the minimum intensity of the protein after decay, It is the intensity at time t, and K is the decay constant.
Fluorescence microscopy image analysis
Image processing, survival analyses, and fluorescent intensity measurements were accomplished using scripts written in Python or the ImageJ macro language. Neurons were identified by morphology, size, and fluorescence intensity. Cell death was determined for each neuron by rounding of the soma, degenerating processes, and loss of fluorescence, as described in Malik et al., 2018, and Weskamp et al., 2019.
Survival analysis
For survival analyses, the publically available R survival package was used to determine differences among populations through Cox proportional hazards analysis (Malik et al., 2018; Weskamp et al., 2019).
RNA-sequencing, gene expression and splicing analysis
HEK293T cells were transfected with pGW1-EGFP, pGW1-TDP43(WT)-EGFP, pGW1-TDP43(R151A)-EGFP, pGW1-TDP43(D247A)-EGFP, or pGW1-TDP43(F147L, F149L)-EGFP using Lipofectamine 2000 (ThermoFisher), following the manufacturer’s protocol. Total RNA was extracted using RNeasy Mini Kit (QIAGEN) following the manufacturer’s protocol, and submitted to the University of Michigan Sequencing Core. Prior to library generation, RNA was assessed for quality using the TapeStation (Agilent, Santa Clara, CA), and samples with RINs (RNA Integrity Numbers) of 8 or greater were prepped using the Illumina TruSeq Stranded mRNA Library Prep kit (Catalog #s RS-122–2101, RS-122–2102) (Illumina, San Diego, CA). Total RNA was converted to mRNA using a polyA purification. The mRNA is then fragmented and copied into first strand cDNA using reverse transcriptase and random primers. cDNA 3′ ends were adenylated and adapters ligated with 6 nucleotide barcodes unique for each sample, allowing us to sequence more than one sample in each lane of a HiSeq flow cell (Illumina). All products are purified and enriched by PCR to create the final cDNA libraries, which were checked for quality and quantity by TapeStation (Agilent) and qPCR using Kapa’s library quantification kit for Illumina Sequencing platforms (catalog # KK4835) (Kapa Biosystems,Wilmington MA). The samples were pooled, clustered on the cBot (Illumina) and sequenced on the HiSeq 4000, paired-end 50 nt reads, according to manufacturer’s recommended protocols.
FastQC (https://www.bioinformatics.babraham.ac.uk/projects/fastqc/) (version v0.11.3) was used for quality control. The Tuxedo Suite software package was used for alignment, differential expression analysis, and post-analysis diagnostics (Langmead et al., 2009; Trapnell et al., 2009, 2013). Briefly, reads were aligned to the reference mRNA transcriptome (hg19) (Kent et al., 2002) using TopHat (version 2.0.13) and Bowtie2 (version 2.2.1). Default parameter settings for alignment were used, with the exception of “b2-very-sensitive.” To ensure high quality data was used for expression quantification and differential expression analysis, FastQC was used post-alignment. For expression quantitation, normalization, and differential expression analysis, Cufflinks/CuffDiff (version2.2.1) was used, and hg19.fa was set as the reference genome sequence. The following parameter settings was used: “multi-read-correct” to adjust expression calculations for reads that map in more than one locus, and “compatible-hits-norm” and “upper-quartile-norm” form normalization of expression value. Diagnostic plots were generated using the CummeRbund R package. Custom scripts were used to format and annotate the differential expression data from CuffDiff. Genes and transcripts that are differentially expressed were identified based on the following criteria: test status = “OK,” FDR ≤ 0.05, and fold change ≥ ± 1.5. To model the biological relevance of differentially expressed genes, Advaita Bio’s iPathwayGuide (http://advaitabio.com/ ipathwayguide) was used, and EGFP was set as the control.
For analysis of splicing changes, trimmed reads were aligned to hg38 genome reference using HISAT2 (Kim et al., 2015) with Gen-code gene annotation (version 27). Discordant or mixed mapping between mates in a pair was disabled using the “-no-mixed- no-discordant” parameters. Properly mapped alignments with quality > 20 were selected and analyzed using the bioconductor packages SGSeq (Goldstein et al., 2016) and Limma (Ritchie et al., 2015). Specifically, analyzeFeatures() was run to predict transcript features from the alignments; annotate() was run to annotate features with known transcripts from library “TxDb.Hsapiens.UCSC.hg38.knownGene”; analyzeVariants() was run to identify splice events, obtain counts for each splice variant and compute estimates of relative splice usage; plotFeatures() and plotVariants() were used to plot splice graphs and heatmaps of expression levels for selected genes; and diffSplice() from Limma was run to test differential splice variant usage for the four comparisons: TDP43(WT)-EGFP versus EGFP, TDP43(F147L, F149L)-EGFP versus EGFP, TDP43(R151A)-EGFP versus EGFP, and TDP43(D247A)-EGFP versus EGFP.
FRAP analysis
FIJI was used for all image analyses. The pre-bleach GFP integrated density was calculated for the whole granule or whole nucleus for granule or diffuse bleach, respectively, as was the fraction of this total integrated density that the photobleach ROI composed. The drop in this fraction after bleaching was made the floor, and return was plotted as the percent recovery inside the bleached ROI as a fraction of the original whole integrated density. For diffuse bleach experiments, recovery was fitted in RStudio to the equation yt = A(1 – eτt), where A is the plateau of the return curve, τ is the return constant, and t is the time post-bleach in seconds. The τ was used diffusion to calculate the time to half-return (t1/2) through the relationship t1/2 = ln(0.5)/− τ, and this was in turn used to derive the constant (D) with the equation D = (0.88w2)/(4t1/2)), in which w is the radius of the bleached ROI. As we did not conduct spot bleach with circular ROIs, ROI radius was divided by π as before (Malik et al., 2018) to approximate w2 and account for photobleached area.
DATA AND SOFTWARE AVAILABILITY
The acession number for the RNA-seq data reported in this manuscript is NCBI GEO: GSE128647.
Supplementary Material
KEY RESOURCES TABLE
| REAGENT or RESOURCE | SOURCE | IDENTIFIER |
|---|---|---|
| Antibodies | ||
| Rabbit polyclonal anti-GFP | Immunology Consultants Laboratory | Cat#RGFP-45ALY |
| Mouse monoclonal anti-GAPDH | Millipore | Cat#MAB374; RRID: AB_2107445 |
| Rabbit polyclonal anti-TDP43 | Cell Signaling Technologies | Cat#3449; RRID: AB_2200511 |
| Mouse monoclonal anti-puromycin | Sigma-Aldrich | Cat#MABE343; RRID: AB_2566826 |
| Mouse monoclonal anti-GFP | Thermo Fisher | Cat#MA515256; RRID:AB_10979281 |
| Rabbit monoclonal anti-mCherry | Abcam | Cat#ab213511 |
| Chemicals, Peptides, and Recombinant Proteins | ||
| Recombinant TDP43(WT) | Dr. James Shorter | N/A |
| Recombinant TDP43(R151A) protein | This paper | N/A |
| Recombinant TDP43(D247A) protein | This paper | N/A |
| Critical Commercial Assays | ||
| Library generation for RNA-seq | Illumina TruSeq Stranded mRNA | RS-122-2101, RS-122-2102 |
| Deposited Data | ||
| RNA-sequencing data | This paper | NCBI GEO (accession # GSE128647) |
| Experimental Models: Cell Lines | ||
| HEK293T | ATCC | CRL-3216 |
| Long Evans rat embryonic day 19–20 mixed cortical primary neuron culture | Charles River Co. | Strain Code: 006 |
| Experimental Models: Organisms/Strains | ||
| C. elegans: Bristol N2 | CGC, University of Minnesota (https://cgc.umn.edu/strain/N2) | N2; RRID: WB-STRAIN:N2_(ancestral) |
| C. elegans: tdp-1 (R219A) | This paper | N/A |
| C. elegans: tdp-1 (ok803) | Vaccaro et al., 2012 | RRID: WB-STRAIN:RB929 |
| Oligonucleotides | ||
| Primers for cloning and site-directed mutagenesis, see Table S2 | This paper | N/A |
| Labeled RNA/DNA sequences for EMSA | This paper | N/A |
| qPCR primers for RNA-IP | This paper | N/A |
| Recombinant DNA | ||
| Plasmid: pGW1-TDP43(WT)-EGFP | Barmada et al., 2010, 2014 | N/A |
| Plasmid: pGW1-TDP43(WT)-Dendra2 | Barmada et al., 2010, 2014 | N/A |
| Plasmid: pGW1-TDP43(M337V)-EGFP | Barmada et al., 2010, 2014 | N/A |
| Plasmid: pGW1-EGFP | Barmada et al., 2010, 2014 | N/A |
| Plasmid: pGW1-mApple | Barmada et al., 2010, 2014 | N/A |
| Plasmid: pFN21A-PUM2-R6SYE | Dr. Aaron Goldstrohm; Van Etten et al., 2012 | N/A |
| Plasmid: pGW1-TDP43(PUM2)-EGFP | This paper | N/A |
| Plasmid: pGW1-TDP43(mPUM2)-EGFP | This paper | N/A |
| Plasmid: pHR-PP7-3xmCherry | Dr. Nils Walter; Yan et al., 2017 | N/A |
| Plasmid: pGW1-TDP43(PP7)-EGFP | This paper | N/A |
| Plasmid: pGW1-TDP43(ΔRRM1-2)-EGFP | This paper | N/A |
| Plasmid: pGW1-TDP43(ΔRRM1)-EGFP | This paper | N/A |
| Plasmid: pGW1-TDP43(ΔRRM2)-EGFP | This paper | N/A |
| Plasmid: pGW1-TDP43(R151A)-EGFP | This paper | N/A |
| Plasmid: pGW1-TDP43(D247A)-EGFP | This paper | N/A |
| Plasmid: pGW1-TDP43(R151A, D247A)-EGFP | This paper | N/A |
| Plasmid: pGW1-TDP43(F147L, F149L)-EGFP | This paper | N/A |
| Plasmid: pGW1-TDP43(R151D)-EGFP | This paper | N/A |
| Plasmid: pGW1-TDP43(R151D, D247R)-EGFP | This paper | N/A |
| Plasmid: pGW1-TDP43(D247R)-EGFP | This paper | N/A |
| Plasmid: pGW1-TDP43(D247E)-EGFP | This paper | N/A |
| Plasmid: pGW1-TDP43(R151 A)-Dendra2 | This paper | N/A |
| Plasmid: pGW1-TDP43(D247A)-Dendra2 | This paper | N/A |
| Plasmid: pGW1-TDP43(F147L, F149L)-Dendra2 | This paper | N/A |
| Plasmid: pGW1-TDP43(R151 D)-Dendra2 | This paper | N/A |
| Plasmid: pGW1-TDP43(R151D, D247R)-Dendra2 | This paper | N/A |
| Plasmid: pGW1-TDP43(D247R)-Dendra2 | This paper | N/A |
| Plasmid: pGW1-TDP43(D247E)-Dendra2 | This paper | N/A |
| Plasmid: pGW1-TDP43(WT)-Dendra2-CL1 | This paper | N/A |
| Plasmid: pGW1-TDP43(PUM2)-Dendra2 | This paper | N/A |
| Plasmid: pGW1-TDP43(PP7)-Dendra2 | This paper | N/A |
| Plasmid: pGW1-TDP43(WT)-TEV-Halo | This paper | N/A |
| Plasmid: pE-6xHis-SUMO-TDP43(WT) | Dr. James Shorter | N/A |
| Plasmid: pE-6xHis-SUMO-TDP43(R151A) | This paper | N/A |
| Plasmid: pE-6xHis-SUMO-TDP43(D247A) | This paper | N/A |
| Software and Algorithms | ||
| FastQC v0.11.3 | https://www.bioinformatics.babraham.ac.uk/projects/fastqc/ | RRID: SCR_015483 |
| Tuxedo Suite | Langmead et al., 2009; Trapnell et al., 2009, 2013 | RRID: SCR_013194 |
| CummeRbund R package | http://compbio.mit.edu/cummeRbund/ | RRID: SCR_014568 |
| iPathwayGuide | http://advaitabio.com/ipathwayguide | N/A |
| HISAT2 | Kim et al., 2015 | RRID: SCR_015530 |
| SGSeq | Goldstein et al., 2016 | N/A |
| Limma | Ritchie et al., 2015 | RRID: SCR_010943 |
| Automated neuronal survival analysis | Malik et al., 2018 | N/A |
| Automated neuronal measurements | Malik et al., 2018 | N/A |
| Automated neuronal nuclear fractionation | Malik et al., 2018 | N/A |
| WormLab | MBF Biosciences | N/A |
Highlights.
The Arg151/Asp247 salt bridge dictates TDP43 RNA binding affinity and specificity
Disrupting the salt bridge results in TDP43 destabilization and mislocalization
Both reduced RNA binding and protein instability mitigateTDP43-mediated toxicity
Active TDP43 accumulation selectively affects ribosomal and mitochondrial RNAs
ACKNOWLEDGMENTS
This work was supported by the NIH, General Medical Sciences (GM) grant no. T-32-GM00731.5 (to B.N.F.), National Institute for Neurological Disorders and Stroke (NINDS) grant no. R01-NS097542 (to S.J.B.) and grant no. R01-NS094678 (to A.A.B.), National Institute on Aging (NIA) grant no. P30 AG053760 (to S.J.B.), the University of Michigan Protein Folding Disease Initiative (to S.J.B.), and the Fred A. and Barbara M. Erb Family Foundation grant no. G020562 (to S.J.B.). We thank R. Miguez, R. McEachin, and W. Wu for technical assistance; Drs. R. Fuller, H. Paulson, and P. Todd for their suggestions; Drs. Y. Ayala and A. Haeusler for advice and protocols; and Drs. A. Gold-strohm, J. Shorter, N. Walter, and J. Wang for reagents. This work used core services provided by the Bioinformatics Core at the University of Michigan.
Footnotes
SUPPLEMENTAL INFORMATION
Supplemental Information can be found online at https://doi.org/10.1016/j.celrep.2019.03.093.
DECLARATION OF INTERESTS
The authors declare no competing interests.
REFERENCES
- Afroz T, Hock EM, Ernst P, Foglieni C, Jambeau M, Gilhespy LAB, Laferriere F, Maniecka Z, Plückthun A, Mittl P, et al. (2017). Functional and dynamic polymerization of the ALS-linked protein TDP-43 antagonizes its pathologic aggregation. Nat. Commun 8, 45–59. [DOI] [PMC free article] [PubMed] [Google Scholar]
- Arai T, Hasegawa M, Akiyama H, Ikeda K, Nonaka T, Mori H, Mann D, Tsuchiya K, Yoshida M, Hashizume Y, and Oda T (2006). TDP-43 is a component of ubiquitin-positive tau-negative inclusions in frontotemporal lobar degeneration and amyotrophic lateral sclerosis. Biochem. Biophys. Res. Commun 351, 602–611. [DOI] [PubMed] [Google Scholar]
- Archbold HC, Jackson KL, Arora A, Weskamp K, Tank EM, Li X, Miguez R, Dayton RD, Tamir S, Klein RL, and Barmada SJ (2018). TDP43 nuclear export and neurodegeneration in models of amyotrophic lateral sclerosis and frontotemporal dementia. Sci. Rep 8, 4606. [DOI] [PMC free article] [PubMed] [Google Scholar]
- Arrasate M, Mitra S, Schweitzer ES, Segal MR, and Finkbeiner S (2004). Inclusion body formation reduces levels of mutant huntingtin and the risk of neuronal death. Nature 431, 805–810. [DOI] [PubMed] [Google Scholar]
- Ash PEA, Zhang YJ, Roberts CM, Saldi T, Hutter H, Buratti E, Petrucelli L, and Link CD (2010). Neurotoxic effects of TDP-43 overexpression inC. elegans. Hum. Mol. Genet 19, 3206–3218. [DOI] [PMC free article] [PubMed] [Google Scholar]
- Ayala YM, Pantano S, D’Ambrogio A, Buratti E, Brindisi A, Marchetti C, Romano M, and Baralle FE (2005). Human, Drosophila, and C.elegans TDP43: nucleic acid binding properties and splicing regulatory function.J. Mol. Biol 348, 575–588. [DOI] [PubMed] [Google Scholar]
- Ayala YM, Pagani F, and Baralle FE (2006). TDP43 depletion rescues aberrant CFTR exon 9 skipping. FEBS Lett 580, 1339–1344. [DOI] [PubMed] [Google Scholar]
- Ayala YM, Zago P, D’Ambrogio A, Xu YF, Petrucelli L, Buratti E, and Baralle FE (2008). Structural determinants of the cellular localization and shuttling of TDP-43. J. Cell Sci 121, 3778–3785. [DOI] [PubMed] [Google Scholar]
- Ayala YM, De Conti L, Avendaño-Vázquez SE, Dhir A, Romano M, D’Ambrogio A, Tollervey J, Ule J, Baralle M, Buratti E, and Baralle FE (2011). TDP-43 regulates its mRNA levels through a negative feedback loop. EMBO J 30, 277–288. [DOI] [PMC free article] [PubMed] [Google Scholar]
- Barmada SJ (2015). Linking RNA Dysfunction and Neurodegeneration in Amyotrophic Lateral Sclerosis. Neurotherapeutics 12, 340–351. [DOI] [PMC free article] [PubMed] [Google Scholar]
- Barmada SJ, and Finkbeiner S (2010). Pathogenic TARDBP mutations in amyotrophic lateral sclerosis and frontotemporal dementia: disease-associated pathways. Rev. Neurosci 21, 251–272. [DOI] [PubMed] [Google Scholar]
- Barmada SJ, Skibinski G, Korb E, Rao EJ, Wu JY, and Finkbeiner S (2010). Cytoplasmic mislocalization of TDP-43 is toxic to neurons and enhanced by a mutation associated with familial amyotrophic lateral sclerosis.J. Neurosci 30, 639–649. [DOI] [PMC free article] [PubMed] [Google Scholar]
- Barmada SJ, Serio A, Arjun A, Bilican B, Daub A, Ando DM, Tsvetkov A, Pleiss M, Li X, Peisach D, et al. (2014). Autophagy induction enhances TDP43 turnover and survival in neuronal ALS models. Nat. Chem. Biol 10, 677–685. [DOI] [PMC free article] [PubMed] [Google Scholar]
- Barmada SJ, Ju S, Arjun A, Batarse A, Archbold HC, Peisach D, Li X, Zhang Y, Tank EM, Qiu H, et al. (2015). Amelioration of toxicity in neuronal models of amyotrophic lateral sclerosis by hUPF1. Proc. Natl. Acad. Sci. USA 112, 7821–7826. [DOI] [PMC free article] [PubMed] [Google Scholar]
- Bence NF, Sampat RM, and Kopito RR (2001). Impairment of the ubiquitin-proteasome system by protein aggregation. Science 292, 1552–1555. [DOI] [PubMed] [Google Scholar]
- Bhardwaj A, Myers MP, Buratti E, and Baralle FE (2013). Characterizing TDP-43 interaction with its RNA targets. Nucleic Acids Res 41, 5062–5074. [DOI] [PMC free article] [PubMed] [Google Scholar]
- Boeynaems S, Bogaert E, Michiels E, Gijselinck I, Sieben A, Jovičić A, De Baets G, Scheveneels W, Steyaert J, Cuijt I, et al. (2016). Drosophila screen connects nuclear transport genes to DPR pathology in c9ALS/FTD. Sci. Rep 6, 20877. [DOI] [PMC free article] [PubMed] [Google Scholar]
- Bose JK, Wang IF, Hung L, Tarn WY, and Shen CK (2008). TDP-43 overexpression enhances exon 7 inclusion during the survival of motor neuron pre-mRNA splicing. J. Biol. Chem 283, 28852–28859. [DOI] [PMC free article] [PubMed] [Google Scholar]
- Budini M, Romano V, Quadri Z, Buratti E, and Baralle FE (2015). TDP-43 loss of cellular function through aggregation requires additional structural determinants beyond its C-terminal Q/N prion-like domain. Hum. Mol. Genet 24, 9–20. [DOI] [PMC free article] [PubMed] [Google Scholar]
- Buratti E, and Baralle FE (2001). Characterization and functional implications of the RNA binding properties of nuclear factor TDP-43, a novel splicing regulator of CFTR exon 9. J. Biol. Chem 276, 36337–36343. [DOI] [PubMed] [Google Scholar]
- Buratti E, Dörk T, Zuccato E, Pagani F, Romano M, and Baralle FE (2001). Nuclear factor TDP-43 and SR proteins promote in vitro and in vivo CFTR exon 9 skipping. EMBO J 20, 1774–1784. [DOI] [PMC free article] [PubMed] [Google Scholar]
- Burgos HL, O’Connor K, Sanchez-Vazquez P, and Gourse RL (2017). Roles of Transcriptional and Translational Control Mechanisms in Regulation of Ribosomal Protein Synthesis in Escherichia coli. J. Bacteriol 199, e00407–e00417. [DOI] [PMC free article] [PubMed] [Google Scholar]
- Chao JA, Patskovsky Y, Almo SC, and Singer RH (2008). Structural basis for the coevolution of a viral RNA-protein complex. Nat. Struct. Mol. Biol 15, 103–105. [DOI] [PMC free article] [PubMed] [Google Scholar]
- Chudakov DM, Lukyanov S, and Lukyanov KA (2007). Using photoactivatable fluorescent protein Dendra2 to track protein movement. Bio-Techniques 42, 553–555, 557. [DOI] [PubMed] [Google Scholar]
- DeJesus-Hernandez M, Mackenzie IR, Boeve BF, Boxer AL, Baker M, Rutherford NJ, Nicholson AM, Finch NA, Flynn H, Adamson J, et al. (2011). Expanded GGGGCC hexanucleotide repeat in noncoding region of C9ORF72 causes chromosome 9p-linked FTD and ALS. Neuron 72, 245–256. [DOI] [PMC free article] [PubMed] [Google Scholar]
- Diaper DC, Adachi Y, Sutcliffe B, Humphrey DM, Elliott CJ, Stepto A, Ludlow ZN, Vanden Broeck L, Callaerts P, Dermaut B, et al. (2013). Loss and gain of Drosophila TDP-43 impair synaptic efficacy and motor control leading to age-related neurodegeneration by loss-of-function phenotypes. Hum. Mol. Genet 22, 1539–1557. [DOI] [PMC free article] [PubMed] [Google Scholar]
- Ederle H, Funk C, Abou-Ajram C, Hutten S, Funk EBE, Kehlenbach RH, Bailer SM, and Dormann D (2018). Nuclear egress of TDP-43 and FUS occurs independently of Exportin-1/CRM1. Sci. Rep 8, 7084. [DOI] [PMC free article] [PubMed] [Google Scholar]
- Elden AC, Kim HJ, Hart MP, Chen-Plotkin AS, Johnson BS, Fang X, Armakola M, Geser F, Greene R, Lu MM, et al. (2010). Ataxin-2 intermediate-length polyglutamine expansions are associated with increased risk for ALS. Nature 466, 1069–1075. [DOI] [PMC free article] [PubMed] [Google Scholar]
- England CG, Luo H, and Cai W (2015). HaloTag technology: a versatile platform for biomedical applications. Bioconjug. Chem 26, 975–986. [DOI] [PMC free article] [PubMed] [Google Scholar]
- Feiguin F, Godena VK, Romano G, D’Ambrogio A, Klima R, and Baralle FE (2009). Depletion of TDP-43 affects Drosophila motoneurons terminal syn-apsis and locomotive behavior. FEBS Lett 583, 1586–1592. [DOI] [PubMed] [Google Scholar]
- Fratta P, Sivakumar P, Humphrey J, Lo K, Ricketts T, Oliveira H, Brito-Armas JM, Kalmar B, Ule A, Yu Y, et al. (2018). Mice with endogenous TDP-43 mutations exhibit gain of splicing function and characteristics of amyotrophic lateral sclerosis. EMBO J 37, e98684. [DOI] [PMC free article] [PubMed] [Google Scholar]
- Freibaum BD, Lu Y, Lopez-Gonzalez R, Kim NC, Almeida S, Lee KH, Badders N, Valentine M, Miller BL, Wong PC, et al. (2015). GGGGCC repeat expansion in C9orf72 compromises nucleocytoplasmic transport. Nature 525, 129–133. [DOI] [PMC free article] [PubMed] [Google Scholar]
- Furukawa Y, Suzuki Y, Fukuoka M, Nagasawa K, Nakagome K, Shimizu H, Mukaiyama A, and Akiyama S (2016). A molecular mechanism realizing sequence-specific recognition of nucleic acids by TDP-43. Sci. Rep 6, 20576. [DOI] [PMC free article] [PubMed] [Google Scholar]
- Gilon T, Chomsky O, and Kulka RG (1998). Degradation signals for ubiquitin system proteolysis in Saccharomyces cerevisiae. EMBO J 17, 2759–2766. [DOI] [PMC free article] [PubMed] [Google Scholar]
- Goldstein LD, Cao Y, Pau G, Lawrence M, Wu TD, Seshagiri S, and Gentleman R (2016). Prediction and Quantification of Splice Events from RNA-Seq Data. PLoS One 11, e0156132. [DOI] [PMC free article] [PubMed] [Google Scholar]
- Guo W, Chen Y, Zhou X, Kar A, Ray P, Chen X, Rao EJ, Yang M, Ye H, Zhu L, et al. (2011). An ALS-associated mutation affecting TDP-43 enhances protein aggregation, fibril formation and neurotoxicity. Nat. Struct. Mol. Biol 18, 822–830. [DOI] [PMC free article] [PubMed] [Google Scholar]
- Guo Q, Lehmer C, Martínez-Sánchez A, Rudack T, Beck F, Hartmann H, Pérez-Berlanga M, Frottin F, Hipp MS, Hartl FU, et al. (2018). In Situ Structure of Neuronal C9orf72 Poly-GA Aggregates Reveals Proteasome Recruitment. Cell 172, 696–705.e12. [DOI] [PMC free article] [PubMed] [Google Scholar]
- Gupta R, Lan M, Mojsilovic-Petrovic J, Choi WH, Safren N, Barmada S, Lee MJ, and Kalb R (2017). The Proline/Arginine Dipeptide from Hexa-nucleotide Repeat Expanded C9ORF72 Inhibits the Proteasome. eNeuro 4, ENEURO.0249–16.2017. [DOI] [PMC free article] [PubMed] [Google Scholar]
- Hazelett DJ, Chang JC, Lakeland DL, and Morton DB (2012). Comparison of parallel high-throughput RNA sequencing between knockout of TDP-43 and its overexpression reveals primarily nonreciprocal and nonoverlapping gene expression changes in the central nervous system of Drosophila. G3 (Bethesda) 2, 789–802. [DOI] [PMC free article] [PubMed] [Google Scholar]
- Humphrey J, Emmett W, Fratta P, Isaacs AM, and Plagnol V (2017). Quantitative analysis of cryptic splicing associated with TDP-43 depletion. BMC Med. Genomics 10, 38. [DOI] [PMC free article] [PubMed] [Google Scholar]
- Ihara R, Matsukawa K, Nagata Y, Kunugi H, Tsuji S, Chihara T, Kuranaga E, Miura M, Wakabayashi T, Hashimoto T, and Iwatsubo T (2013). RNA binding mediates neurotoxicity in the transgenic Drosophila model of TDP-43 proteinopathy. Hum. Mol. Genet 22, 4474–4484. [DOI] [PubMed] [Google Scholar]
- Iradi MCG, Triplett JC, Thomas JD, Davila R, Crown AM, Brown H, Lewis J, Swanson MS, Xu G, Rodriguez-Lebron E, and Borchelt DR (2018). Characterization of gene regulation and protein interaction networks for Matrin 3 encoding mutations linked to amyotrophic lateral sclerosis and myopathy. Sci. Rep 8, 4049. [DOI] [PMC free article] [PubMed] [Google Scholar]
- Johnson BS, McCaffery JM, Lindquist S, and Gitler AD (2008). A yeast TDP-43 proteinopathy model: exploring the molecular determinants of TDP-43 aggregation and cellular toxicity. Proc. Natl. Acad. Sci. USA 105, 6439–6444. [DOI] [PMC free article] [PubMed] [Google Scholar]
- Johnson JO, Pioro EP, Boehringer A, Chia R, Feit H, Renton AE, Pliner HA, Abramzon Y, Marangi G, Winborn BJ, et al. ; ITALSGEN (2014). Mutations in the Matrin 3 gene cause familial amyotrophic lateral sclerosis. Nat. Neurosci 17, 664–666. [DOI] [PMC free article] [PubMed] [Google Scholar]
- Jovičić A, Mertens J, Boeynaems S, Bogaert E, Chai N, Yamada SB, Paul JW 3rd, Sun S, Herdy JR, Bieri G, et al. (2015). Modifiers of C9orf72 dipeptide repeat toxicity connect nucleocytoplasmic transport defects to FTD/ALS. Nat. Neurosci 18, 1226–1229. [DOI] [PMC free article] [PubMed] [Google Scholar]
- Kent WJ, Sugnet CW, Furey TS, Roskin KM, Pringle TH, Zahler AM, and Haussler D (2002). The human genome browser at UCSC. Genome Res 12, 996–1006. [DOI] [PMC free article] [PubMed] [Google Scholar]
- Kim D, Langmead B, and Salzberg SL (2015). HISAT: a fast spliced aligner with low memory requirements. Nat. Methods 12, 357–360. [DOI] [PMC free article] [PubMed] [Google Scholar]
- Kisselev AF, and Goldberg AL (2001). Proteasome inhibitors: from research tools to drug candidates. Chem. Biol 8, 739–758. [DOI] [PubMed] [Google Scholar]
- Koopman WJH, Verkaart S, Visch HJ, van Emst-de Vries S, Nijtmans LG, Smeitink JA, and Willems PH (2007). Human NADH:ubiquinone oxidoreductase deficiency: radical changes in mitochondrial morphology? Am. J. Physiol. Cell Physiol 293, C22–C29. [DOI] [PubMed] [Google Scholar]
- Koyama A, Sugai A, Kato T, Ishihara T, Shiga A, Toyoshima Y, Koyama M, Konno T, Hirokawa S, Yokoseki A, et al. (2016). Increased cytoplasmic TARDBP mRNA in affected spinal motor neurons in ALS caused by abnormal autoregulation of TDP-43. Nucleic Acids Res 44, 5820–5836. [DOI] [PMC free article] [PubMed] [Google Scholar]
- Kraemer BC, Schuck T, Wheeler JM, Robinson LC, Trojanowski JQ, Lee VM, and Schellenberg GD (2010). Loss of murine TDP-43 disrupts motor function and plays an essential role in embryogenesis. Acta Neuropathol 119, 409–419. [DOI] [PMC free article] [PubMed] [Google Scholar]
- Kuo P-H, Doudeva LG, Wang YT, Shen CK, and Yuan HS (2009). Structural insights into TDP-43 in nucleic-acid binding and domain interactions. Nucleic Acids Res 37, 1799–1808. [DOI] [PMC free article] [PubMed] [Google Scholar]
- Kuo P-H, Chiang CH, Wang YT, Doudeva LG, and Yuan HS (2014). The crystal structure of TDP-43 RRM1-DNA complex reveals the specific recognition for UG- and TG-rich nucleic acids. Nucleic Acids Res 42, 4712–4722. [DOI] [PMC free article] [PubMed] [Google Scholar]
- Langmead B, Trapnell C, Pop M, and Salzberg SL (2009). Ultrafast and memory-efficient alignment of short DNA sequences to the human genome. Genome Biol 10, R25. [DOI] [PMC free article] [PubMed] [Google Scholar]
- Liachko NF, Guthrie CR, and Kraemer BC (2010). Phosphorylation promotes neurotoxicity in a Caenorhabditis elegans model of TDP-43 proteinopathy. J. Neurosci 30, 16208–16219. [DOI] [PMC free article] [PubMed] [Google Scholar]
- Lim F, and Peabody DS (2002). RNA recognition site of PP7 coat protein. Nucleic Acids Res 30, 4138–4144. [DOI] [PMC free article] [PubMed] [Google Scholar]
- Lin Y, Protter DS, Rosen MK, and Parker R (2015). Formation and Maturation of Phase-Separated Liquid Droplets by RNA-Binding Proteins. Mol. Cell 60, 208–219. [DOI] [PMC free article] [PubMed] [Google Scholar]
- Ling S-C, Albuquerque CP, Han JS, Lagier-Tourenne C, Tokunaga S, Zhou H, and Cleveland DW (2010). ALS-associated mutations in TDP-43 increase its stability and promote TDP-43 complexes with FUS/TLS. Proc. Natl. Acad. Sci. USA 107, 13318–13323. [DOI] [PMC free article] [PubMed] [Google Scholar]
- Ling S-C, Polymenidou M, and Cleveland DW (2013). Converging mechanisms in ALS and FTD: disrupted RNA and protein homeostasis. Neuron 79, 416–438. [DOI] [PMC free article] [PubMed] [Google Scholar]
- Ling JP, Pletnikova O, Troncoso JC, and Wong PC (2015). TDP-43 repression of nonconserved cryptic exons is compromised in ALS-FTD. Science 349, 650–655. [DOI] [PMC free article] [PubMed] [Google Scholar]
- Lukavsky PJ, Daujotyte D, Tollervey JR, Ule J, Stuani C, Buratti E, Baralle FE, Damberger FF, and Allain FH (2013). Molecular basis of UG-rich RNA recognition by the human splicing factor TDP-43. Nat. Struct. Mol. Biol 20, 1443–1449. [DOI] [PubMed] [Google Scholar]
- Mackness BC, Tran MT, McClain SP, Matthews CR, and Zitzewitz JA (2014). Folding of the RNA recognition motif (RRM) domains of the amyotrophic lateral sclerosis (ALS)-linked protein TDP-43 reveals an intermediate state. J. Biol. Chem 289, 8264–8276. [DOI] [PMC free article] [PubMed] [Google Scholar]
- Magalhaes A, Maigret B, Hoflack J, Gomes JN, and Scheraga HA (1994). Contribution of unusual arginine-arginine short-range interactions to stabilization and recognition in proteins. J. Protein Chem 13, 195–215. [DOI] [PubMed] [Google Scholar]
- Magrané J, Cortez C, Gan WB, and Manfredi G (2014). Abnormal mitochondrial transport and morphology are common pathological denominators in SOD1 and TDP43 ALS mouse models. Hum. Mol. Genet 23, 1413–1424. [DOI] [PMC free article] [PubMed] [Google Scholar]
- Maharana S, Wang J, Papadopoulos DK, Richter D, Pozniakovsky A, Poser I, Bickle M, Rizk S, Guillén-Boixet J, Franzmann TM, et al. (2018). RNA buffers the phase separation behavior of prion-like RNA binding proteins. Science 360, 918–921. [DOI] [PMC free article] [PubMed] [Google Scholar]
- Malik AM, Miguez RA, Li X, Ho YS, Feldman EL, and Barmada SJ (2018). Matrin 3-dependent neurotoxicity is modified by nucleic acid binding and nucleocytoplasmic localization. eLife 7, e35977. [DOI] [PMC free article] [PubMed] [Google Scholar]
- Mitra K, and Lippincott-Schwartz J (2010). Analysis of mitochondrial dynamics and functions using imaging approaches. Curr. Protoc. Cell Biol Chapter 4, 4.25.1–425.21. [DOI] [PMC free article] [PubMed] [Google Scholar]
- Neumann M, Sampathu DM, Kwong LK, Truax AC, Micsenyi MC, Chou TT, Bruce J, Schuck T, Grossman M, Clark CM, et al. (2006). Ubiquitinated TDP-43 in frontotemporal lobar degeneration and amyotrophic lateral sclerosis. Science 314, 130–133. [DOI] [PubMed] [Google Scholar]
- Nishimura AL, Shum C, Scotter EL, Abdelgany A, Sardone V, Wright J, Lee YB, Chen HJ, Bilican B, Carrasco M, et al. (2014). Allele-specific knockdown of ALS-associated mutant TDP-43 in neural stem cells derived drom induced pluripotent stem cells. PLoS One 9, e91269. [DOI] [PMC free article] [PubMed] [Google Scholar]
- Nomura M, Yates JL, Dean D, and Post LE (1980). Feedback regulation of ribosomal protein gene expression in Escherichia coli: structural homology of ribosomal RNA and ribosomal protein MRNA. Proc. Natl. Acad. Sci. USA 77, 7084–7088. [DOI] [PMC free article] [PubMed] [Google Scholar]
- Polymenidou M, Lagier-Tourenne C, Hutt KR, Huelga SC, Moran J, Liang TY, Ling SC, Sun E, Wancewicz E, Mazur C, et al. (2011). Long pre-mRNA depletion and RNA missplicing contribute to neuronal vulnerability from loss of TDP-43. Nat. Neurosci 14, 459–468. [DOI] [PMC free article] [PubMed] [Google Scholar]
- Prior H, Jawad AK, MacConnachie L, and Beg AA (2017). Highly Efficient, Rapid and Co-CRISPR-Independent Genome Editing in Caenorhabditis elegans. G3 (Bethesda) 7, 3693–3698. [DOI] [PMC free article] [PubMed] [Google Scholar]
- Ratti A, and Buratti E (2016). Physiological functions and pathobiology of TDP-43 and FUS/TLS proteins. J. Neurochem 138 (Suppl 1), 95–111. [DOI] [PubMed] [Google Scholar]
- Renton AE, Majounie E, Waite A, Simón-Sánchez J, Rollinson S, Gibbs JR, Schymick JC, Laaksovirta H, van Swieten JC, Myllykangas L, et al. ; ITALSGEN Consortium (2011). A hexanucleotide repeat expansion in C9ORF72 is the cause of chromosome 9p21-linked ALS-FTD. Neuron 72, 257–268. [DOI] [PMC free article] [PubMed] [Google Scholar]
- Ritchie ME, Phipson B, Wu D, Hu Y, Law CW, Shi W, and Smyth GK (2015). limma powers differential expression analyses for RNA-sequencing and microarray studies. Nucleic Acids Res 43, e47. [DOI] [PMC free article] [PubMed] [Google Scholar]
- Robberecht W, and Philips T (2013). The changing scene of amyotrophic lateral sclerosis. Nat. Rev. Neurosci 14, 248–264. [DOI] [PubMed] [Google Scholar]
- Schmidt EK, Clavarino G, Ceppi M, and Pierre P (2009). SUnSET, a nonradioactive method to monitor protein synthesis. Nat. Methods 6, 275–277. [DOI] [PubMed] [Google Scholar]
- Scialò C, Novi G, Bandettini di Poggio M, Canosa A, Sormani MP, Mandich P, Origone P, Truffelli R, Mancardi GL, and Caponnetto C (2016). Clinical epidemiology of amyotrophic lateral sclerosis in Liguria, Italy: an update of LIGALS register. Amyotroph. Lateral Scler. Frontotemporal Degener 17, 535–542. [DOI] [PubMed] [Google Scholar]
- Sephton CF, Good SK, Atkin S, Dewey CM, Mayer P 3rd, Herz J, and Yu G (2010). TDP-43 is a developmentally regulated protein essential for early embryonic development. J. Biol. Chem 285, 6826–6834. [DOI] [PMC free article] [PubMed] [Google Scholar]
- Sharkey LM, Safren N, Pithadia AS, Gerson JE, Dulchavsky M, Fischer S, Patel R, Lantis G, Ashraf N, Kim JH, et al. (2018). Mutant UBQLN2 promotes toxicity by modulating intrinsic self-assembly. Proc. Natl. Acad. Sci. USA 115, E10495–E10504. [DOI] [PMC free article] [PubMed] [Google Scholar]
- Shin Y, and Brangwynne CP (2017). Liquid phase condensation in cell physiology and disease. Science 357, eaaf4382. [DOI] [PubMed] [Google Scholar]
- Szklarczyk D, Morris JH, Cook H, Kuhn M, Wyder S, Simonovic M, Santos A, Doncheva NT, Roth A, Bork P, et al. (2017). The STRING data base in 2017: quality-controlled protein-protein association networks, made broadly accessible. Nucleic Acids Res 45 (D1), D362–D368. [DOI] [PMC free article] [PubMed] [Google Scholar]
- Tan Q, Yalamanchili HK, Park J, De Maio A, Lu HC, Wan YW, White JJ, Bondar VV, Sayegh LS, Liu X, et al. (2016). Extensive cryptic splicing upon loss of RBM17 and TDP43 in neurodegeneration models. Hum. Mol. Genet 25, 5083–5093. [DOI] [PMC free article] [PubMed] [Google Scholar]
- Tank EM, Figueroa-Romero C, Hinder LM, Bedi K, Archbold HC, Li X, Weskamp K, Safren N, Paez-Colasante X, Pacut C, et al. (2018). Abnormal RNA stability in amyotrophic lateral sclerosis. Nat. Commun 9, 2845. [DOI] [PMC free article] [PubMed] [Google Scholar]
- Therrien M, Dion PA, and Rouleau GA (2016). ALS: Recent Developments from Genetics Studies. Curr. Neurol. Neurosci. Rep 16, 59. [DOI] [PubMed] [Google Scholar]
- Tollervey JR, Curk T, Rogelj B, Briese M, Cereda M, Kayikci M, König J, Hortobágyi T, Nishimura AL, Zupunski V, et al. (2011). Characterizing the RNA targets and position-dependent splicing regulation by TDP-43. Nat. Neurosci 14, 452–458. [DOI] [PMC free article] [PubMed] [Google Scholar]
- Trapnell C, Pachter L, and Salzberg SL (2009). TopHat: discovering splice junctions with RNA-Seq. Bioinformatics 25, 1105–1111. [DOI] [PMC free article] [PubMed] [Google Scholar]
- Trapnell C, Hendrickson DG, Sauvageau M, Goff L, Rinn JL, and Pachter L (2013). Differential analysis of gene regulation at transcript resolution with RNA-seq. Nat. Biotechnol 31, 46–53. [DOI] [PMC free article] [PubMed] [Google Scholar]
- Traxinger K, Kelly C, Johnson BA, Lyles RH, and Glass JD (2013). Prognosis and epidemiology of amyotrophic lateral sclerosis: analysis of a clinic population, 1997–2011. Neurol. Clin. Pract 3, 313–320. [DOI] [PMC free article] [PubMed] [Google Scholar]
- Tsvetkov AS, Arrasate M, Barmada S, Ando DM, Sharma P, Shaby BA, and Finkbeiner S (2013). Proteostasis of polyglutamine varies among neurons and predicts neurodegeneration. Nat. Chem. Biol 9, 586–592. [DOI] [PMC free article] [PubMed] [Google Scholar]
- Vaccaro A, Tauffenberger A, Ash PE, Carlomagno Y, Petrucelli L, and Parker JA (2012). TDP-1/TDP-43 regulates stress signaling and age-dependent proteotoxicity in Caenorhabditis elegans. PLoS Genet 8, e1002806. [DOI] [PMC free article] [PubMed] [Google Scholar]
- Van Etten J, Schagat TL, Hrit J, Weidmann CA, Brumbaugh J, Coon JJ, and Goldstrohm AC (2012). Human Pumilio proteins recruit multiple deadenylases to efficiently repress messenger RNAs. J. Biol. Chem 287, 36370–36383. [DOI] [PMC free article] [PubMed] [Google Scholar]
- Voigt A, Herholz D, Fiesel FC, Kaur K, Müller D, Karsten P, Weber SS, Kahle PJ, Marquardt T, and Schulz JB (2010). TDP-43-mediated neuron loss in vivo requires RNA-binding activity. PLoS One 5, e12247. [DOI] [PMC free article] [PubMed] [Google Scholar]
- Wang X, McLachlan J, Zamore PD, and Hall TM (2002). Modular recognition of RNA by a human pumilio-homology domain. Cell 110, 501–512. [DOI] [PubMed] [Google Scholar]
- Wang DB, Gitcho MA, Kraemer BC, and Klein RL (2011). Genetic strategies to study TDP-43 in rodents and to develop preclinical therapeutics for amyotrophic lateral sclerosis. Eur. J. Neurosci 34, 1179–1188. [DOI] [PMC free article] [PubMed] [Google Scholar]
- Wang F, Durfee LA, and Huibregtse JM (2013). A cotranslational ubiquitination pathway for quality control of misfolded proteins. Mol. Cell 50, 368–378. [DOI] [PMC free article] [PubMed] [Google Scholar]
- Watanabe S, Kaneko K, and Yamanaka K (2013). Accelerated disease onset with stabilized familial amyotrophic lateral sclerosis (ALS)-linked mutant TDP-43 proteins. J. Biol. Chem 288, 3641–3654. [DOI] [PMC free article] [PubMed] [Google Scholar]
- Weskamp K, and Barmada SJ (2018). TDP43 and RNA instability in amyotrophic lateral sclerosis. Brain Res 1693 (Pt A), 67–74. [DOI] [PMC free article] [PubMed] [Google Scholar]
- Weskamp K, Safren N, Miguez R, and Barmada S (2019). Monitoring Neuronal Survival via Longitudinal Fluorescence Microscopy. J. Vis. Exp Published online January 19, 2019. 10.3791/59036. [DOI] [PMC free article] [PubMed] [Google Scholar]
- White EK, Moore-Jarrett T, and Ruley HE (2001). PUM2, a novel murine puf protein, and its consensus RNA-binding site. RNA 7, 1855–1866. [PMC free article] [PubMed] [Google Scholar]
- White AD, Keefe AJ, Ella-Menye JR, Nowinski AK, Shao Q, Pfaendtner J, and Jiang S (2013). Free energy of solvated salt bridges: a simulation and experimental study. J. Phys. Chem. B 117, 7254–7259. [DOI] [PubMed] [Google Scholar]
- White MA, Kim E, Duffy A, Adalbert R, Phillips BU, Peters OM, Stephenson J, Yang S, Massenzio F, Lin Z, et al. (2018). TDP-43 gains function due to perturbed autoregulation in a Tardbp knock-in mouse model of ALS-FTD. Nat. Neurosci 21, 552–563. [DOI] [PMC free article] [PubMed] [Google Scholar]
- Wils H, Kleinberger G, Janssens J, Pereson S, Joris G, Cuijt I, Smits V, Ceuterick-de Groote C, Van Broeckhoven C, and Kumar-Singh S (2010). TDP-43 transgenic mice develop spastic paralysis and neuronal inclusions characteristic of ALS and frontotemporal lobar degeneration. Proc. Natl. Acad. Sci. USA 107, 3858–3863. [DOI] [PMC free article] [PubMed] [Google Scholar]
- Winton MJ, Igaz LM, Wong MM, Kwong LK, Trojanowski JQ, and Lee VM (2008). Disturbance of nuclear and cytoplasmic TAR DNA-binding protein (TDP-43) induces disease-like redistribution, sequestration, and aggregate formation. J. Biol. Chem 283, 13302–13309. [DOI] [PMC free article] [PubMed] [Google Scholar]
- Wu B, Chao JA, and Singer RH (2012). Fluorescence fluctuation spectroscopy enables quantitative imaging of single mRNAs in living cells. Biophys. J 102, 2936–2944. [DOI] [PMC free article] [PubMed] [Google Scholar]
- Yan X, Hoek TA, Vale RD, and Tanenbaum ME (2017). Dynamics of Translation of Single mRNA Molecules In Vivo. Cell 165, 976–989. [DOI] [PMC free article] [PubMed] [Google Scholar]
- Zhang T, Hwang HY, Hao H, Talbot C Jr., and Wang J (2012). Caenorhabditis elegans RNA-processing protein TDP-1 regulates protein homeostasis and life span. J. Biol. Chem 287, 8371–8382. [DOI] [PMC free article] [PubMed] [Google Scholar]
- Zhang K, Donnelly CJ, Haeusler AR, Grima JC, Machamer JB, Steinwald P, Daley EL, Miller SJ, Cunningham KM, Vidensky S, et al. (2015). The C9orf72 repeat expansion disrupts nucleocytoplasmic transport. Nature 525, 56–61. [DOI] [PMC free article] [PubMed] [Google Scholar]
Associated Data
This section collects any data citations, data availability statements, or supplementary materials included in this article.
Supplementary Materials
Data Availability Statement
The acession number for the RNA-seq data reported in this manuscript is NCBI GEO: GSE128647.