

ABSTRACT
Background
Although short-term studies have found that serving larger portions of food increases intake in preschool children, it is unknown whether this portion size effect persists over a longer period or whether energy intake is moderated through self-regulation.
Objectives
We tested whether the portion size effect is sustained in preschool children across 5 consecutive days, a period thought to be sufficient for regulatory systems to respond to the overconsumption of energy.
Methods
With the use of a crossover design, over 2 periods we served the same 5 daily menus to 46 children aged 3–5 y in their childcare centers. In 1 period, all foods and milk were served in baseline portions, and in the other period, all portions were increased by 50%. The served items were weighed to determine intake.
Results
Increasing the portion size of all foods and milk by 50% increased daily consumption: weighed intake increased by a mean ± SEM of 143 ± 21 g/d (16%) and energy intake increased by 167 ± 22 kcal/d (18%; both P < 0.0001). The trajectories of intake by weight and energy across the 5-day period were linear and the slopes did not differ between portion conditions (both P > 0.13), indicating that there were sustained increases in intake from larger portions without compensatory changes over time. Children differed in their response to increased portions: those with higher weight status, lower ratings for satiety responsiveness, or higher ratings for food responsiveness had greater increases in intake from larger portions (all P < 0.03).
Conclusions
This demonstration that preschool children failed to adjust their intake during prolonged exposure to larger portions challenges the suggestion that their self-regulatory behavior is sufficient to counter perturbations in energy intake. Furthermore, overconsumption from large portions may play a role in the development of overweight and obesity, as the magnitude of the effect was greater in children of higher weight status. This trial was registered at www.clinicaltrials.gov as NCT02963987.
Keywords: portion size, eating behavior, preschool children, energy intake, obesity
Introduction
During the preschool years, children gain increasing autonomy over their food intake and are thought to transition from eating primarily in response to energy needs to becoming more responsive to external cues related to food, such as portion size (1). Given the emphasis in public health guidelines on the role of oversized portions of energy-dense foods in the development of childhood obesity (2, 3), it could be assumed that there is a significant body of evidence demonstrating that larger portions have sustained effects on energy intake in young children. The relevant studies, however, have been limited to short-term interventions at a single meal or several meals (4–10). It is thought that 3–4 d is the minimum period required to adjust energy intake following such challenges (11). Thus, we varied portions over 5 consecutive days, the longest uninterrupted period in which we could provide and measure all meals in a typical childcare setting, in order to determine whether the effect of portion size was sustained or whether energy intake was moderated through self-regulation.
It has been proposed that young children regulate their energy intake in response to variations in the energy content of the foods or meals they are served (12–14). One influential study observed that when consuming typical foods over 24 h, 2- to 5-y-olds had relatively consistent daily energy intakes despite having more variable intakes at individual meals (15). However, in short-term studies that varied portion size, such apparent regulation was not seen; when foods were served in larger portions, children responded by eating more (4–10). Thus, it is not clear whether children's regulation of intake is sufficient to counter the effects of variations in food properties such as portion size. It is possible that over multiple days, as regulatory mechanisms sense perturbations in energy balance, children initiate compensatory behaviors to adjust for excess intake from larger portions.
The degree to which children differ in their susceptibility to overconsumption from large portions is also unclear. Short-term studies of the portion size effect in children have found inconsistent effects for characteristics such as weight status (7, 9, 16, 17), age (4, 18), and eating behaviors (10, 17, 19, 20). Thus, we investigated whether individual differences in these attributes affected the response to larger portions when intake was measured over a longer period of 5 d. Identifying characteristics that influence children's susceptibility to food properties such as portion size could assist in the development of targeted strategies for obesity prevention.
In the present study, we systematically varied portion size during 2 periods of 5 consecutive days. We hypothesized that children's intake by weight and energy would be greater in the period when larger portions were served. We further hypothesized that the trajectories of daily intake in the 2 periods would converge over the 5 d, indicating the occurrence of energy regulation over time. This study is critical for developing a better understanding of how portion size influences energy intake of preschool children over a period thought to be sufficient to initiate compensatory eating behavior.
Methods
Experimental design
A within-subjects crossover design was used to investigate the effect on intake of serving larger portions to preschool children across 5 consecutive days. During 2 experimental periods, children were served 5 different daily menus, which provided them with all their foods and beverages. In the 100% portion size condition, baseline amounts of all items were served, and in the 150% portion size condition, the amounts of all items were increased by 50%. Breakfast, lunch, afternoon snack, and dinner were served in classrooms at childcare centers, and morning and evening snacks were provided for consumption at home. All foods and beverages were consumed ad libitum, and individual intakes were determined by weighing all served items before and after meals. The order of serving the menus across the 5 d (Monday to Friday) and the order of the portion size conditions between the 2 experimental periods were counterbalanced across classrooms through the use of Latin squares. Classrooms were randomly assigned an order of daily menus and an order of portion conditions by the data manager. The 5-d experimental periods were separated by a 2-wk washout period (Supplemental Figure 1).
Participants
Participants for the study were recruited by distributing letters to parents of children aged 3–5 y in 7 classrooms of 2 childcare centers in University Park, PA from June 2015 to April 2016. Children were excluded if they had any food allergies, food restrictions, or health issues that precluded their participation or if they were not available for the duration of the study. Parents provided informed written consent for the participation of their children and themselves and were financially compensated for their involvement. Parents and teachers were not informed of the purpose of the study. All procedures were approved by the Office for Research Protections of Pennsylvania State University. The trial was registered at clinicaltrials.gov as NCT02963987.
The sample size for the study was based on the statistical power to detect differences between the 2 portion size conditions in changes in daily energy intake across the 5 study days. The minimum difference considered to be clinically significant was 50 kcal between days (∼5% of daily intake for a typical preschool child) (21). Power analyses were performed on exemplary data sets with the use of a linear mixed model and an approximation technique based on the noncentral F distribution (22). Exemplary data sets were based on data from previous 1- and 2-d studies in preschool children (23, 24). Power analysis found that the specified difference could be detected in a sample size of 45 preschool children, with a Type 1 error rate of 0.05 and a power of 90%. It was predetermined that children's data would be excluded if they missed more than half of the study days in a 5-d period (i.e., ≥3 study days).
Experimental menus and meal procedures
Different daily menus were served on each of the 5 d within each experimental period (Supplemental Tables 1–5). On the 5 menus there were 82 food items, selected to be familiar to the children, plus milk as a beverage. The menus in the 100% portion size condition met the minimum requirements of the Child and Adult Care Food Program (25). For the other condition, the portions were increased by 50%, a difference that has been used in previous studies (9, 17) and that can be observed in the food environment (e.g., a 4- versus 6-piece chicken nugget meal). Breakfast consisted of a grain-based main dish, fruit, and milk, with a protein food added on 2 d; lunch and dinner consisted of a grain- and protein-based main dish, vegetable, fruit, and milk; afternoon and evening snacks consisted of 2 of 5 snack components (milk, grain, protein, fruit, or vegetable); and the morning snack was a cereal bar. The meal components had typical ranges of energy density: main dishes were 0.8–3.0 kcal/g, protein foods 1.7–1.8 kcal/g, fruit 0.3–0.9 kcal/g, and vegetables 0.1–1.2 kcal/g. The snack components also varied in type and energy density: fruits and vegetables ranged from 0.3 to 0.6 kcal/g, dairy items such as yogurt and cheese ranged from 0.6 to 2.7 kcal/g, and grain-based snacks such as crackers and cereal bars ranged from 2.8 to 5.0 kcal/g. Across all 5 menus, the mean daily energy served in the 100% portion condition was 1627 kcal/d and the mean served in the 150% condition was 2450 kcal/d. These amounts were equivalent to 162% and 243% of the mean estimated energy requirements of preschool children, respectively (21). The baseline amounts were greater than most children would be expected to finish. Of the total energy served on all 5 menus, the 3 main meals provided 68% and the 3 snacks provided 32%.
All study foods were prepared in the laboratory kitchen from either recipes or commercially available products. Hot foods were transported to the childcare centers in warming units, and cold foods and beverages were transported in insulated coolers. The children ate breakfast, lunch, and afternoon snack at the regularly scheduled times in the childcare center; dinner was served at the end of the childcare day. Study participants ate at shared tables with 4 to 8 other participants and 1 or 2 adults, which is standard practice at the childcare centers. At the meals, each participant was served a plate with preweighed portions of each food and a container of preweighed milk. The children were told that they could eat or drink as little or as much as they wanted of the food and milk served but could not request more of any item. If children chose not to eat a food item they were not given additional food options, which is standard practice at the childcare centers. During the meals, staff sat with the children and redirected conversations about food-related topics to minimize any influence on intake. After the children had finished eating, researchers returned any dropped or spilled food to the correct plate before weighing the uneaten food items to determine the intake of each child.
Morning and evening snacks were provided for home consumption to ensure that if children were still hungry at the end of a study day they had an opportunity to consume additional food. The morning snack was for consumption before breakfast and the evening snack was for consumption after dinner. These snacks were preweighed and placed in individual containers, which were packed in personal insulated coolers for transport. Parents were instructed that these snacks were to be consumed only by the study participant. The containers and any uneaten amounts of the snacks were returned to the childcare center on the subsequent day and weighed to determine intake. On the evening of each study day, parents completed a report to document whether the child had consumed any foods or beverages other than those provided for the study and to briefly describe any non-study items consumed by their child.
Weights of study food and milk were measured to the nearest 0.1 g with the use of digital scales (Mettler-Toledo PR5001 and XS4001S; Mettler-Toledo, Columbus, OH). Energy and macronutrient intakes were calculated from the weight based on the information provided by the food manufacturers and a standard food composition database (26).
Assessments
Physical activity assessment
Each child wore an activity monitor with a triaxial accelerometer (model wGT3X-BT, ActiGraph LLC) during all study days from 0900 to 1700. The monitors were initialized and positioned on the child above the iliac crest of the right hip with an adjustable elastic belt. The activity data were assessed for wear-time validation and scored with cutoffs for preschool children (27) through the use of actigraphy data analysis software (ActiLife v6.13.1, ActiGraph LLC). The step count measure was used to assign 1 of 4 physical activity levels to each child, which was then used to calculate energy requirements through the use of equations for preschool children (21).
Body height and weight
Anthropometric assessments were conducted 1 wk after the final experimental period. Body height was measured in duplicate to the nearest 0.1 cm with the use of a portable stadiometer (model 214; Seca Corporation) and body weight was measured in duplicate to the nearest 0.1 kg with the use of a portable digital scale (model 843; Seca Corporation). The measurement was repeated if the duplicate measurements differed by >0.5 cm for height or >0.2 kg for weight. The means of the duplicate measures were used in the calculation of sex-specific BMI-for-age percentiles and BMI z scores with the use of a software program based on nationally representative data (28).
Food liking assessment
Food liking was assessed during an individual session with each child 1 wk after the final experimental period. Since it was impractical to have the children assess all the foods on the 5 daily menus, lunch main dishes were chosen because they provide a substantial portion of the energy children typically consume at the childcare centers. The lunch main dishes were evaluated through the use of a 5-point cartoon face scale to rate the food as “super yummy,” “yummy,” “just okay,” “yucky,” or “super yucky” (17). After each child was instructed on the use of the cartoon faces, samples of the 5 lunch main dishes were tasted and rated in a randomly assigned order.
Parent and teacher questionnaires
Parents were asked to complete 4 questionnaires about child and family characteristics, child eating behaviors, and child feeding practices. The demographic questionnaire had 16 items about family characteristics and the health status of the child. The Children's Eating Behaviour Questionnaire (CEBQ) is a 35-item instrument with 8 subscales that evaluates child eating behaviors in relation to risk factors for obesity (29, 30). Examples of CEBQ subscales are satiety responsiveness (5 items assessing how frequently a child becomes full easily and leaves food when finished eating) and food responsiveness (5 items assessing how frequently a child shows interest in food and wants to spend time eating). The Child Feeding Questionnaire (CFQ) is a 31-item instrument with 7 subscales that measure parental feeding practices and concerns about overweight (31). The Caregiver's Feeding Styles Questionnaire (CFSQ) is a 19-item instrument with 2 subscales, which categorizes caregivers into 1 of 4 feeding styles (32). On the CEBQ, CFQ, and CFSQ instruments, respondents rated each item through the use of a 5-point scale; subscale scores were determined by taking the mean of the scores for the relevant items.
Statistical analysis
The main outcome measures for the study were daily intakes of food and milk by weight (g) and energy (kcal); cumulative intake over the 5 d was also evaluated. To test the first hypothesis, differences in mean outcomes between the 2 portion size conditions were analyzed through the use of a linear mixed model with repeated measures. The fixed factors in the model were portion size condition (100% or 150%), study week, study day, menu, classroom, and sex. Interactions between these factors were tested and removed from the model if not significant. Participants were treated as a random effect. The Tukey-Kramer method was used to adjust for multiple pairwise comparisons between means. In order to evaluate the contribution to children's intakes of non-study foods and beverages reported by parents, the energy content of the reported items was estimated by research staff. The outcome of daily energy intake was analyzed both with and without the non-study items, and these estimated data were not included in further analyses.
A random coefficients model was used to test the second hypothesis that the trajectories of daily intake in the 2 portion size conditions would converge over the 5 d, i.e., that adjustments for differences in food and energy intake would occur over time. This model allowed the trajectories of intake over time to vary randomly and be modeled separately for each child. Time (study day) was treated as a continuous covariate in the model, and polynomial factors of time (linear and quadratic coefficients) were tested as both fixed and random effects to determine the shape of the intake trajectory. The linear coefficient represented the rate of change in intake (slope) across time after day 1, and the quadratic coefficient represented the rate of acceleration or deceleration in intake (curvature) across time after day 1.
A secondary outcome of the study was daily energy density (kcal/g) of the food consumed (33). Additional secondary outcomes were consumption by weight and energy in different categories: foods and milk separately; main meals (breakfast, lunch, dinner) and snacks (morning, afternoon, evening) separately; individual meal components (main dish, fruit, vegetable, condiment); and individual snack components (grain-based, dairy, fruit and vegetable). Outcomes for step counts and time spent at different levels of physical activity intensity (sedentary, light, and moderate to vigorous) were also tested. The secondary outcomes were analyzed through the use of similar linear mixed models as for the main outcomes.
The influence of the energy density of the individual food items on the magnitude of the portion size effect was analyzed by including all 82 foods together in a single linear mixed model. The fixed factors in the model were item energy density, study day, menu, classroom, and sex. The repeated factor was the item number assigned to each of the 82 foods; thus, intake of individual foods was adjusted for the other foods served. Participants were treated as a random effect. For each food item served across the 5 d, the portion size effect was defined as the difference in the amount consumed of the 100% and 150% portions, expressed as a percentage of the difference in the amount served of the 2 portions; this outcome was modeled across all children.
Analysis of covariance with linear mixed models was used to assess the influence of continuous participant characteristics (age, body weight, height, BMI-for-age percentile, BMI z score, step counts, and questionnaire subscales) on the relation between the experimental factors and intake. To account for testing multiple participant characteristics, the significance levels were adjusted by the method of Benjamini and Hochberg, with the false discovery rate set at 0.05 (34). Models having significant covariance with weight status were also adjusted for children's energy requirements in order to test whether the effect on the relation between portion size and intake remained significant after this adjustment. Independent-samples t tests were used to evaluate differences in subject characteristics between boys and girls, as well as differences in intake between children with and without overweight or obesity (sex-specific BMI-for-age percentile ≥85 and <85, respectively). Children who ate >95% of the food served on at ≥1 d were classified as “plate cleaners”; analyses were conducted with and without plate cleaners in order to determine whether these subjects influenced the main outcomes. Outcomes from statistical models are reported as mean ± SEM and subject characteristics are reported as mean ± SD. Standardized effect sizes are reported for the main outcomes, as represented by Cohen's d, with no adjustment for correlation owing to repeated measurements. Results were considered significant at P < 0.05. All data were analyzed through the use of SAS software (SAS 9.4, SAS Institute, Inc.).
Results
Subject characteristics
A total of 50 children were enrolled in the study, but 4 children were excluded from the analysis because they did not meet the predefined attendance criteria (missed ≥3 d in a 5-d period). Thus, 46 children (30 boys and 16 girls) were included in the analysis (Table 1). The children had a mean ± SD age of 4.4 ± 0.6 y and a mean sex-specific BMI-for-age percentile of 52.8 ± 24.5. Five children (11%) were classified as having overweight or obesity. The sample of children was 74% white, 9% Asian, 6% mixed or another race, and 11% unreported; 13% were of Hispanic or Latino origin. Parents provided family information for 45 children (98%); 76% reported a household income of >$50,000, and 84% of fathers and 96% of mothers had a bachelor's degree or higher.
TABLE 1.
Characteristics of 46 preschool children
| Boys (n = 30) | Girls (n = 16) | Significance of difference1 (P value) | |||
|---|---|---|---|---|---|
| Characteristic | Mean ± SD | Range | Mean ± SD | Range | |
| Age, y | 4.3 ± 0.6 | 3.1–5.5 | 4.4 ± 0.6 | 3.1–5.2 | 0.92 |
| Weight, kg | 17.9 ± 2.5 | 14.4–22.9 | 17.7 ± 4.3 | 12.6–31.6 | 0.88 |
| Height, cm | 106.6 ± 6.8 | 97.2–120.7 | 104.3 ± 5.4 | 95.0–116.4 | 0.24 |
| Sex-specific BMI-for-age percentile2 | 50.1 ± 22.6 | 7.8–92.5 | 57.8 ± 27.8 | 8.0–99.9 | 0.31 |
| BMI z score2 | 0.01 ± 0.69 | −1.42–1.44 | 0.30 ± 1.01 | −1.40–2.97 | 0.22 |
| Estimated energy requirements, kcal/d3 | 1043 ± 64 | 958–1168 | 939 ± 66 | 848–1142 | <0.0001 |
| Satiety responsiveness score4 | 3.0 ± 0.5 | 1.6–4.0 | 3.0 ± 0.5 | 2.2–3.8 | 0.74 |
| Food responsiveness score4 | 2.4 ± 0.8 | 1.2–4.0 | 2.5 ± 0.6 | 1.6–3.4 | 0.71 |
Differences between means of boys and girls were evaluated by independent-samples t tests.
Calculated from body weight, height, age, and sex through the use of a software program based on nationally representative data (28).
Calculated from body weight, height, age, and physical activity level through the use of equations for preschool children (21).
Subscale on the Children's Eating Behaviour Questionnaire (30).
Of the 46 children, 45 (98%) completed the liking assessments for the 5 lunch main dishes. These dishes were well liked by the children: 4 of the lunch main dishes were rated as “just okay,” “yummy,” or “super yummy” by 80% of the children, and the other lunch main dish was rated as “just okay,” “yummy,” or “super yummy” by 67% of the children.
Intakes by weight
Increasing the portion size of all foods and milk served over 5 d to preschool children led to a significant increase in the mean daily weight consumed (Table 2; P < 0.0001), supporting the first hypothesis. Serving larger portions increased intake by a mean of 143 ± 21 g/d or 16% compared with serving baseline portions. When the 8 children who were identified as plate cleaners were excluded from the analysis, the difference in intake between the 2 conditions was 154 ± 22 g/d (19%; P < 0.0001), and the effect of portion size on intake remained significant. Additionally, there was no significant effect of the study week, study day, or classroom on daily intake by weight. When cumulative intake over the 5 d was examined, the increased intake from larger portions was first found to be significant on day 1 at the afternoon snack (101 ± 31 g; P = 0.0013) (Figure 1A). Over the 5 d, serving larger portions led to a cumulative increase in intake of 733 ± 131 g (Figure 1A).
TABLE 2.
Daily weight and energy of food and milk consumed over 5 d by 46 preschool children in a study testing the effect of portion size on energy intake
| Intake by weight, g/d | Intake by energy, kcal/d | |||||||
|---|---|---|---|---|---|---|---|---|
| 100% portions1 | 150% portions1 | Significance (P value) | Effect size2 | 100% portions1 | 150% portions1 | Significance (P value) | Effect size2 | |
| All food | 542 ± 29 | 626 ± 29 | <0.0001 | 0.42 | 758 ± 36 | 900 ± 36 | <0.0001 | 0.59 |
| Food at main meals3 | 398 ± 22 | 443 ± 22 | 0.0003 | 0.27 | 459 ± 23 | 515 ± 23 | <0.0001 | 0.33 |
| Main dish | 143 ± 10 | 156 ± 10 | 0.01 | 0.17 | 289 ± 16 | 329 ± 16 | <0.0001 | 0.27 |
| Vegetable | 72 ± 6 | 76 ± 6 | 0.28 | 0.09 | 55 ± 5 | 59 ± 5 | 0.12 | 0.06 |
| Fruit | 170 ± 12 | 194 ± 12 | 0.003 | 0.21 | 95 ± 7 | 106 ± 7 | 0.02 | 0.13 |
| Condiments | 14 ± 1 | 17 ± 1 | 0.02 | 0.17 | 22 ± 2 | 26 ± 2 | 0.002 | 0.22 |
| Food at snacks4 | 145 ± 10 | 188 ± 10 | <0.0001 | 0.44 | 306 ± 18 | 388 ± 18 | <0.0001 | 0.57 |
| Grain-based snacks | 61 ± 4 | 77 ± 4 | <0.0001 | 0.49 | 230 ± 15 | 291 ± 15 | <0.0001 | 0.50 |
| Dairy snacks | 45 ± 4 | 60 ± 4 | <0.0001 | 0.26 | 63 ± 5 | 81 ± 5 | <0.0001 | 0.27 |
| Fruit and vegetable snacks | 43 ± 5 | 54 ± 5 | 0.02 | 0.16 | 16 ± 2 | 20 ± 2 | 0.006 | 0.12 |
| All milk | 338 ± 29 | 389 ± 29 | 0.003 | 0.32 | 153 ± 13 | 178 ± 13 | 0.0004 | 0.35 |
| Milk at main meals5 | 272 ± 25 | 298 ± 25 | 0.08 | 0.20 | 117 ± 11 | 128 ± 11 | 0.06 | 0.21 |
| Milk at snacks6 | 84 ± 6 | 114 ± 6 | <0.0001 | 0.66 | 36 ± 2 | 49 ± 2 | <0.0001 | 0.65 |
| All food and milk | 899 ± 45 | 1042 ± 46 | <0.0001 | 0.51 | 914 ± 44 | 1081 ± 44 | <0.0001 | 0.62 |
| Food and milk at main meals | 669 ± 35 | 739 ± 35 | <0.0001 | 0.32 | 577 ± 29 | 644 ± 29 | <0.0001 | 0.36 |
| Food and milk at snacks | 230 ± 13 | 303 ± 13 | <0.0001 | 0.66 | 341 ± 19 | 437 ± 19 | <0.0001 | 0.65 |
Values are means ± SEMs from the linear mixed model for each outcome.
Standardized effect sizes are represented by Cohen's d, with no adjustment for correlation owing to repeated measurements.
Total intake of foods served at breakfast, lunch, and dinner.
Total intake of foods served at morning snack, afternoon snack, and evening snack.
Total intake of milk served at breakfast, lunch, and dinner.
Intake of milk served at afternoon snack; water was the beverage at morning and evening snack.
FIGURE 1.

Mean ± SEM cumulative (A) weight consumed and (B) energy intake over 5 consecutive days during which the portion sizes of all foods and milk served to 46 preschool children were either 100% or 150% of the baseline amounts. Daily meals consisted of morning snack, breakfast, lunch, afternoon snack, dinner, and evening snack, each of which is represented by a point on the graph. Through the use of a mixed linear model, a significant portion size effect was found for cumulative intake of food and milk starting at afternoon snack on day 1 (indicated by *; P = 0.0002) and for cumulative energy intake starting at lunch on day 1 (indicated by **; P = 0.001). The increase in intake by weight and energy from larger portions accumulated over time.
Analyzing the trajectories of daily intake over the 5-d period showed that the pattern was linear for both portion conditions, and the slopes did not differ between conditions (P = 0.13; Figure 2A). Thus, contrary to the second hypothesis, the increased consumption in the 150% portion size condition compared with the 100% condition was sustained across all 5 d (Table 3). Additionally, the slopes of the trajectories across the days were not significantly different from zero in either the condition with baseline portions (10.7 ± 8.5 g/d; P = 0.21) or larger portions (–6.4 ± 8.9 g/d; P = 0.47). This indicates that there was no evidence of adjustment in intakes across the 5 d.
FIGURE 2.

Mean ± SEM daily intake across time according to the (A) weight and (B) energy consumed by 46 preschool children during which the portion sizes of all foods and milk served were either 100% or 150% of the baseline amounts. The trajectories from a random coefficients model were linear for both portion conditions, and the slopes did not differ between conditions for intake by either weight (P = 0.13) or energy (P = 0.14). This indicates that increasing the portion sizes led to a significant and sustained increase in intake by weight (P < 0.0001) and energy (P < 0.0001) across all 5 d.
TABLE 3.
Weight and energy consumed at meals and snacks each study day by 46 preschool children in a study testing the effect of portion size on energy intake1
| Intake by weight, g/d | Intake by energy, kcal/d | |||
|---|---|---|---|---|
| 100% portions | 150% portions | 100% portions | 150% portions | |
| Day 1 | ||||
| Main meals2 | 670 ± 31 | 734 ± 32 | 575 ± 28 | 664 ± 27 |
| Snacks3 | 245 ± 12 | 349 ± 22 | 348 ± 14 | 467 ± 22 |
| Daily total4 | 915 ± 35 | 1085 ± 46 | 923 ± 33 | 1132 ± 39 |
| Day 2 | ||||
| Main meals | 684 ± 32 | 806 ± 41 | 598 ± 29 | 705 ± 33 |
| Snacks | 238 ± 13 | 316 ± 218 | 365 ± 17 | 452 ± 24 |
| Daily total | 921 ± 39 | 1127 ± 53 | 963 ± 36 | 1161 ± 47 |
| Day 3 | ||||
| Main meals | 712 ± 36 | 759 ± 36 | 617 ± 28 | 639 ± 29 |
| Snacks | 260 ± 14 | 323 ± 20 | 375 ± 20 | 480 ± 28 |
| Daily total | 972 ± 42 | 1089 ± 49 | 992 ± 36 | 1126 ± 46 |
| Day 4 | ||||
| Main meals | 742 ± 35 | 772 ± 44 | 640 ± 28 | 683 ± 38 |
| Snacks | 257 ± 12 | 315 ± 18 | 368 ± 19 | 445 ± 25 |
| Daily total | 994 ± 44 | 1087 ± 56 | 998 ± 38 | 1128 ± 53 |
| Day 5 | ||||
| Main meals | 695 ± 30 | 810 ± 42 | 588 ± 25 | 682 ± 35 |
| Snacks | 239 ± 14 | 295 ± 19 | 345 ± 21 | 431 ± 27 |
| Daily total | 933 ± 51 | 1104 ± 51 | 934 ± 35 | 1113 ± 50 |
All values are means ± SEMs.
Includes food and milk served at breakfast, lunch, and dinner.
Includes food and milk served at morning snack, afternoon snack, and evening snack.
Includes food and milk served at all meals and snacks over the day.
Energy intakes
Similar to the effect on intake by weight, serving larger portions of all foods and milk over 5 d led to a significant increase in children's daily energy intake of 167 ± 22 kcal/d or 18% (P < 0.0001; Table 2). When plate cleaners were excluded from the analysis, the difference in energy intake between the 2 conditions remained significant at 186 ± 23 kcal/d (22%; P < 0.0001). There was no significant effect of the study week, study day, menu, or classroom. An effect of portion size on cumulative energy intake was first found on day 1 at lunch (101 ± 31 kcal; P = 0.001). The differences in energy intake continued to accumulate over time (Figure 1B), resulting in a mean increase in energy intake of 784 ± 110 kcal over the 5-d period. Children consumed 109 ± 4% of their estimated daily energy requirements from study foods when larger portions were served, compared with 93 ± 4% of their requirements when baseline portions were served (P < 0.0001).
The analysis of energy intake across the 5-d period found that the trajectories of daily intake over time were linear for both portion conditions, and the slopes did not differ between conditions (P = 0.14; Table 3). Thus, the increased energy intake from the larger portions persisted over the entire 5-d period (Figure 2B). Additionally, the slopes of the trajectories were not significantly different from zero in either the condition with baseline portions (6.8 ± 8.9 kcal/d; P = 0.45) or that with larger portions (−9.9 ± 9.3 kcal/d; P = 0.29). Consequently, there was no evidence of adjustment over 5 d in children's energy intakes.
Estimated energy intakes of parentally reported non-study foods and beverages were 99 ± 7 kcal/d in the 100% condition and 63 ± 7 kcal/d in the 150% condition, which were significantly different (P = 0.001). When estimates of non-study items were included, the linear (P = 0.47) and quadratic (P = 0.55) coefficients did not differ between conditions (Supplemental Figure 2). After including non-study items, serving larger portions increased energy intake by 129 ± 23 kcal/d or 13% (P < 0.0001); children consumed 115 ± 4% of their daily requirements from larger portions and 102 ± 4% from baseline portions (P < 0.0001). Thus, although parentally reported intake of non-study items differed between conditions, the robust effect of portion size on energy intake persisted over time after the estimated intake of these foods was included in the analysis.
Intakes of meal and snack components
Assessment of the different meal and snack components showed that serving larger portions led to increased intakes by both weight and energy at the 3 main meals (breakfast, lunch, dinner) considered together and the 3 snacks (morning, afternoon, and evening) considered together (P < 0.0001; Table 2). Serving larger portions increased energy intake of most meal and snack components: main dishes by 39 ± 9 kcal/d (14%; P < 0.0001), fruits by 11 ± 4 kcal/d (12%; P = 0.015), grain-based snacks by 61 ± 9 kcal/d (27%; P < 0.0001), dairy snacks by 18 ± 4 kcal/d (29%; P < 0.0001), and fruit and vegetable snacks by 4 ± 1 kcal/d (26%; P = 0.006). In contrast, serving larger portions did not significantly affect children's intake of vegetables at main meals (3 ± 2 kcal/d; P = 0.12). The meal and snack components that contributed the greatest increases in energy intake from larger portions were the main dishes and the grain-based snacks; together these components accounted for 60% of the daily increase in energy intake (Table 2).
Energy density
When larger portions of food were served, there was a 3.5% increase in the energy density of the daily food consumed (from 1.45 ± 0.04 to 1.50 ± 0.04 kcal/g; P = 0.006). This increase in dietary energy density was attributable to the greater magnitude of the portion size effect for foods consumed at snacks (29% increase from baseline intake; Table 2) than those at main meals (11% increase). Because the food items served at snacks were higher in energy density (mean served 1.85 ± 0.14 kcal/g) than the foods served at main meals (mean served 1.12 ± 0.04 kcal/g), eating greater amounts of large portions at snacks than at main meals led to an increase in the energy density of the food consumed. Thus, serving larger portions not only increased energy intake directly by leading to a substantial increase in food consumption, but also increased it by a shift in the types of foods consumed, which led to an increase in dietary energy density.
For the 82 food items served across the 5 d, there was a positive relation between the energy density of the item and the magnitude of the portion size effect for that item (Figure 3; P < 0.0001). For every 1 kcal/g increase in item energy density, there was a mean 7.4 ± 1.0% increase in the magnitude of the portion size effect. For example, for items with a lower energy density (1.0 kcal/g), children ate a mean of 12% of the additional amount served, whereas for items with a higher energy density (4.0 kcal/g), they ate a mean of 34% of the additional amount served.
FIGURE 3.

Influence of the energy density of 82 food items on the magnitude of the portion size effect for each item. During different 5-d periods, 46 preschool children were served portion sizes of all foods and milk in either 100% or 150% of baseline amounts. The portion size effect for each food item was defined as the difference in the amount consumed from the 2 portions, expressed as a percentage of the difference in the amount served. The energy density of the items significantly affected the magnitude of the portion size effect for that item, according to a linear mixed model with repeated measures (P < 0.0001). For every 1 kcal/g increase in item energy density, there was a mean 7.4 ± 1.0% increase in the portion size effect.
Physical activity
Children's daily step counts did not differ between the 100% portion size condition (5701 ± 158 steps/d) and the 150% condition (5637 ± 159 steps/d; P = 0.65). Additionally, there was no difference between portion size conditions in the time that children spent on physical activity that was sedentary (302 ± 4 vs. 299 ± 4 min/d; P = 0.46), light (136 ± 3 vs. 137 ± 3 min/d; P = 0.72), or moderate to vigorous (46 ± 2 vs. 46 ± 2 min/d; P = 0.68). Analysis of covariance found that children's daily step counts did not affect the relation between portion size and daily energy intake (P = 0.59).
Effects of subject characteristics
Analysis of covariance showed that the relation between portion size and daily intake by weight or energy was not influenced by the children's sex, age, or most of the subscales of the CFQ or the CFSQ.
Several measures of children's body size, however, did significantly influence the relation between portion size and daily intake, even after adjusting for energy requirements. Children with a higher sex-specific BMI-for-age percentile were more responsive to larger portions, in that their increased intake from larger portions compared with baseline was greater than that of children with a lower BMI-for-age percentile (adjusted P = 0.0005; Figure 4). For example, when portion sizes were increased, estimates from the analysis of covariance showed that children with a 90th BMI-for-age percentile increased intake by 235 ± 37 kcal/d (P < 0.0001), whereas children with a 10th BMI-for-age percentile had no significant change in intake (47 ± 42 kcal/d; P = 0.26). Finding an effect of body size after adjustment for energy needs indicates that children with a higher weight status were not simply eating more from larger portions because of their higher energy requirements. Comparable results were found for other measures of body size: BMI z score, body weight, and height (all adjusted P = 0.0005). In addition, the magnitude of the portion size response was significantly greater in children with overweight or obesity (BMI-for-age percentile ≥85) than in those without overweight or obesity (327 ± 35 vs. 112 ± 16 g/d; adjusted P = 0.0005). Thus, children with a larger body size consumed an even greater amount when larger portions were served (compared with children with a smaller body size), even after adjustment for energy requirements.
FIGURE 4.
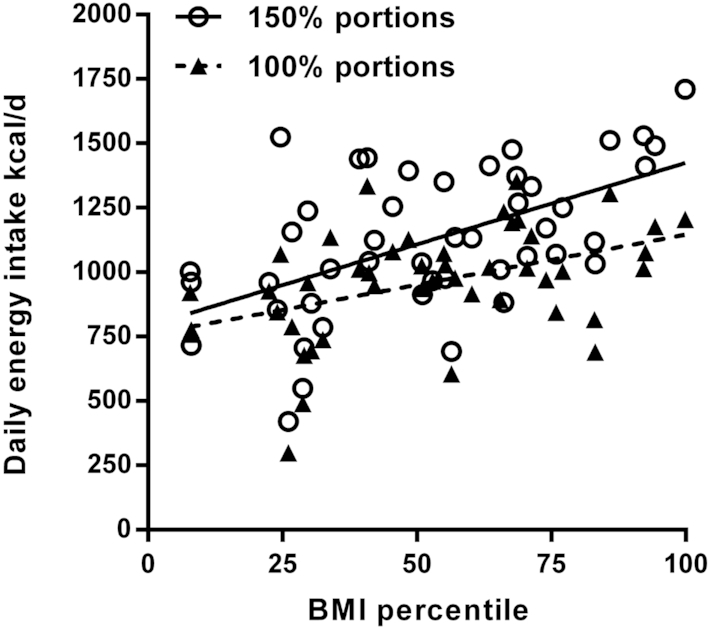
The influence of children's body size, as assessed by sex-specific BMI-for-age percentile, on the relation between portion size and mean daily energy intake. In different 5-d periods, 46 preschool children were served 100% and 150% of baseline portions of all foods and milk. Results from analysis of covariance through the use of mixed linear models with repeated measures showed that the slope of the regression line for the 150% portions was significantly greater than the slope for the 100% portions (adjusted P = 0.0005), even after adjustment for energy requirements. Thus, children with a higher BMI-for-age percentile showed a greater response to increased portions than children with a lower BMI-for-age percentile.
Subscales of the CEBQ (which was completed by parents) also influenced the relation between the portion size served and the amount consumed. When tested individually in the analysis of covariance, the subscale scores for satiety responsiveness, food responsiveness, and enjoyment of food were all significant. For the satiety responsiveness subscale, children with lower scores had greater increases in intake from larger portions than did children with higher scores (adjusted P = 0.03; Figure 5A). For example, when portion sizes were increased, the analysis of covariance showed that children with low satiety responsiveness (a score of 2 on a 5-point scale) increased intake by 222 ± 48 g/d (P < 0.0001), whereas children with higher satiety responsiveness (a score of 4) had no significant change in intake (38 ± 48 g/d; P = 0.43). For both the food responsiveness subscale (adjusted P = 0.003; Figure 5B) and enjoyment of food subscale (adjusted P = 0.008; Figure 5C), children with higher scores had greater increases in consumption from larger portions than did children with lower scores. For example, when portion sizes were increased, children with high food responsiveness (a score of 4 on a 5-point scale) increased intake by 304 ± 55 g/d (P < 0.0001), whereas children with lower food responsiveness (a score of 2) increased intake by 78 ± 26 g/d (P = 0.003). When the 3 significant CEBQ subscales (satiety responsiveness, food responsiveness, and enjoyment of food) were combined with BMI-for-age percentile in a single model, only food responsiveness (P = 0.0002) and BMI-for-age percentile (P = 0.01) continued to influence the relation between the portion size served and the amount consumed.
FIGURE 5.
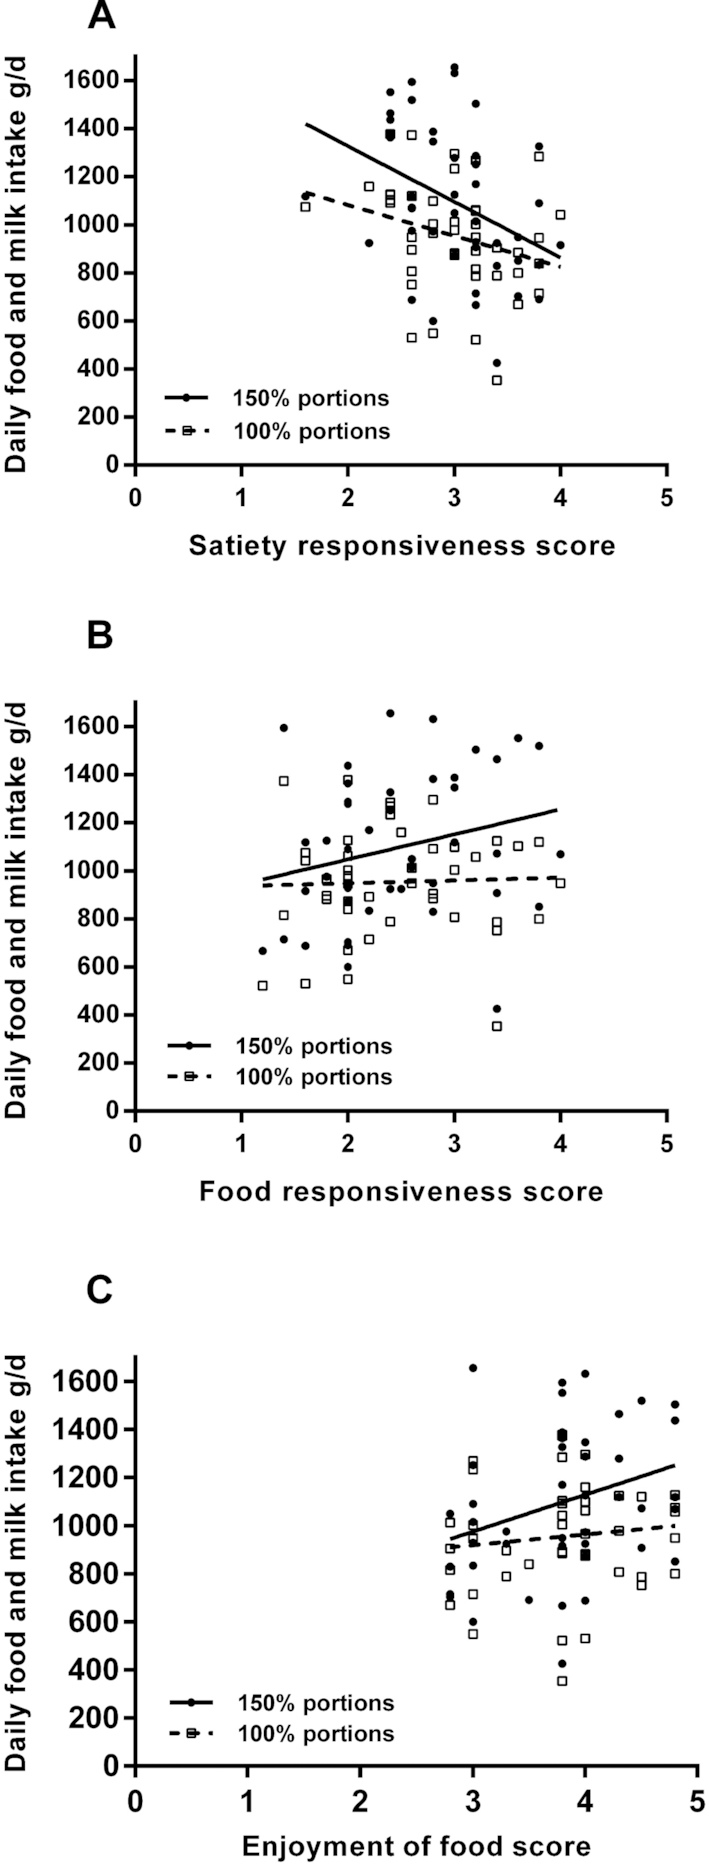
Influence of scores on the (A) satiety responsiveness, (B) food responsiveness subscales, and (C) enjoyment of food of the Children's Eating Behaviour Questionnaire on the relation between portion size and intake in 46 preschool children who were served 100% and 150% of baseline portions of all foods and milk in different 5-d periods. Results from analysis of covariance through the use of mixed linear models with repeated measures showed that for all 3 subscales, the slope of the regression line for the 150% portions was significantly steeper than the slope for the 100% portions (all adjusted P < 0.03). Thus, children with higher scores for satiety responsiveness had smaller increases in intake from larger portions than did children with lower scores. Also, children with higher scores for food responsiveness and enjoyment of food had greater increases in intake from larger portions than did children with lower scores.
Discussion
Preschool children showed a sustained response to larger portions by continuing to overeat throughout a 5-d period. Contrary to the suggestion that young children moderate their daily energy intake through self-regulation (15, 35), over multiple days children did not adjust their intake in response to increased consumption. When larger portions were served, children ate greater amounts of all food types except vegetables and consumed a greater proportion of their diet from snack foods, which resulted in daily intakes that were 10–15% above their calculated energy needs. In addition, the relation between portion size and intake was influenced by the children's weight status and parental ratings of eating behaviors, providing evidence that children differ in their susceptibility to overconsumption from large portions. The demonstration that preschool children fail to adjust their intake during prolonged exposure to larger portions challenges the assertion that self-regulatory behavior is sufficient to counter perturbations in energy intake associated with an obesogenic food environment.
Support for the idea that young children show self-regulation of intake came from early observational research (35), followed by experimental studies demonstrating that children make adjustments in intake following changes in the energy content of preloads (12–14). Another influential study measured food and beverage intake over 2 d and found that, although energy intake varied considerably from meal to meal, it was relatively constant over an entire day (15). However, researchers have challenged the statistical reasoning used to conclude that daily energy was regulated, as well as the generalizability of these data (36, 37). Furthermore, the suggestion that young children regulate daily intake is contradicted by experimental studies showing that increases in food portion size and energy density have sustained effects on preschool children's energy intake over 1 or 2 d (5, 23). The results from the present study are noteworthy because when we extended intake measurements across 5 d, we did not observe compensatory adjustments in measured intake or physical activity level. Outside of the childcare center, children did consume smaller amounts of non-study foods when larger portions were served, according to parental reports; this differential intake reduced the effect of larger portions by ∼40 kcal/d and suggests some degree of compensation. However, the lack of a significant change in the trajectory of energy intake when accounting for non-study foods demonstrates the robust effect of portion size on young children's intake. The mechanisms underlying the effect of portion size in children are not clear (38), but may be related to the activation in brain regions associated with reward (39) or the perception that it is appropriate to eat more food when larger portions are served (40). The finding that larger portion sizes led children to eat substantially more than their energy requirements over 5 d indicates that oversized portions can overwhelm a child's regulatory system and that further investigation is needed to identify modifiable mechanisms underlying this effect.
The number of meals served over the duration of this study allowed us to examine differences in the portion size effect across a variety of foods and meal components. The magnitude of overconsumption from large portions was found to vary by food type and energy density. When larger portions were served we found that children, like adults (41–43), ate greater amounts of most foods, but not vegetables. The preferential consumption of foods other than vegetables is likely because of the relatively lower palatability of vegetables in preschool children (44, 45). In contrast to the lack of a portion size effect on vegetable intake, children consumed a greater proportion of the typically preferred energy-dense foods (46), particularly snacks. Snacking is a concern because approximately one-third of children's diets comes from snacks, which tend to be energy-dense and contribute to excess energy intakes (47–49), as they did in the current study. Caregivers need guidance on how to increase both the proportion and palatability of vegetables relative to the more energy-dense components served at meals in order to moderate energy intake (17, 50).
Investigation of the influence of children's characteristics, particularly weight status, on the response to portion size was facilitated by the extended assessment of intake. Single-meal experimental studies have not generally found body size to affect the relation between portion size and intake (9, 16, 17), although one found that children's BMI percentile moderated the portion size effect (7). By providing children with varied portions across numerous meals, we found that children's body size is positively related to consumption of larger portions, even after energy needs are taken into account. Evidence from previous cross-sectional studies suggested that there was a positive relation between the size of the portions children consume and body weight (51, 52). Our finding indicates that this positive correlation is not simply a result of children with a higher weight status consuming more because they have greater energy requirements (53). Instead, children with a higher weight status may consume more from large portions owing to differences in appetitive traits (54), such as having a higher responsiveness to food cues than children with a lower weight status, who may have protective traits.
Several characteristics other than body size may influence the effect of portion size on children's intake. In some previous studies, children's age was found to affect the response to portion size, such that younger children were relatively unresponsive (4, 18) and were thought to depend more upon internal rather than external regulatory cues for intake (1). We found that the portion size effect did not differ for children across the age range of 3–5 y. The magnitude of the effect, however, did vary with the parentally reported degree of susceptibility to internal and external cues. Satiety responsiveness and food responsiveness have been found previously, but inconsistently, to influence the relation between portion size and children's intake at a single meal (10, 17, 19, 20). Research suggests that children who are more responsive to satiety cues and less responsive to food cues are relatively protected from weight gain in the obesogenic food environment (55). Similarly, we found that children who had higher satiety responsiveness, lower food responsiveness, or lower enjoyment of food were less susceptible to the effects of portion size over a 5-d period. However, when these subject characteristics were analyzed together with BMI percentile, only food responsiveness and BMI percentile remained significant influences on the portion size effect. This suggests that correlation exists between the eating behavior measures, and also that children with a higher BMI percentile and children with a higher food responsiveness may represent different groups of children who are at risk of overconsumption from large portions. It is crucial to gain a better understanding of eating behaviors that influence children's susceptibility to factors in the food environment. Such knowledge will help identify children who might benefit from targeted interventions, such as training to be more responsive to internal cues of satiety (13).
The present study systematically measured the portion size effect at multiple meals across 5 d, thus providing one of the most detailed assessments available for intake of preschool children. The majority of the intake was measured under controlled conditions in childcare centers, the typical environment of the children. The 5-d period allowed accurate measurement of children's intake in this setting from Monday to Friday; a longer study would have involved weekends, when it would have been difficult to ensure compliance. Assessment of non-study food consumed outside of the childcare centers relied on parental reports; this methodology is often associated with under-reporting of food intake (56). However, we found that children's measured intakes in the baseline condition were close to their energy needs, suggesting the overall accuracy of intake measurements across the 5-d period. Additionally, the meals served in the study were relatively healthy and lower in energy density. Therefore, the influence of portion size on energy intake may be greater in the home environment or in restaurant settings, where more energy-dense foods may be served. To help generalize the results, further evaluation of portion size effects in more diverse socioeconomic and cultural groups is needed.
This study is the first to show that increasing the portion size of all foods and milk served to preschool children over multiple days leads to a sustained increase in intake. Over the 5-d period, there was no evidence of self-regulation in response to increased energy intake from larger portions. With such extended measurement of intake, and thus a greater variety of foods, there were more opportunities to identify traits that predispose children to overconsumption of larger portions than in previous studies of shorter duration. Children with higher weight status, lower satiety responsiveness, higher food responsiveness, or higher enjoyment of food were significantly more susceptible to the portion size effect. Strategies targeting these risk factors, such as teaching children to respond to internal cues of hunger and satiety, need to be developed and tested to help moderate children's response to portion size. Additionally, interventions should determine effective strategies to use portion size positively to encourage intake of nutrient-rich foods such as fruits and vegetables. Guidelines for child feeding should recognize that serving large portions of foods high in energy density has sustained effects that may undermine children's regulation of energy intake.
Supplementary Material
ACKNOWLEDGEMENTS
We thank Cara Meehan, Levi Reihart, Brittany James, and undergraduate students in the Laboratory for the Study of Human Ingestive Behavior for their assistance with food preparation and data collection. We also appreciate the support of teachers, parents, and students at the Bennett Family Center and the Child Care Center at Hort Woods.
The authors’ responsibilities were as follows—ADS, LSR, CES, FMZ, KLK, SMRK, and BJR: designed the experiment; ADS, CES, and FMZ: collected the data; ADS and LSR: analyzed the data; ADS, LSR, and BJR: wrote the manuscript; and all authors: read and approved the final manuscript. None of the authors had a personal or financial conflict of interest.
Notes
This work was supported by the National Institutes of Health (Grant R01-DK082580 to BJR) and the USDA (National Institute of Food and Agriculture Grant 2011-67001-30117 Program A2121-Childhood Obesity Prevention: Transdisciplinary Graduate Education and Training in Nutrition and Family Sciences).
Supplemental Figures 1 and 2 and Supplemental Tables 1–5 are available from the “Supplementary data” link in the online posting of the article and from the same link in the online table of contents at https://academic.oup.com/ajcn/.
Abbreviations used: CEBQ, Children's Eating Behaviour Questionnaire; CFQ, Child Feeding Questionnaire; CFSQ, Caregiver's Feeding Styles Questionnaire.
References
- 1. Birch LL, Fisher JO. Development of eating behaviors among children and adolescents. Pediatrics. 1998;101:539–49. [PubMed] [Google Scholar]
- 2. USDA. ChooseMyplate.gov. How much does my preschooler need?. Version current: 26 June 2018 [Internet]. Available from: https://www.choosemyplate.gov/how-much-does-my-preschooler-need. [Google Scholar]
- 3. WHO, e-Library of Evidence for Nutrition Actions. Limiting portion sizes to reduce the risk of childhood overweight and obesity. Version current: 31 October 2018. [Internet]. Available from: http://www.who.int/elena/titles/portion_childhood_obesity/en/. [Google Scholar]
- 4. Rolls BJ, Engell D, Birch LL. Serving portion size influences 5-year-old but not 3-year-old children's food intakes. J Am Diet Assoc. 2000;100:232–4. [DOI] [PubMed] [Google Scholar]
- 5. Fisher JO, Arreola A, Birch LL, Rolls BJ. Portion size effects on daily energy intake in low-income Hispanic and African American children and their mothers. Am J Clin Nutr. 2007;86(6):1709–16. [DOI] [PubMed] [Google Scholar]
- 6. Fisher JO. Effects of age on children's intake of large and self-selected food portions. Obesity. 2007;15(2):403–12. [DOI] [PubMed] [Google Scholar]
- 7. Savage JS, Fisher JO, Marini M, Birch LL. Serving smaller age-appropriate entree portions to children aged 3–5 y increases fruit and vegetable intake and reduces energy density and energy intake at lunch. Am J Clin Nutr. 2012;95(2):335–41. [DOI] [PubMed] [Google Scholar]
- 8. Fisher JO, Rolls BJ, Birch LL. Children's bite size and intake of an entree are greater with large portions than with age-appropriate or self-selected portions. Am J Clin Nutr. 2003;77:1164–70. [DOI] [PMC free article] [PubMed] [Google Scholar]
- 9. Kral TV, Remiker AM, Strutz EM, Moore RH. Role of child weight status and the relative reinforcing value of food in children's response to portion size increases. Obesity. 2014;22(7):1716–22. [DOI] [PMC free article] [PubMed] [Google Scholar]
- 10. Mooreville M, Davey A, Orloski A, Orloski A, Hannah EL, Mathias KC, Birch LL, Kral TV, Zakeri IF, Fisher JO. Individual differences in susceptibility to large portion sizes among obese and normal-weight children. Obesity. 2015;23(4):808–14. [DOI] [PubMed] [Google Scholar]
- 11. Bray GA, Flatt JP, Volaufova J, Delany JP, Champagne CM. Corrective responses in human food intake identified from an analysis of 7-d food-intake records. Am J Clin Nutr. 2008;88:1504–10. [DOI] [PMC free article] [PubMed] [Google Scholar]
- 12. Birch LL, Deysher M. Conditioned and unconditioned caloric compensation: evidence for self-regulation of food intake in young children. Learn Motiv. 1985;16:341–55. [Google Scholar]
- 13. Johnson SL. Improving preschoolers’ self-regulation of energy intake. Pediatrics. 2000;106(6):1429–35. [DOI] [PubMed] [Google Scholar]
- 14. Kral TVE, Allison DB, Birch LL, Stallings VA, Moore RH, Faith MS. Caloric compensation and eating in the absence of hunger in 5- to 12-y-old weight-discordant siblings. Am J Clin Nutr. 2012; 96: 574–83. [DOI] [PMC free article] [PubMed] [Google Scholar]
- 15. Birch LL, Johnson SL, Andresen G, Peters JC, Schulte MC. The variability of young children's energy intake. N Engl J Med. 1991;324:232–5. [DOI] [PubMed] [Google Scholar]
- 16. Kral TV, Kabay AC, Roe LS, Rolls BJ. Effects of doubling the portion size of fruit and vegetable side dishes on children's intake at a meal. Obesity. 2010;18:521–7. [DOI] [PubMed] [Google Scholar]
- 17. Kling SMR, Roe LS, Keller KL, Rolls BJ. Double trouble: portion size and energy density combine to increase preschool children's lunch intake. Physiol Behav. 2016;162:18–26. [DOI] [PMC free article] [PubMed] [Google Scholar]
- 18. Smith L, Conroy K, Wen H, Rui L, Humphries D. Portion size variably affects food intake of 6-year-old and 4-year-old children in Kunming, China. Appetite. 2013;69:31–38. [DOI] [PMC free article] [PubMed] [Google Scholar]
- 19. Norton EM, Poole SA, Raynor HA. Impact of fruit juice and beverage portion size on snack intake in preschoolers. Appetite. 2015;95:334–40. [DOI] [PubMed] [Google Scholar]
- 20. Kling SMR, Roe LS, Sanchez CE, Rolls BJ. Does milk matter: is children's intake affected by the type or amount of milk served at a meal?. Appetite. 2016;105:509–18. [DOI] [PMC free article] [PubMed] [Google Scholar]
- 21. Butte NF, Wong WW, Wilson TA, Adolph AL, Puyau MR, Zakeri IF. Revision of Dietary Reference Intakes for energy in preschool-age children. Am J Clin Nutr. 2014;100:161–7. [DOI] [PMC free article] [PubMed] [Google Scholar]
- 22. Littell RC, Milliken GA, Stroup WW, Wolfinger RD, Schabenberger O. SAS for mixed models. 2nd ed Cary (NC): SAS Institute Inc; 2006. [Google Scholar]
- 23. Leahy KE, Birch LL, Rolls BJ. Reducing the energy density of multiple meals decreases the energy intake of preschool-age children. Am J Clin Nutr. 2008;88:1459–68. [DOI] [PubMed] [Google Scholar]
- 24. Spill MK, Birch LL, Roe LS, Rolls BJ. Hiding vegetables to reduce energy density: an effective strategy to increase children's vegetable intake and reduce energy intake. Am J Clin Nutr. 2011;94:735–41. [DOI] [PMC free article] [PubMed] [Google Scholar]
- 25. USDA Food and Nutrition Service. Child and adult care food program (CACFP). Version current: 29 March 2017 [Internet]. Available from: https://fns-prod.azureedge.net/cacfp/child-and-adult-care-food-program. [Google Scholar]
- 26. USDA Agricultural Research Service, Nutrient Data Laboratory. USDA National Nutrient Database for Standard Reference. Release 28. Version Current: April 2018 [Internet]. Available from: https://ndb.nal.usda.gov/ndb/. [Google Scholar]
- 27. Butte NF, Wong WW, Lee JS, Adolph AL, Puyau MR, Zakeri IF. Prediction of energy expenditure and physical activity in preschoolers. Med Sci Sports Exerc. 2014;46(6):1216–26. [DOI] [PMC free article] [PubMed] [Google Scholar]
- 28. US Department of Health and Human Services, Centers for Disease Control and Prevention. A SAS program for the 2000 CDC growth charts (ages 0 to < 20 y). Version current: 16 December 2016 [Internet]. Available from: http://www.cdc.gov/nccdphp/dnpao/growthcharts/resources/sas.htm. [Google Scholar]
- 29. Wardle J, Guthrie CA, Sanderson S, Rapoport L. Development of the Children's Eating Behavior Questionnaire. J Child Psychol Psychiatry. 2001;42:963–70. [DOI] [PubMed] [Google Scholar]
- 30. Carnell S, Wardle J. Measuring behavioral susceptibility to obesity: validation of the child eating behaviour questionnaire. Appetite. 2007;48(1):104–13. [DOI] [PubMed] [Google Scholar]
- 31. Birch LL, Fisher JO, Grimm-Thomas K, Markey CN, Sawyer R, Johnson SL. Confirmatory factor analysis of the Child Feeding Questionnaire: a measure of parental attitudes, beliefs and practices about child feeding and obesity proneness. Appetite. 2001;36:201–10. [DOI] [PubMed] [Google Scholar]
- 32. Hughes SO, Power TG, Orlet Fisher J, Mueller S, Nicklas TA. Revisiting a neglected construct: parenting styles in a child-feeding construct. Appetite. 2005;44(1):83–92. [DOI] [PubMed] [Google Scholar]
- 33. Ledikwe JH, Blanck HM, Khan LK, Serdula MK, Seymour JD, Tohill BC, Rolls BJ. Dietary energy density determined by eight calculation methods in a nationally representative United States population. J Nutr. 2005;135:273–8. [DOI] [PubMed] [Google Scholar]
- 34. Benjamini Y, Hochberg Y. Controlling the false discovery rate: a practical and powerful approach to multiple testing. J R Stat Soc Series B Stat Methodol. 1995; 57:289–300. [Google Scholar]
- 35. Davis CM. Self selection of diet by newly weaned infants: an experimental study. Am J Dis Child. 1928;36:651–79. [Google Scholar]
- 36. Nielsen SB, Montgomery C, Kelly LA, Jackson DM, Reilly JJ. Energy intake variability in free-living young children. Arch Dis Child. 2008;93:971–3. [DOI] [PubMed] [Google Scholar]
- 37. Hanley JA, Hutcheon JA. Does children's energy intake at one meal influence their intake at subsequent meals? Or do we just think it does?. Paediatr Perinat Epidemiol. 2010; 24:241–8. [DOI] [PubMed] [Google Scholar]
- 38. English L, Lasschuijt M, Keller KL. Mechanisms of the portion size effect. What is known and where do we go from here?. Appetite. 2015, 39–49. [DOI] [PubMed] [Google Scholar]
- 39. Keller KL, English LK, Fearnbach SN, Lasschuijt M, Anderson K, Bermudez M, Fisher JO, Rolls BJ, Wilson SJ. Brain response to food cues varying in portion size is associated with individual differences in the portion size effect in children. Appetite. 2018;125:139–51. [DOI] [PMC free article] [PubMed] [Google Scholar]
- 40. Robinson E, Kersbergen I. Portion size and later food intake: evidence on the “normalizing” effect of reducing portion sizes. Am J Clin Nutr. 2018;107(7):640–6. [DOI] [PubMed] [Google Scholar]
- 41. Rolls BJ, Roe LS, Meengs JS. Larger portions sizes lead to a sustained increase in energy intake over 2 days. J Am Diet Assoc. 2006;106:543–9. [DOI] [PubMed] [Google Scholar]
- 42. Rolls BJ, Roe LS, Meengs JS. Reductions in portion size and energy density of foods are additive and lead to sustained decreases in energy intake. Am J Clin Nutr. 2006;83:11–17. [DOI] [PMC free article] [PubMed] [Google Scholar]
- 43. Rolls BJ, Roe LS, Meengs JS. The effect of large portion sizes on energy intake is sustained for 11 days. Obesity. 2007;15:1535–43. [DOI] [PubMed] [Google Scholar]
- 44. Krølner R, Rasmussen M, Brug J, Klepp KI,Wind M, Due P . Determinants of fruit and vegetable consumption among children and adolescents: a review of the literature. Part II: qualitative studies. Int J Behav Nutr Phys Act. 2011;8:112. [DOI] [PMC free article] [PubMed] [Google Scholar]
- 45. Ishdorj A, Capps Jr O, Storey M, Murano PS. Investigating the relationship between food pairings and plate waste from elementary school lunches. Food Nutr Sci. 2015;6(11):1029. [Google Scholar]
- 46. Gibson EL, Wardle J. Energy density predicts preferences for fruit and vegetables in 4-year-old children. Appetite. 2003;41:97–8. [DOI] [PubMed] [Google Scholar]
- 47. Kachurak A, Davey A, Bailey RL, Fisher JO. Daily snacking occasions and weight status among US children aged 1 to 5 years. Obesity. 2018;26(6):1034–42. [DOI] [PMC free article] [PubMed] [Google Scholar]
- 48. Mattes RD. Snacking: a cause for concern. Physiol Behav. 2018;193:279–83. [DOI] [PubMed] [Google Scholar]
- 49. Rudy E, Bauer KW, Hughes SO, O'Conner TM, Vollrath K, Davey A, Correa NEM, Chen TA, Fisher JO. Interrelationships of child appetite, weight, and snacking among Hispanic preschoolers. Pediatr Obes. 2018;13:38–45. [DOI] [PMC free article] [PubMed] [Google Scholar]
- 50. Rolls BJ, Roe LS, Meengs JS. Portion size can be used strategically to increase vegetable consumption in adults. Am J Clin Nutr. 2010;91:913–22. [DOI] [PMC free article] [PubMed] [Google Scholar]
- 51. McConahy KL, Smiciklas-Wright H, Birch LL, Mitchell DC, Picciano MF. Food portions are postively related to energy intake and body weight in early childhood. J Pediatr. 2002;140:340–7. [DOI] [PubMed] [Google Scholar]
- 52. Lioret S, Volatier JL, Lafay L, Touvier M, Maire B. Is food portion size a risk factor of childhood overweight?. Eur J Clin Nutr. 2009;63(3):382–91. [DOI] [PubMed] [Google Scholar]
- 53. Birch LL, Savage JS, Fisher JO. Right sizing prevention. Food portion size effects on children's eating and weight. Appetite. 2015;88:11–16. [DOI] [PubMed] [Google Scholar]
- 54. Kral TVE, Moore RH, Chittams J, Jones E, O'Malley L, Fisher JO. Identifying behavioral phenotypes for childhood obesity. Appetite. 2018;127:87–96. [DOI] [PMC free article] [PubMed] [Google Scholar]
- 55. Carnell S, Wardle J. Appetitive traits and child obesity: measurement, origins, and implications for intervention. Proc Nutr Soc. 2008;67:343–3355. [DOI] [PubMed] [Google Scholar]
- 56. Burrows TL, Martin RJ, Collins CE. A systematic review of the validity of dietary assessment methods in children when compared with the method of doubly labeled water. J Am Diet Assoc. 2010; 110(10):1501–10. [DOI] [PubMed] [Google Scholar]
Associated Data
This section collects any data citations, data availability statements, or supplementary materials included in this article.