

ABSTRACT
Background
Replacing dietary saturated fatty acids (SFAs) with polyunsaturated fatty acids (PUFA) reduces the plasma low-density lipoprotein (LDL) cholesterol and subsequently the risk of cardiovascular disease. However, beyond changes in LDL cholesterol, we lack a complete understanding of the physiologic alterations that occur when improving dietary fat quality.
Objectives
The aim of this study was to gain knowledge of metabolic alterations paralleling improvements in the fat quality of the diet.
Methods
We recently conducted an 8-wk, double-blind, randomized controlled trial replacing SFAs with PUFAs in healthy subjects with moderate hypercholesterolemia (n = 99). In the present substudy, we performed comprehensive metabolic profiling with multiple platforms (both nuclear magnetic resonance- and mass spectrometry-based technology) (n = 99), and analyzed peripheral blood mononuclear cell gene expression (n = 95) by quantitative real-time polymerase chain reaction.
Results
A large number of lipoprotein subclasses, myristoylcarnitine and palmitoylcarnitine, and kynurenine were reduced when SFAs were replaced with PUFAs. In contrast, bile acids, proprotein convertase subtilisin/kexin type 9, acetate, and acetoacetate were increased by the intervention. Some amino acids were also altered by the intervention. The mRNA levels of LXRA and LDLR were increased, in addition to several liver X receptor α target genes and genes involved in inflammation, whereas the mRNA levels of UCP2 and PPARD were decreased in peripheral blood mononuclear cells after replacing SFAs with PUFAs. Partial least squares-discriminant analysis showed that the 30 most important variables that contributed to class separation spanned all classes of biomarkers, and was in accordance with the univariate analysis.
Conclusions
Applying metabolomics in randomized controlled dietary intervention trials has the potential to extend our knowledge of the biological and molecular effects of dietary fat quality. This study was registered at clinicaltrials.gov as NCT 01679496.
Keywords: cardiovascular risk factors, fatty acids, lipoprotein subclasses, metabolic profiling, acylcarnitines, tryptophan, nutrition, gene expression
Introduction
Cardiovascular disease (CVD) remains the major contributor to the global burden of disease (1). CVD is associated with conditions of perturbed energy homeostasis and metabolism. Replacing saturated fatty acids (SFAs) with polyunsaturated fatty acids (PUFAs) has been linked to a reduced risk of CVD (2, 3). In addition, controlled metabolic studies have shown the importance of fat quality on LDL cholesterol (4, 5), and dietary randomized controlled trials (RCTs) have shown that replacing SFAs with PUFAs significantly reduces plasma LDL cholesterol (6–10). It is generally recognized that beyond the well-established associations between CVD and traditional risk factors, such as LDL cholesterol, comprehensive knowledge of metabolic dysregulation in subjects at risk of CVD, or patients with CVD, is still lacking. We recently performed a double-blind, randomized controlled dietary intervention study exchanging similar food items with improved fat quality (replacing SFAs with PUFAs), which led to an 11% reduction in LDL cholesterol and a 9% reduction in total cholesterol in the experimental (Ex-diet) group compared with the control-diet (C-diet) group (10).
Comprehensive metabolic profiling or “metabolomics” has emerged as an important tool to identify novel biomarkers of CVD development (11). Metabolomic techniques assess a large number of metabolites. Variations in the concentrations of these metabolites result from genomic, transcriptomic, and proteomic variability; thus, they provide an integrated and dynamic measure of phenotype. Cohort studies that use metabolomics have identified a large number of metabolites linked to CVD risk (12–15), but more research is needed to identify novel biomarkers in prevention and treatment of CVD. Interestingly, the human metabolome indeed responds to changes in dietary patterns (16–20), but the specific effects of replacing SFAs with PUFAs in the diet on the metabolome remain largely unknown. Integrating metabolomics with dietary RCTs may help us understand the molecular pathophysiologic processes of CVD, define metabolic changes from diet, identify their associations with disease risk, and discover novel biomarkers and targets for intervention.
To further understand the metabolic alterations paralleling improved fat quality of the diet, we performed targeted metabolic profiling of biomarkers shown to be associated with CVD risk. Finally, we analyzed the gene expression level of genes involved in lipid metabolism and inflammation.
Methods
Study design and subjects
We conducted an 8-wk, double-blind, randomized controlled dietary intervention study at the Oslo and Akershus University College of Applied Sciences and the University of Oslo, Norway, from July 2012 until April 2014. The study design and description of participants has been reported in detail previously (10). In short, 701 subjects were assessed for eligibility, 115 were randomly assigned, 100 completed the study, and 99 were analyzed independent of the compliance (Supplemental Figure 1). The participants were healthy adults aged 25–70 y with LDL cholesterol ≥3.5 mmol/L, total cholesterol was within the normal range for each age group, and triglycerides (TGs) were ≤2.6 mmol/L. The participants had stable body weight during the 3 mo (±5%) preceding the start of the study, and a BMI between 20 and 35 kg/m2. In the present analyses, 99 subjects (58% women) were included.
Before the baseline visit, all subjects performed a 2-wk run-in period in which they included the control food items in their daily diet. At baseline, subjects were randomly assigned to 1 of 2 intervention groups (1:1 ratio), stratified by gender and age. The C-diet group continued with the control food items, and the Ex-diet group received experimental food items. The experimental food items were the same type of products as the control, but with a different fat composition [SFAs replaced with mostly n–6 (ω-6) PUFAs]. The food items in the C-diet group or the Ex-diet group were respectively butter-based spread or margarine-based spread, butter or liquid margarine, and olive oil or rapeseed and sunflower oil. In addition, products such as liver paté, cheese, bread, muesli cereals, cream, mayonnaise, and crème fraîche were given to the participants, and some of the SFAs were replaced with rapeseed and sunflower oils in the products in the Ex-diet group. Based on the minimum intake of the food items, the n–6 PUFA content was 4.2 g/d in the control food items and 12.9 g/d in the experimental food items, and the SFA content was 19.2 and 5.7 g/d in the control food items and the experimental food items, respectively. Among the SFAs, the content of palmitic acid was 9.2 g/d in the control food items and 2.7 g/d in the experimental food items, whereas the content of myristic acid was 2.9 and 0.2 g/d in the control food items and experimental food items, respectively. The content of monounsaturated fatty acids in the food items was the same in both groups. Details about the study products are described elsewhere (10). The dietary difference during the intervention was 6.5 energy % (E%) lower intake of SFAs and 6.4 E% higher intake of PUFAs in the Ex-diet group compared with the C-diet group. In addition, the protein intake was 1.5 E% higher, and the fiber intake was 11.5 g/day higher, whereas the carbohydrate intake was 2.4 E% lower in the Ex-diet group than in the C-diet group during the intervention (10). Clinical and blood laboratory assessments were performed at baseline and after 8 wk follow-up.
The study was conducted according to the guidelines laid down in the Declaration of Helsinki. All subjects gave written informed consent, and the Regional Ethics Committee for Medical Research in South East Norway approved the study. The study was registered at clinicaltrials.gov as NCT 01679496.
Blood sampling and standard laboratory analysis
The day before blood sampling, the subjects were told to refrain from alcohol consumption and vigorous physical activity. Venous blood samples were drawn after an overnight fast (≥12 h). Serum was obtained from silica gel tubes (Becton Dickinson Vacutainer Systems) and kept at room temperature for ≤30 min, until centrifugation (1500 × g, 15 min). Plasma was obtained from EDTA tubes (Becton Dickinson Vacutainer), immediately placed on ice, and centrifuged within 10 min (2000 × g, 4°C, 15 min). EDTA tubes with whole blood were kept at room temperature for ≤48 h before counting the total number of lymphocytes and monocytes (Fürst Medical Laboratory). Fasting serum concentrations of high-sensitivity C-reactive protein (hs-CRP), total cholesterol, LDL cholesterol, HDL cholesterol, lipoprotein A, TGs, and glucose were measured by standard methods at a routine laboratory (Fürst Medical Laboratory) as previously described (10).
Biochemical analysis and targeted metabolic profiling
The concentration of proprotein convertase subtilisin/kexin type 9 (PCSK9) was measured in serum by enzyme immunoassays from R&D Systems. Serum bile acid level was measured by colorimetric photometry at the Department for Medical Biochemistry, Oslo University Hospital, Rikshospitalet, Norway. All samples were batch analyzed at the end of the study.
Mass spectrometry-based analyses and microbiological assays
We measured plasma metabolites and related biomarkers at Bevital (www.bevital.no) with the use of several targeted assays (platforms A–H) to quantify concentrations of amino acids and amino acid metabolites, gut flora metabolites, cystatin C variants, B vitamins, folates, fat-soluble vitamins, inflammation markers, and miscellaneous other metabolites (21–27). More specifically, total homocysteine, methylmalonic acid, total cysteine, methionine, serine, glycine, and cystathionine were measured at platform A by gas chromatography tandem mass spectrometry (GC-MS/MS). Histidine, tryptophan, kynurenine, ornithine, aspartic acid, glutamic acid, lysine, alanine, isoleucine, leucine, proline, valine, asparagine, glutamine, threonine, tyrosine, phenylalanine, and α-ketoglutaric acid/oxoglutaric acid were measured at platform B by GC-MS/MS. Choline, betaine, dimethylglycine, creatine, methionine sulfoxide, arginine asymmetric dimethylarginine, symmetric dimethylarginine, homoarginine, trimethyllysine, trimethylamineoxid, creatinine, 1-methylhistidine, and 3-methylhistidine were measured at platform C by liquid chromatography (LC)-MS/MS (LC-MS/MS). Pyridoxal 5′-phosphate, pyridoxal, 4-pyridoxic acid, thiamine, thiamine monophosphate, riboflavin, flavin mononucleotide, neopterin, 3-OH-kynurenine, kynurenic acid, xanthurenic acid, anthranilic acid, 3-OH-anthranilic acid, picolinic acid, quinolinic acid, nicotinamide, N1-methylnicotinamide, and trigonelline were measured at platform D by LC-MS/MS. 5-Methyl-tetrahydrofolate, 4-a-OH-5-methyl-tetrahydrofolate, para-aminobenzoylglutamate, and acetamidobenzoylglutamate were measured at platform E by LC-MS/MS. All-trans retinol, 25-OH-vitamin D3, α-tocopherol, γ-tocopherol, and phylloquinone were measured on platform H by LC-MS/MS. Cystatin C and variants were measured at platform G by matrix-assisted laser desorption/ionization time-of-flight MS, and cobalamine was measured at platform F through the use of microbiological assay.
Additionally, free carnitine, short-, medium-, and long-chain acylcarnitines, and the precursors for carnitine, trimethyllysine, and butyrobetaine, were analyzed in plasma by LC-MS/MS (28). All samples were batch analyzed at the end of the study.
Nuclear magnetic resonance spectroscopy-based analyses
Metabolic biomarkers were quantified from EDTA plasma with the use of a commercial high-throughput nuclear magnetic resonance (NMR) spectroscopy platform (Nightingale, https://nightingalehealth.com). This method quantifies 14 subclasses of lipoprotein particles, particle sizes, and apolipoproteins, as well as various fractions of cholesterol, TGs, phospholipids, albumin, 3-hydroxybutyrate, acetate, acetoacetate, lactate and citrate, and glycoprotein acetyls. Details of the performance of the NMR metabolomics platform have been described previously (29). All samples were batch analyzed at the end of the study.
Peripheral blood mononuclear cell isolation
After blood collection, peripheral blood mononuclear cells (PBMCs) were isolated with the use of BD Becton Dickinson Vacutainer Cell Preparation tubes according to the manufacturer's instructions and stored as pellets at −80°C until further analysis. This is a well-documented and standardized method to collect mononuclear cells with high purity (>90%), and, according to the manufacturer, ∼80% of the cells are lymphocytes and 12% are monocytes.
RNA isolation, cDNA synthesis and quantitative real-time polymerase chain reaction
Total RNA was isolated with the use of an RNeasy Mini Kit according to the manufacturer's instructions (Qiagen), RNA quantity measurements were performed with a Nanodrop ND-1000 spectrophotometer (Thermo Fisher Scientific), and the RNA integrity number (RIN) value was measured with an Agilent 2100 Bioanalyzer (Agilent Technologies) to check the RNA quality. Only samples with RIN values of 8–10 were used for the gene expression analysis. RNA from all samples was reverse transcribed by a high-capacity cDNA reverse transcription kit (Applied Biosystems). For quantitative real-time polymerase chain reaction, we used TaqMan Array Micro Fluidic Cards (Applied Biosystems) on an ABI PRISM 7900HT (Applied Biosystems). TATA box binding protein (TBP) and glucuronidase β (GUSB) were used as endogenous controls for normalization of cDNA amount in ExpressionSuite version 1.0.2 (= ∆Ct). The relative mRNA level for each transcript was calculated by the ΔΔ cycle threshold method (30).
Statistical analysis
This study was designed based on the primary outcome of the study, which was LDL cholesterol concentration (10). Power calculations estimated that 180 subjects (including a 20% drop-out rate) were required to obtain 80% power with a type I error of 5% to detect a difference between the 2 groups of 8% in LDL cholesterol concentration at the end of the study. Post-hoc analyses showed that the number of subjects recruited gave sufficient power with the observed 10% change in LDL cholesterol between the groups (n = 47 subjects in each group). Prespecified secondary outcomes were other lipids, inflammatory markers, metabolomics, and transcriptomics.
Statistical analyses were performed in R version 3.5.0 with RStudio IDE (31) (www.rstudio.com). In the following description, R package name, function name, and relevant setting are stated in parentheses, e.g. (package::function, setting = 123). Where appropriate, we present data as mean and SD or median and 25th–75th percentile (IQR) for continuous variables, or as counts and percentage for categoric variables. For a full overview of numeric data for all outcome variables, see Supplemental Table 1.
Univariate analyses
For standard clinical and biochemical measurements in Table 1, independent-samples t tests were used to assess changes between groups when the data were normally distributed, and the MannWhitney U test was used to assess changes between groups when the data were not normally distributed for continuous variables. We then constructed linear regression models fitted for each of the 173 outcome variables, based on the use of group affiliation (dichotomous variable) as the main exposure (stats::lm). In the analyses presented in Figures 1–3, we adjusted for age, gender, intervention-related weight change, and baseline value. In sensitivity analyses, we examined both crude estimates and estimates not adjusted for baseline value (Supplemental Table 1). We normalized (centered to mean = 0, and scaled SD = 1) all measures to aid comparison of magnitudes and to improve visualization of the results (base::scale). The gene expression data was log2 transformed before normalization. In Supplemental Figures 2–4 we show analyses from baseline to the end of the study (within groups).
TABLE 1.
Baseline characteristics and changes in clinical and standard biochemical measurements after the 8-wk intervention1
| C-diet group (n = 52) | Ex-diet group (n = 47) | ||||
|---|---|---|---|---|---|
| Baseline | Change | Baseline | Change | P | |
| Clinical measurements | |||||
| Age, y | 55.2 ± 9.8 | — | 53.6 ± 9.7 | — | |
| Gender: female, n (%) | 31 (59.6) | — | 27 (57.4) | — | |
| Smokers, n (%) | 9 (17.3) | — | 4 (8.5) | — | |
| Weight, kg | 74.1 ± 13.1 | 0.4 ± 1.1 | 75.7 ± 12.7 | 0 ± 1.1 | 0.044 |
| BMI, kg/m2 | 24.6 ± 3 | 0.1 ± 0.3 | 25.4 ± 2.9 | 0 ± 0.4 | 0.043 |
| Biochemical measurements | |||||
| Total cholesterol, mmol/L | 6.6 ± 0.8 | 0 ± 0.5 | 6.6 ± 0.8 | −0.5 ± 0.6 | <0.001 |
| LDL cholesterol, mmol/L | 4.1 ± 0.6 | 0 ± 0.5 | 4.2 ± 0.6 | −0.4 ± 0.5 | <0001 |
| HDL cholesterol, mmol/L | 1.7 ± 0.4 | 0 ± 0.2 | 1.7 ± 0.5 | −0.1 ± 0.1 | 0.005 |
| TG, mmol/L | 1.2 (0.5) | 0.1 (0.3) | 1.3 (0.7) | 0 (0.5) | 0.002 |
| Lipoprotein (a), mg/dL | 180.5 (365.2) | 0 (21) | 115.5 (461) | 0.5 (20.8) | 0.95 |
| Glucose, mmol/L | 5.2 (0.5) | −0.1 (0.4) | 5.3 (0.5) | 0 (0.4) | 0.37 |
| hs-CRP, mg/L | 1.0 (1.4) | 0.1 (1.6) | 1.2 (1.6) | −0.1 (0.9) | 0.24 |
Data are shown as mean ± SD or median (IQR). P, between-group changes: independent t test or Mann-Whitney U test. C-diet group, control diet group; Ex-diet group, experimental diet group; hs-CRP: high-sensitivity C-reactive protein; TG, triglyceride.
FIGURE 1.
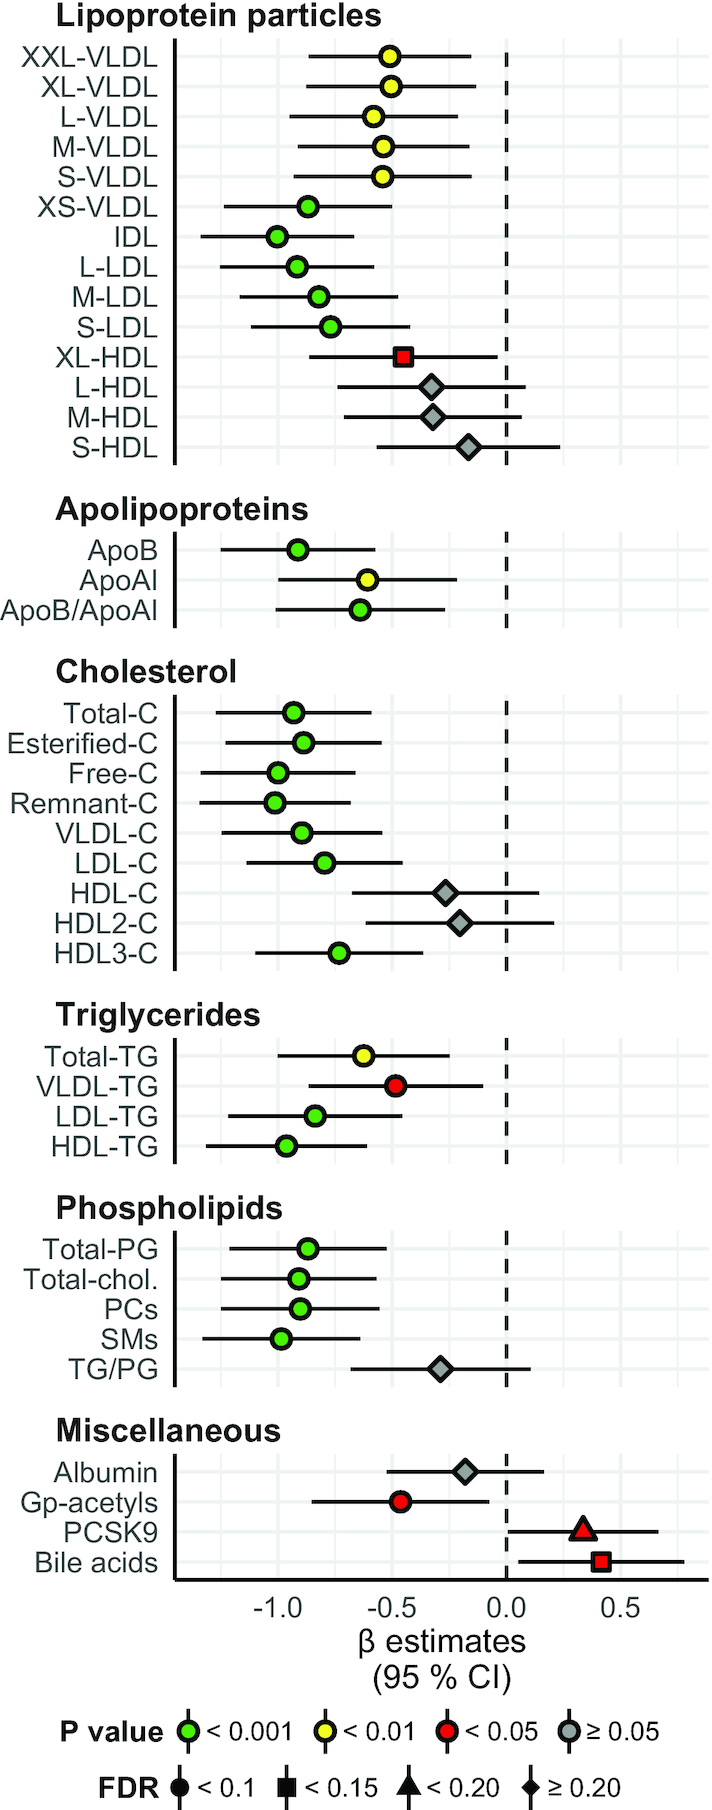
Lipid particles, lipid species, bile acids, and other miscellaneous proteins: between-group differences in change from baseline to the end of the study. Concentration of lipoprotein particles, apolipoproteins, cholesterol, triglycerides, phospholipids, and miscellaneous factors in the Ex-diet group (symbols, n = 47) compared with the C-diet group (black dashed line, n = 52). Estimates on the right and left side of the zero line indicate an increase and decrease, respectively, in the Ex-diet group, compared with the C-diet group. Colors denote P value significance level, and shapes denote FDR q values, as indicated in the figure legend. The data are normalized (centered to mean = 0; scaled to SD = 1), adjusted for age, gender, intervention-related weight change, and baseline value, and presented as linear regression β coefficients. Error bars are 95% CIs for the estimates. Numeric data corresponding to this figure can be found in Supplemental Table 1; this includes the units of the variables and the number of nonmissing values per variable. Apo, apolipoprotein; C, cholesterol; Chol, choline; FDR, false discovery rate; Gp-acetyl, glycoprotein acetyl (mainly a1-acid glycoprotein); IDL, intermediate-density lipoprotein; L, large; M, medium; PC, phosphatidylcholine and other cholines; PCSK9, proprotein convertase subtilisin/kexin type 9; PG, phosphoglyceride; S, small; SM, sphingomyelin; TG, triglyceride; XL, very large; XS, very small; XXL, extremely large.
FIGURE 3.
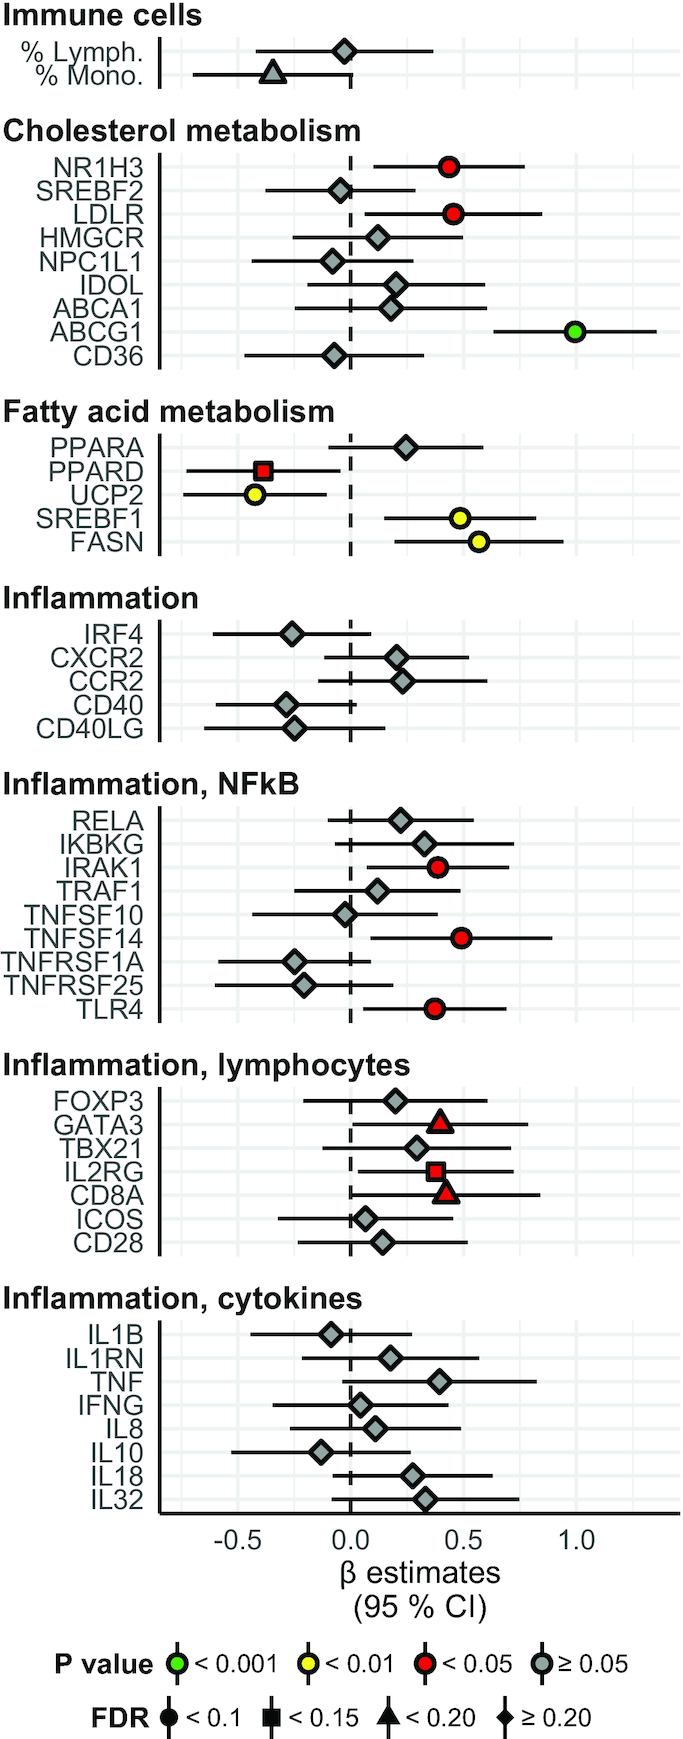
Gene expression: between-group differences in change from baseline to the end of the study. Fold change in genes involved in cholesterol and fatty acid metabolism and inflammation, and percentage level of immune cells in blood. Overall the interpretation is as in Figure 1. Numeric data corresponding to this figure can be found in Supplemental Table 1; this includes the units of the variables and the number of nonmissing values per variable. ABCA1, ATP-binding cassette transporter A1; ABCG1, ATP-binding cassette transporter G1; CCR2, C-C chemokine receptor type 2; CD28, cluster of differentiation 28; CD36, cluster of differentiation 36; CD40, cluster of differentiation 40; CD40LG, CD40 ligand; CD8A, cluster of differentiation 8A; CXCR2, C-X-C motif chemokine receptor 2; FASN, fatty acid synthase; FOXP3, forkhead box P3; GATA3, GATA binding protein 3; HMGCR, HMG-CoA reductase (3-hydroxy-3-methyl-glutaryl-coenzyme A reductase); ICOS, inducible T-cell costimulator; IDOL, increased degradation of LDL receptor protein; IFNG, interferon γ; IKBKG, inhibitor of nuclear factor κB kinase subunit γ; IL1B, interleukin 1β; IL1RN, interleukin 1 receptor antagonist; IL2RG, interleukin-2 receptor subunit gamma; IRAK1, interleukin-1 receptor–associated kinase 1; IRF4, interferon regulatory factor 4; LDLR, low-density lipoprotein receptor; NPC1L1, Niemann-Pick C1-Like 1; NR1H3, nuclear receptor subfamily 1 group H member 3; PPARA, peroxisome proliferator–activated receptor α; PPARD, peroxisome proliferator–activated receptor δ; RELA, nuclear factor κB p65 subunit; SREBF1, sterol regulatory element–binding protein 1; SREBF2, sterol regulatory element–binding protein 2; TBX21, T-box transcription factor; TLR4, toll-like receptor 4; TNF, tumor necrosis factor; TNFSF10, tumor necrosis factor (ligand) superfamily, member 10; TNFSF14, tumor necrosis factor (ligand) superfamily, member 14; TNFRSF1A, tumor necrosis factor receptor superfamily member 1A; TNFRSF25, tumor necrosis factor receptor superfamily member 25; TRAF1, TNF receptor–associated factor 1; UCP2, mitochondrial uncoupling protein 2.
The nominal significance (α) level was set to 0.05. However, to adjust for the large number of tests, we calculated the false discovery rate (FDR) (stats::p.adjust, method = “fdr”), which offers a BenjaminiHochberg adjustment of a list of P values. This method corresponds to a tail area–based FDR (or q value), and can be interpreted in the usual frequentist way, just like the regular P value. We set the FDR significance level to 0.2 due to the explorative nature of the study.
Multivariate analyses
In multivariate analyses, hierarchic clustering and partial least squares-discriminant analysis (PLS-DA) were performed. Input data for these analyses were changes in all 173 variables reported in the manuscript (from baseline to the end of the study, for both study groups). Clustering was used to find similarities and dissimilarities between groups of variables in an unsupervised manner. We calculated the Spearman correlation matrix (stats::cor, use = “pairwise.complete.obs”), and the Euclidean distance of this correlation matrix (stats::dist, method = “euclidean”), and performed hierarchic clustering of this distance object (stats::hclust, method = “complete”). After visualizing and cutting the tree with different values of both height (h) and numbers of clusters (k), we decided to cut the tree into 10 clusters (stats::cutree, k = 10).
PLS-DA was used for supervised dimension reduction and classification, and to compare the results from univariate analyses and clustering. The data were split into training and test sets. To prevent class imbalances in doing this, we stratified on study group (caret::createDataPartition). In order to maintain a relatively large and reliable test set, the data were split into training and testing in a 60:40 ratio. All model training and validation was performed on the training set, whereas the test set was only used once (with the same settings for preprocessing, such as imputation, centering, and scaling). PLS-DA analysis was performed with the use of the default orthogonal scores algorithm (nonlinear iterative partial least squares, NIPALS). For these analyses, we used the train function and associated helper functions (trainControl, twoClassSummary, and preProc) implemented in the caret package in R (caret::train, method = “pls”). We evaluated between 1 and 15 PLS components with the use of repeated 10-fold cross-validation (3 repeats). To evaluate the performance of each model, we used the area under the receiver operating characteristic (ROC) curve. We preprocessed the training data by median imputation, centering, and scaling. A final PLS-DA model was fitted to the whole training set based on the use of 3 components (area under the ROC curve = 0.92), and this model was further used to predict samples in the test set (stats::predict). To obtain the class probabilities, the default softmax algorithm was used. In addition, we acquired the confusion matrix and various overall statistics and class statistics (caret::confusionMatrix).
ROC curves of the final prediction model (plotROC::geom_roc) and of the acquired variable importance (caret::varImp) were generated, the latter of which is related to the contribution of variable coefficients to reducing the sum of squares across PLS components. Finally, biplots comparing PLS dimensions 1 and 2, and 1 and 3 were created.
Results
For the metabolite analyses, we included data from all 99 participants (47 in the Ex-diet group and 52 in the C-diet group) who were analyzed in the previously reported RCT (10). For the gene expression analysis, samples from 95 participants were available (45 in the Ex-diet group and 50 in the C-diet group) because the RIN value was <8 in 2 samples, and 2 samples were lost due to technical error (Supplemental Figure 1). Baseline characteristics of the 99 participants and the changes during the intervention of lipids and weight are shown in Table 1.
Quantitative metabolic profiling
Using multiple metabolomics platforms, we measured in total 129 unique features (Figures 1 and 2). The figures display the normalized differences in change from baseline to end of study between the Ex-diet group and the C-diet group (β coefficients ± 95% CI). Estimates on the right or left side of the zero-line indicate an increase or decrease in the Ex-diet group, respectively, compared with the C-diet group. The absolute concentrations before and after intervention in both groups are shown in Supplemental Table 1.
FIGURE 2.

Metabolites and biomarkers: between-group differences in change from baseline to the end of the study. Concentration of acylcarnitines, carnitine, and choline-related metabolites, cystatin C biomarkers, fat-soluble vitamins, folate and B-12–related metabolites, vitamin B–related metabolites, amino acids, kynurenine and neopterin-related metabolites, and energy metabolites. Overall, the interpretation is as in Figure 1. Numeric data corresponding to this figure can be found in Supplemental Table 1; this includes the units of the variables and the number of nonmissing values per variable. a, alpha; ADMA, asymmetric dimethylarginine; b, benzoyl; Carn, carnitine; Cys, cystatin; desS/desSSP/3Pro/CnCt, various cystatin C isoforms; FMN, flavin mononucleotide; g, gamma; Glu, glutamate; Kyn, kynurenine; m, methyl; mNAM, N1-methylnicotinamide; NAM, nicotinamide; p, phosphate; SDMA, symmetric dimethylarginine; THF, tetrahydrofolate; TMAO, trimethylamine N-oxide; Trp, tryptophan; vit, vitamin.
The fasting concentrations of atherogenic lipoprotein particles, including LDL, intermediate-density lipoprotein (IDL), and all the VLDL particles were reduced in the Ex-diet group compared with the C-diet group following intervention (P < 0.001 for large [L]-, medium [M]-, and small [S]-LDL, IDL, and very-small [XS]-VLDL; P < 0.01 for other VLDL particles; q < 0.1 for all) (Figure 1). All HDL particles were reduced in the Ex-diet group, but only very-large (XL)-HDL particles were reduced significantly (P < 0.05; q < 0.1).
As expected, the serum total cholesterol, esterified cholesterol, free cholesterol, and remnant cholesterol were all reduced in the Ex-diet group compared with the C-diet group after intervention (P < 0.001 and q < 0.1 for all). Similarly, serum total cholesterol in VLDL, LDL, and HDL3 were reduced (P < 0.001 and q < 0.1 for all). In addition, the serum total TGs, and serum total TGs in VLDL, LDL, and HDL were reduced in the Ex-diet group compared with the C-diet group (P < 0.001 for LDL-TG and HDL-TG; P < 0.01 for total TG; P < 0.05 for VLDL-TG; q < 0.1 for all). Phospholipids, such as total phosphoglycerides (PGs), total cholines, phosphatidylcholines, and sphingomyelins, were also reduced (P < 0.001 and q < 0.1 for all). The concentration of glycoprotein acetyls, which reflects the amount of N-acetyl groups in circulating glycoproteins involved in acute-phase inflammatory responses, was reduced in the Ex-diet group during the intervention, whereas the concentration of PCSK9 and bile acids increased (P < 0.05 for all; q < 0.1 for glycoprotein acetyls and bile acids; q < 0.15 for PCSK9).
The fasting concentrations of palmitoylcarnitine and myristoylcarnitine were reduced in the Ex-diet group compared with the C-diet group after intervention (P < 0.001 and q < 0.1 for both) (Figure 2). Interestingly, no other acylcarnitines, total carnitine, or carnitine metabolites, including betaine, choline, and the gut flora metabolite trimethylamine N-oxide (TMAO), were altered after the intervention (Figure 2). No differences between groups were also observed for cystatin C and other cystatin C–related biomarkers, fat-soluble vitamins, folate, and vitamin B-12 metabolites (Figure 2). Among other vitamin B and vitamin B–related metabolites (32), thiamine was increased in the Ex-diet group compared with the C-diet group (P < 0.05 and q < 0.15) (Figure 2). Among the amino acids, serine, asparagine, proline, and the amino acid metabolite cystathionine were increased in the Ex-diet group compared with the C-diet group at the end of intervention (P < 0.05 for all; q < 0.1 for asparagine and cystathionine; q < 0.15 for serine and proline), whereas cysteine and kynurenine were reduced (P < 0.05 for both; q < 0.15 for cysteine; q < 0.1 for kynurenine) (Figure 2). Acetate and acetoacetate were increased in the Ex-diet group compared with the C-diet group after intervention (P < 0.05 for acetate and P < 0.01 for acetoacetate; q < 0.1 for both) (Figure 2).
PBMC gene expression
We measured gene expression in PBMCs, focusing on genes involved in lipid metabolism and inflammation, and a total of 44 mRNA transcripts were analyzed (Figure 3; interpretation as for Figures 1 and 2). The relative mRNA levels after normalizing for housekeeping genes before and after intervention in both groups are shown in Supplemental Table 1.
The mRNA levels of nuclear receptor subfamily 1 group H member 3 [NR1H3, also called LXRA (liver X receptor α)], LDL receptor (LDLR), ATP-binding cassette transporter G1 (ABCG), sterol regulatory element binding transcription factor 1 (SREBF1), and fatty acid synthase (FASN) were upregulated in the Ex-diet group compared with the C-diet group (P < 0.05 for NR1H3 and LDLR; P < 0.001 for ABCG1; P < 0.01 for FASN and SREBF1; q < 0.1 for all), whereas the mRNA levels of uncoupling protein 2 (UCP2) and peroxisome proliferator-activated receptor δ (PPARD) were downregulated (P < 0.01 for UCP2; P < 0.05 for PPARD; q < 0.1 for both) (Figure 3). The mRNA levels of the inflammatory genes IL-1 receptor–associated kinase 1 (IRAK1), tumor necrosis factor (ligand) superfamily, member 14 (TNFSF14), toll-like receptor 4 (TLR4), GATA binding protein 3 (GATA3), IL-2 receptor subunit γ (IL2RG), and cluster of differentiation 8A (CD8A) were upregulated in the Ex-diet group compared with the C-diet group (P < 0.05 for all; q < 0.1 for IRAK1, TNFSF14, TRL4, and IL2RG; q < 0.15 for GATA3 and CD8A) (Figure 3).
Multivariate analyses
To strengthen the univariate results, we also performed multivariate analyses. First, we used clustering to find similarities and dissimilarities between groups of variables in an unsupervised manner. Among the 10 clusters, we found 1 cluster of 3 variables and 1 of 4 variables, whereas the 8 remaining clusters comprised between 14 and 25 variables (Figure 4).
FIGURE 4.

Cluster dendrogram. Clustering of all 173 variables displayed in Figures 1–3. We calculated Spearman's correlation and Euclidean distance, and performed hierarchic clustering (complete linkage). The resulting cluster dendrogram was cut into 10 clusters, and both tree branches and labels were colored according to cluster affiliation. Abbreviations as in Figures 1–3.
Next, we used PLS-DA for supervised dimension reduction and classification. The final model utilized 3 components, and had an area under the ROC curve of 0.92 (data not shown), which indicates good predictive ability. This is supported by the PLS-DA biplots, showing clear separation of the study groups (Supplemental Figure5A, B). Interestingly, the 30 most important variables that contributed to class separation spanned all classes of biomarkers: lipids (sphingomyelin, HDL3-C, apolioprotein B, HDL-TG, remnant cholesterol, XS-VLDL, VLDL cholesterol, S-LDL, free cholesterol, M-LDL, S-VLDL), metabolites (cystathionine, palmitoylcarnitine, glycine, kynurenine, acetoacetate, bile acids, α-tocopherol, aspartic acid, asparagine), and gene expression (NR1H3, IRAK1, CXCR2, ABCG1, IL18, TNFSF14, IRF4, TNFRSF25, TBX21, FASN) (Figure 5 ), which supports and strengthens the results from the univariate analyses.
FIGURE 5.
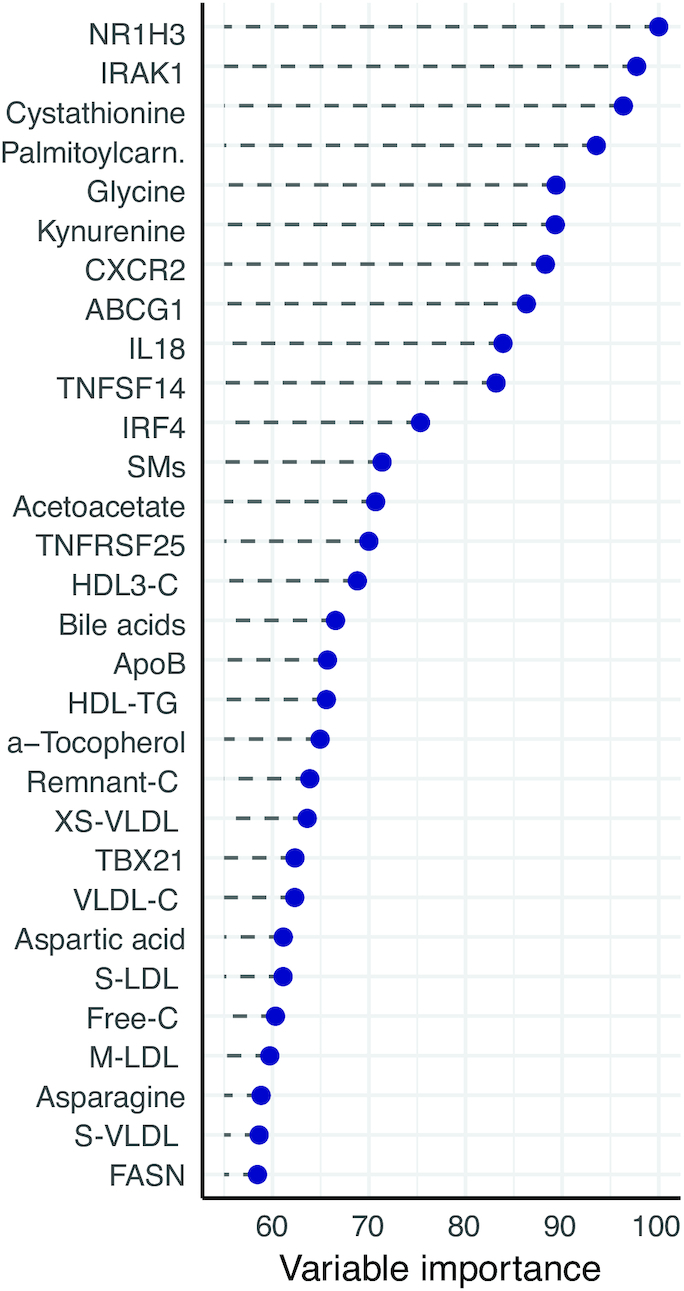
Variable importance. Estimated variable importance of the top 30 highest-ranked variables, determined from a partial least-squares discriminant analysis (PLS-DA) model. These variables are the most likely to contribute to the discriminatory ability of the PLS-DA model. All 173 variables have variable importance between 0 and 100. For elaborate description of the model, see Methods. Abbreviations as in Figures 1–3.
Discussion
In this randomized controlled dietary intervention study among individuals with moderate hypercholesterolemia, lipoprotein concentrations of the atherogenic particles were reduced after replacing SFAs with PUFAs. In addition, PCSK9, bile acids, and 11 low-molecular-weight metabolites, many of which are associated with CVD risk, were favorably altered in the Ex-diet group compared with the C-diet group. In PBMCs, the mRNA level of several genes involved in lipogenesis, cholesterol metabolism, β-oxidation, and inflammation were changed during the intervention (Figure 6).
FIGURE 6.

Graphical summary. Hypothetic physiologic changes that occur when replacing SFAs with PUFAs diet, as outlined in the Discussion. Annotations: bold grey, no difference; plain grey (nonbold), not measured; bold blue, increased/higher; bold red, reduced/lower; italics: gene names. Possible sequence of events: replacing SFAs with PUFAs changes the expression of LDLR, possibly via SREBP2 or other regulatory mechanisms. Higher expression of LDLR causes a higher hepatic uptake of apoB-containing lipoproteins, which reduces plasma lipoprotein subclasses, both apoB- and apoAI-containing types. This effect may be partially offset by higher expression of PCSK9. In PBMCs, controlled LXR activation may drive an increase in reverse cholesterol transport, which includes synthesis of fatty acids for efflux or to esterify free cholesterol to cholesteryl esters; normally, this would also correspond to an inhibition of β oxidation and modulation of inflammation-related gene expression. Higher hepatic cholesterol uptake both inhibits cholesterol synthesis, and activates cholesterol efflux to the gut. Cholesterol-derived oxysterols activate LXR, which activates the bile salt production. Other bile constituents are also produced, particularly from cysteine and other amino acids. Hepatic acetyl-CoA likely adjusts to a lower need for cholesterol synthesis, and directs energy surplus to production of primary ketone bodies. In addition, lower SFA influx requires less immediate neutralization via the β oxidation pathway, which could be reflected in lower hepatic oxidative stress. Abbreviations as in Figures 1–3.
The lipoprotein particle concentrations of the most atherogenic particles were reduced in the Ex-diet group compared with the C-diet group (12). Few other dietary intervention studies have performed similar comprehensive profiling of candidate metabolites known to be associated with CVD risk. Measured by quantitative NMR metabolomics in the FINRISK cohort study, all VLDL, IDL, and LDL subclasses were associated with higher risk of future cardiovascular events, whereas the L- and M-HDL subclasses were associated with lower risk (12). Although the concentrations of all HDL subclasses were reduced, only the XL-HDL particle concentration was significantly reduced during the present intervention study. Thus, replacing SFAs with PUFAs has a net cardioprotective effect in terms of plasma lipoprotein levels.
The finding that palmitoylcarnitine and myristoylcarnitine were reduced in the Ex-diet group compared with the C-diet group supports a beneficial dietary effect of replacing SFAs with PUFAs. Acylcarnitines are important intermediary components of energy and fatty acid metabolism, and recent epidemiologic studies suggest they may be biomarkers of CVD risk in obese and diabetes patients (33). Even-chained acylcarnitines are associated with increased risk of diabetes and mortality in patients with established coronary heart disease (13, 34). Acylcarnitines are also associated with major cardiovascular events among the elderly (35), as well as mortality and myocardial infarction (36).
We observed an increase in fasting plasma concentrations of acetoacetate and acetate in the Ex-diet group, which are metabolites involved in ketogenesis and intermediary metabolism. We recently showed that children with familial hypercholesterolemia with higher plasma concentrations of total and LDL cholesterol had significantly lower plasma concentrations of acetoacetate and acetate (37). This may be due to reduced uptake of LDL in the liver (as in familial hypercholesterolemia), creating a temporary cellular cholesterol deficiency in the hepatocytes, potentially leading to the utilization of acetate and other carbon sources for cholesterol synthesis rather than production of acetoacetate. Another possible explanation of the increased plasma levels of acetate is that this short-chain fatty acid is produced by gut microbial fermentation, since fiber intake increased in the Ex-diet group (38, 39). In addition, the gut microbiota may change due to changes in fat intake because different fatty acids in serum have been shown to be associated with different microbiota taxa (40).
We observed a reduction in the concentration of kynurenine. In epidemiologic studies, increased kynurenine and 3-hydroxykynurenine are associated with risk of acute coronary events in the elderly (41). In addition, increased plasma kynurenines predict the risk of acute myocardial infarction in patients with suspected stable angina pectoris, in particular among subjects with impaired glucose homeostasis (42).
Neopterin, a marker of interferon γ (IFN-γ) activation, was not altered. This result is in line with our previous finding that the serum concentration of IFN-γ was not changed after replacing SFAs with PUFAs (10). We observed a reduction in glycoprotein acetyls, whereas expression levels of some proinflammatory genes were increased in the Ex-diet group, which may indicate a minor modulatory effect of n–6 PUFAs. The clinical relevance of this needs to be further investigated.
We found that certain amino acids changed during the intervention. First, cystathionine increased in the Ex-diet group. Cystathionine is produced from homocysteine, and the first enzyme in the trans-sulfuration pathway is cystathionine β-synthase (CBS), which is a vitamin D receptor target gene (43). Because bile acids have been shown to activate the vitamin D receptor (44), we speculate that an increased concentration of bile acids may induce the expression of CBS mRNA, mediating the increase in cystathionine levels. Furthermore, the increases in thiamine may be due to the higher fiber intake in the Ex-diet group than in the C-diet group (10). The clinical importance of these findings is at present unknown, but they may have potential as objective biomarkers of dietary habits.
The mRNA level of LDLR was upregulated in the Ex-diet group compared with the C-diet group. As PBMCs have been suggested as a model system reflecting nutrition-related metabolic changes (45), we speculate that an increase in PBMC gene expression reflects hepatic mRNA expression of LDLR. It has been shown in animals that PUFAs upregulate the LDLR protein and mRNA levels (46–48), and SFAs decrease LDLR activity, and protein and mRNA abundance (46, 47), and alter LDL composition and size (49). Interestingly, the serum concentration of PCSK9 was increased, and PCSK9 is regulated by SREBP similar to LDLR (50, 51). The depletion of intracellular cholesterol concentrations, which leads to the simultaneous upregulation of both LDLR and PCSK9 expression, is a paradox observed by others (52, 53). The LXRA mRNA level was upregulated in the Ex-diet group, and was the most important variable explaining the variance in the multivariate analysis. LXRα serves as a lipid sensor, and regulates the transcription of genes involved in intracellular cholesterol homeostasis and de novo lipogenesis (54). In the present study, both the mRNA levels of SREBF1 and FASN were upregulated in the Ex-diet group compared with the C-diet group. Normally an increase in cholesterol influx would lead to downregulation of the LDLR via SREBP2. However, the upregulation of the ABCG1 mRNA level may potentially lead to an increased cholesterol efflux. In mice it is well documented that LXRα activation induces 7α-hydroxylase, the rate-limiting enzyme in the metabolic pathway from cholesterol to bile acids in the liver (55). The increased release of bile acids into the circulation is in accordance with previous studies in which a diet rich in PUFAs has been administered (56). The downregulation of UCP2 mRNA level in the Ex-diet group may be due to downregulation of PPARD mRNA level, since UCP2 and other β-oxidation enzymes, including carnitine palmitoyltransferase, have been shown to be activated by PPARD in the presence of palmitic acid (57). We have previously shown that the plasma palmitic acid was reduced in the Ex-diet group (10).
The strength of this study is the relatively high number of subjects and the double-blind, randomized, and controlled study design. The results of the multivariate analyses support and strengthen our results from the univariate analyses. A limitation of the study is that some of the observed effects may have been caused by the increased intake of fiber and protein, and the lower intake of carbohydrate in the Ex-diet group, and therefore not exclusively by the replacement of SFAs with PUFAs. Another limitation was that a small nonsignificant change in the distribution of monocytes was seen between the groups; however, as monocytes only constitute a small fraction of the PBMCs, the clinical relevance remains to be elucidated.
In conclusion, applying metabolic profiling in a randomized controlled dietary intervention trial holds the potential to extend our understanding of the effects of dietary fat on CVD risk.
Supplementary Material
ACKNOWLEDGEMENTS
We thank the NoMa team at the Oslo and Akershus University College of Applied Sciences, Department of Health, Nutrition and Management and at the University of Oslo, Department for Nutrition, Oslo, Norway. We also thank Professor Magne Thoresen at the University of Oslo, Department of Biostatistics, Oslo, Norway for statistical advice. We thank Linda Granlund and Vibeke Telle-Hansen, former employees at Mills, who were involved in the design of the intervention study, and Marthe Gjeitung Byfuglien at Mills for help with the logistics with the food deliveries.
The authors’ responsibilities were as follows: SMU, LFA, and KBH: designed the study; SMU, JJC, LL, IO, LFA, and KBH: conducted the study; SMU, JJC, LL, and KBH: performed the statistical analyses; ON, AS, LL, VL, JLB, PMU, ØM, KM, and AM: performed the laboratory analysis; SMU, JJC, and KBH: wrote the manuscript and had primary responsibility for the final content of the manuscript; and all authors read and approved the final manuscript. SMU has received research grants from TINE BA and Olympic Seafood, none of which are related to the content of this manuscript. KBH has received research grants and/or personal fees from TINE BA, Olympic Seafood, Kaneka, Amgen, Sanofi, and Pronova, none of which are related to the content of this manuscript. SMU and KBH received research grants from Mills DA to partially fund the study; neither own any stocks or serve as advisory board members in the company. LL is employed at Mills DA and does not own stocks in the company. PMU is a member of the steering board of the nonprofit Foundation to Promote Research into Functional Vitamin B12 Deficiency, which owns Bevital, the company that carried out biochemical analyses. The other authors have no conflicts of interest.
Notes
This study was funded by the University of Oslo, Norway, the Throne-Holst Foundation for Nutrition Research, Oslo, Norway, and Mills DA.
Supplemental Figures 1 and 2 and Supplemental Table 1 are available from the “Supplementary data” link in the online posting of the article and from the same link in the online table of contents at https://academic.oup.com/ajcn/.
Abbreviations used: ABCG1, ATP-binding cassette transporter G1; CD8A, cluster of differentiation 8A; C-diet group, control diet group; CBS, cystathionine β-synthase; CVD, cardiovascular disease; CXCR2, C-X-C motif chemokine receptor 2; E%, energy %; Ex-diet group, experimental diet group; FASN, fatty acid synthase; FDR, false discovery rate; GC, gas chromatography; GATA3, GATA binding protein 3; GUSB, glucuronidase β; hs-CRP, high-sensitivity C-reactive protein; IDL, intermediate-density lipoprotein; IL2RG, interleukin-2 receptor subunit γ; IRAK1, interleukin-1 receptor–associated kinase 1; IRF4, interferon regulatory factor 4; L, large; LDLR, LDL receptor; LXRA, liver X receptor α; M, medium; MS, mass spectrometry; NMR, nuclear magnetic resonance; NR1H3, nuclear receptor subfamily 1 group H member 3; LC, liquid chromatography; PBMC, peripheral blood mononuclear cell; PC, phosphatidylcholine; PCSK9, proprotein convertase subtilisin/kexin type 9; PLS-DA, partial least-squares discriminant analysis; PPARD, peroxisome proliferator–activated receptor δ; RCT; randomized controlled trial; RIN, RNA integrity number; ROC, receiver operating characteristic; S, small; SM, sphingomyelin; SREBF, sterol regulatory element binding transcription factor; TBP, TATA box binding protein; TBX21, T-box transcription factor; TLR4, toll-like receptor 4; TMAO, trimethylamine N-oxide; TNFSF; tumor necrosis factor (ligand) superfamily; UCP2, mitochondrial uncoupling protein 2; XL, very large; XS, very small.
References
- 1. Pedersen JI, James PT, Brouwer IA, Clarke R, Elmadfa I, Katan MB, Kris-Etherton PM, Kromhout D, Margetts BM, Mensink RP et al.. The importance of reducing SFA to limit CHD. Br J Nutr. 2011;106(7):961–3. [DOI] [PubMed] [Google Scholar]
- 2. Mozaffarian D, Micha R, Wallace S. Effects on coronary heart disease of increasing polyunsaturated fat in place of saturated fat: a systematic review and meta-analysis of randomized controlled trials. PLoS Med. 2010;7(3):e1000252. [DOI] [PMC free article] [PubMed] [Google Scholar]
- 3. Jakobsen MU, O'Reilly EJ, Heitmann BL, Pereira MA, Balter K, Fraser GE, Goldbourt U, Hallmans G, Knekt P, Liu S et al.. Major types of dietary fat and risk of coronary heart disease: a pooled analysis of 11 cohort studies. Am J Clin Nutr. 2009;89(5):1425–32. [DOI] [PMC free article] [PubMed] [Google Scholar]
- 4. Hegsted DM, Ausman LM, Johnson JA, Dallal GE. Dietary fat and serum lipids: an evaluation of the experimental data. Am J Clin Nutr. 1993;57(6):875–83. [DOI] [PubMed] [Google Scholar]
- 5. Mensink RP, Katan MB. Effect of dietary fatty acids on serum lipids and lipoproteins. A meta-analysis of 27 trials. Arterioscler Thromb. 1992;12(8):911–9. [DOI] [PubMed] [Google Scholar]
- 6. Schwab U, Lauritzen L, Tholstrup T, Haldorssoni T, Riserus U, Uusitupa M, Becker W. Effect of the amount and type of dietary fat on cardiometabolic risk factors and risk of developing type 2 diabetes, cardiovascular diseases, and cancer: a systematic review. Food Nutr Res. 2014;58 doi:10.3402/fnr.v58.25145. [DOI] [PMC free article] [PubMed] [Google Scholar]
- 7. Hu FB, Manson JE, Willett WC. Types of dietary fat and risk of coronary heart disease: a critical review. J Am Coll Nutr. 2001;20(1):5–19. [DOI] [PubMed] [Google Scholar]
- 8. Mensink RP, Zock PL, Kester AD, Katan MB. Effects of dietary fatty acids and carbohydrates on the ratio of serum total to HDL cholesterol and on serum lipids and apolipoproteins: a meta-analysis of 60 controlled trials. Am J Clin Nutr. 2003;77(5):1146–55. [DOI] [PubMed] [Google Scholar]
- 9. Stone NJ, Robinson JG, Lichtenstein AH, Bairey Merz CN, Blum CB, Eckel RH, Goldberg AC, Gordon D, Levy D, Lloyd-Jones DM et al.. 2013 ACC/AHA guideline on the treatment of blood cholesterol to reduce atherosclerotic cardiovascular risk in adults: a report of the American College of Cardiology/American Heart Association Task Force on Practice Guidelines. J Am Coll Cardiol. 2014;63(25 Pt B):2889–934. [DOI] [PubMed] [Google Scholar]
- 10. Ulven SM, Leder L, Elind E, Ottestad I, Christensen JJ, Telle-Hansen VH, Skjetne AJ, Raael E, Sheikh NA, Holck M et al.. Exchanging a few commercial, regularly consumed food items with improved fat quality reduces total cholesterol and LDL-cholesterol: a double-blind, randomised controlled trial. Br J Nutr. 2016;116(8):1383–93. [DOI] [PubMed] [Google Scholar]
- 11. Shah SH, Kraus WE, Newgard CB. Metabolomic profiling for the identification of novel biomarkers and mechanisms related to common cardiovascular diseases: form and function. Circulation. 2012;126(9):1110–20. [DOI] [PMC free article] [PubMed] [Google Scholar]
- 12. Wurtz P, Havulinna AS, Soininen P, Tynkkynen T, Prieto-Merino D, Tillin T, Ghorbani A, Artati A, Wang Q, Tiainen M et al.. Metabolite profiling and cardiovascular event risk: a prospective study of 3 population-based cohorts. Circulation. 2015;131(9):774–85. [DOI] [PMC free article] [PubMed] [Google Scholar]
- 13. Strand E, Pedersen ER, Svingen GF, Olsen T, Bjorndal B, Karlsson T, Dierkes J, Njolstad PR, Mellgren G, Tell GS et al.. Serum acylcarnitines and risk of cardiovascular death and acute myocardial infarction in patients with stable angina pectoris. J Am Heart Assoc. 2017;6(2). doi:10.1161/JAHA.116.e003620. [DOI] [PMC free article] [PubMed] [Google Scholar]
- 14. Zuo H, Ueland PM, Ulvik A, Eussen SJ, Vollset SE, Nygard O, Midttun O, Theofylaktopoulou D, Meyer K, Tell GS. Plasma biomarkers of inflammation, the kynurenine pathway, and risks of all-cause, cancer, and cardiovascular disease mortality: the Hordaland Health Study. Am J Epidemiol. 2016;183(4):249–58. [DOI] [PMC free article] [PubMed] [Google Scholar]
- 15. Ruiz-Canela M, Hruby A, Clish CB, Liang L, Martinez-Gonzalez MA, Hu FB. Comprehensive metabolomic profiling and incident cardiovascular disease: a systematic review. J Am Heart Assoc. 2017;6(10). doi:10.1161/JAHA.117.e005705. [DOI] [PMC free article] [PubMed] [Google Scholar]
- 16. Lankinen M, Schwab U, Kolehmainen M, Paananen J, Nygren H, Seppanen-Laakso T, Poutanen K, Hyotylainen T, Riserus U, Savolainen MJ et al.. A healthy Nordic diet alters the plasma lipidomic profile in adults with features of metabolic syndrome in a multicenter randomized dietary intervention. J Nutr. 2016;146(4):662–72. [DOI] [PubMed] [Google Scholar]
- 17. Lankinen M, Kolehmainen M, Jaaskelainen T, Paananen J, Joukamo L, Kangas AJ, Soininen P, Poutanen K, Mykkanen H, Gylling H et al.. Effects of whole grain, fish and bilberries on serum metabolic profile and lipid transfer protein activities: a randomized trial (Sysdimet). PLoS One. 2014;9(2):e90352. [DOI] [PMC free article] [PubMed] [Google Scholar]
- 18. Guasch-Ferre M, Zheng Y, Ruiz-Canela M, Hruby A, Martinez-Gonzalez MA, Clish CB, Corella D, Estruch R, Ros E, Fito M et al.. Plasma acylcarnitines and risk of cardiovascular disease: effect of Mediterranean diet interventions. Am J Clin Nutr. 2016;103(6):1408–16. [DOI] [PMC free article] [PubMed] [Google Scholar]
- 19. Yu E, Ruiz-Canela M, Guasch-Ferre M, Zheng Y, Toledo E, Clish CB, Salas-Salvado J, Liang L, Wang DD, Corella D et al.. Increases in plasma tryptophan are inversely associated with incident cardiovascular disease in the Prevencion con Dieta Mediterranea (PREDIMED) Study. J Nutr. 2017;147(3):314–22. [DOI] [PMC free article] [PubMed] [Google Scholar]
- 20. Toledo E, Wang DD, Ruiz-Canela M, Clish CB, Razquin C, Zheng Y, Guasch-Ferre M, Hruby A, Corella D, Gomez-Gracia E et al.. Plasma lipidomic profiles and cardiovascular events in a randomized intervention trial with the Mediterranean diet. Am J Clin Nutr. 2017;106(4):973–83. [DOI] [PMC free article] [PubMed] [Google Scholar]
- 21. Midttun O, Hustad S, Ueland PM. Quantitative profiling of biomarkers related to B-vitamin status, tryptophan metabolism and inflammation in human plasma by liquid chromatography/tandem mass spectrometry. Rapid Commun Mass Spectrom. 2009;23(9):1371–9. [DOI] [PubMed] [Google Scholar]
- 22. Midttun O, Kvalheim G, Ueland PM. High-throughput, low-volume, multianalyte quantification of plasma metabolites related to one-carbon metabolism using HPLC-MS/MS. Anal Bioanal Chem. 2013;405(6):2009–17. [DOI] [PubMed] [Google Scholar]
- 23. Midttun O, McCann A, Aarseth O, Krokeide M, Kvalheim G, Meyer K, Ueland PM. Combined measurement of 6 fat-soluble vitamins and 26 water-soluble functional vitamin markers and amino acids in 50 μL of serum or plasma by high-throughput mass spectrometry. Anal Chem. 2016;88(21):10427–36. [DOI] [PubMed] [Google Scholar]
- 24. Midttun O, Ueland PM. Determination of vitamins A, D and E in a small volume of human plasma by a high-throughput method based on liquid chromatography/tandem mass spectrometry. Rapid Commun Mass Spectrom. 2011;25(14):1942–8. [DOI] [PubMed] [Google Scholar]
- 25. Kelleher BP, Broin SD. Microbiological assay for vitamin B12 performed in 96-well microtitre plates. J Clin Pathol. 1991;44(7):592–5. [DOI] [PMC free article] [PubMed] [Google Scholar]
- 26. Hannisdal R, Ueland PM, Svardal A. Liquid chromatography-tandem mass spectrometry analysis of folate and folate catabolites in human serum. Clin Chem. 2009;55(6):1147–54. [DOI] [PubMed] [Google Scholar]
- 27. Meyer K, Ueland PM. Targeted quantification of C-reactive protein and cystatin c and its variants by immuno-MALDI-MS. Anal Chem. 2014;86(12):5807–14. [DOI] [PubMed] [Google Scholar]
- 28. Vernez L, Wenk M, Krahenbuhl S. Determination of carnitine and acylcarnitines in plasma by high-performance liquid chromatography/electrospray ionization ion trap tandem mass spectrometry. Rapid Commun Mass Spectrom. 2004;18(11):1233–8. [DOI] [PubMed] [Google Scholar]
- 29. Soininen P, Kangas AJ, Wurtz P, Suna T, Ala-Korpela M. Quantitative serum nuclear magnetic resonance metabolomics in cardiovascular epidemiology and genetics. Circ Cardiovasc Genet. 2015;8(1):192–206. [DOI] [PubMed] [Google Scholar]
- 30. Livak KJ, Schmittgen TD. Analysis of relative gene expression data using real-time quantitative PCR and the 2(-Delta Delta C(T)) method. Methods. 2001;25(4):402–8. [DOI] [PubMed] [Google Scholar]
- 31. R Core Team. R: a language and environment for statistical computing. [Internet]. Vienna: R Foundation for Statistical Computing; 2017. Available from: https://www.R-project.org/. [Google Scholar]
- 32. McCann A, Midttun O, Whitfield KC, Kroeun H, Borath M, Sophonneary P, Ueland PM, Green TJ. Comparable performance characteristics of plasma thiamine and erythrocyte thiamine diphosphate in response to thiamine fortification in rural Cambodian women. Nutrients. 2017;9(7). doi:10.3390/nu9070676. [DOI] [PMC free article] [PubMed] [Google Scholar]
- 33. Mihalik SJ, Goodpaster BH, Kelley DE, Chace DH, Vockley J, Toledo FG, DeLany JP. Increased levels of plasma acylcarnitines in obesity and type 2 diabetes and identification of a marker of glucolipotoxicity. Obesity. 2010;18(9):1695–700. [DOI] [PMC free article] [PubMed] [Google Scholar]
- 34. Qiu G, Zheng Y, Wang H, Sun J, Ma H, Xiao Y, Li Y, Yuan Y, Yang H, Li X et al.. Plasma metabolomics identified novel metabolites associated with risk of type 2 diabetes in two prospective cohorts of Chinese adults. Int J Epidemiol. 2016;45(5):1507–16. [DOI] [PubMed] [Google Scholar]
- 35. Rizza S, Copetti M, Rossi C, Cianfarani MA, Zucchelli M, Luzi A, Pecchioli C, Porzio O, Di Cola G, Urbani A et al.. Metabolomics signature improves the prediction of cardiovascular events in elderly subjects. Atherosclerosis. 2014;232(2):260–4. [DOI] [PubMed] [Google Scholar]
- 36. Shah SH, Sun JL, Stevens RD, Bain JR, Muehlbauer MJ, Pieper KS, Haynes C, Hauser ER, Kraus WE, Granger CB et al.. Baseline metabolomic profiles predict cardiovascular events in patients at risk for coronary artery disease. Am Heart J. 2012;163(5):844–50. e1. [DOI] [PubMed] [Google Scholar]
- 37. Christensen JJ, Ulven SM, Retterstol K, Narverud I, Bogsrud MP, Henriksen T, Bollerslev J, Halvorsen B, Aukrust P, Holven KB. Comprehensive lipid and metabolite profiling of children with and without familial hypercholesterolemia: a cross-sectional study. Atherosclerosis. 2017;266:48–57. [DOI] [PubMed] [Google Scholar]
- 38. Morrison DJ, Preston T. Formation of short chain fatty acids by the gut microbiota and their impact on human metabolism. Gut Microbes. 2016;7(3):189–200. [DOI] [PMC free article] [PubMed] [Google Scholar]
- 39. Akanji AO, Peterson DB, Humphreys S, Hockaday TD. Change in plasma acetate levels in diabetic subjects on mixed high fiber diets. Am J Gastroenterol. 1989;84(11):1365–70. [PubMed] [Google Scholar]
- 40. Org E, Blum Y, Kasela S, Mehrabian M, Kuusisto J, Kangas AJ, Soininen P, Wang Z, Ala-Korpela M, Hazen SL et al.. Relationships between gut microbiota, plasma metabolites, and metabolic syndrome traits in the METSIM cohort. Genome Biol. 2017;18(1):70. [DOI] [PMC free article] [PubMed] [Google Scholar]
- 41. Eussen SJ, Ueland PM, Vollset SE, Nygard O, Midttun O, Sulo G, Ulvik A, Meyer K, Pedersen ER, Tell GS. Kynurenines as predictors of acute coronary events in the Hordaland Health Study. Int J Cardiol. 2015;189:18–24. [DOI] [PubMed] [Google Scholar]
- 42. Pedersen ER, Tuseth N, Eussen SJ, Ueland PM, Strand E, Svingen GF, Midttun O, Meyer K, Mellgren G, Ulvik A et al.. Associations of plasma kynurenines with risk of acute myocardial infarction in patients with stable angina pectoris. Arterioscler Thromb Vasc Biol. 2015;35(2):455–62. [DOI] [PubMed] [Google Scholar]
- 43. Kriebitzsch C, Verlinden L, Eelen G, van Schoor NM, Swart K, Lips P, Meyer MB, Pike JW, Boonen S, Carlberg C et al.. 1,25-dihydroxyvitamin D3 influences cellular homocysteine levels in murine preosteoblastic MC3T3-E1 cells by direct regulation of cystathionine beta-synthase. J Bone Miner Res. 2011;26(12):2991–3000. [DOI] [PMC free article] [PubMed] [Google Scholar]
- 44. Han S, Li T, Ellis E, Strom S, Chiang JY. A novel bile acid-activated vitamin D receptor signaling in human hepatocytes. Mol Endocrinol. 2010;24(6):1151–64. [DOI] [PMC free article] [PubMed] [Google Scholar]
- 45. Powell EE, Kroon PA. Low density lipoprotein receptor and 3-hydroxy-3-methylglutaryl coenzyme A reductase gene expression in human mononuclear leukocytes is regulated coordinately and parallels gene expression in human liver. J Clin Invest. 1994;93(5):2168–74. [DOI] [PMC free article] [PubMed] [Google Scholar]
- 46. Horton JD, Cuthbert JA, Spady DK. Dietary fatty acids regulate hepatic low density lipoprotein (LDL) transport by altering LDL receptor protein and mRNA levels. J Clin Invest. 1993;92(2):743–9. [DOI] [PMC free article] [PubMed] [Google Scholar]
- 47. Mustad VA, Ellsworth JL, Cooper AD, Kris-Etherton PM, Etherton TD. Dietary linoleic acid increases and palmitic acid decreases hepatic LDL receptor protein and mRNA abundance in young pigs. J Lipid Res. 1996;37(11):2310–23. [PubMed] [Google Scholar]
- 48. Fernandez ML, McNamar DJ. Dietary fat-mediated changes in hepatic apoprotein B/E receptor in the guinea pig: effect of polyunsaturated, monounsaturated, and saturated fat. Metabolism. 1989;38(11):1094–102. [DOI] [PubMed] [Google Scholar]
- 49. Fernandez ML, Lin EC, McNamara DJ. Regulation of guinea pig plasma low density lipoprotein kinetics by dietary fat saturation. J Lipid Res. 1992;33(1):97–109. [PubMed] [Google Scholar]
- 50. Costet P, Cariou B, Lambert G, Lalanne F, Lardeux B, Jarnoux AL, Grefhorst A, Staels B, Krempf M. Hepatic PCSK9 expression is regulated by nutritional status via insulin and sterol regulatory element-binding protein 1c. J Biol Chem. 2006;281(10):6211–8. [DOI] [PubMed] [Google Scholar]
- 51. Jeong HJ, Lee HS, Kim KS, Kim YK, Yoon D, Park SW. Sterol-dependent regulation of proprotein convertase subtilisin/kexin type 9 expression by sterol-regulatory element binding protein-2. J Lipid Res. 2008;49(2):399–409. [DOI] [PubMed] [Google Scholar]
- 52. Dubuc G, Chamberland A, Wassef H, Davignon J, Seidah NG, Bernier L, Prat A. Statins upregulate PCSK9, the gene encoding the proprotein convertase neural apoptosis-regulated convertase-1 implicated in familial hypercholesterolemia. Arterioscler Thromb Vasc Biol. 2004;24(8):1454–9. [DOI] [PubMed] [Google Scholar]
- 53. Welder G, Zineh I, Pacanowski MA, Troutt JS, Cao G, Konrad RJ. High-dose atorvastatin causes a rapid sustained increase in human serum PCSK9 and disrupts its correlation with LDL cholesterol. J Lipid Res. 2010;51(9):2714–21. [DOI] [PMC free article] [PubMed] [Google Scholar]
- 54. Janowski BA, Willy PJ, Devi TR, Falck JR, Mangelsdorf DJ. An oxysterol signalling pathway mediated by the nuclear receptor LXR alpha. Nature. 1996;383(6602):728–31. [DOI] [PubMed] [Google Scholar]
- 55. Peet DJ, Turley SD, Ma W, Janowski BA, Lobaccaro JM, Hammer RE, Mangelsdorf DJ. Cholesterol and bile acid metabolism are impaired in mice lacking the nuclear oxysterol receptor LXR alpha. Cell. 1998;93(5):693–704. [DOI] [PubMed] [Google Scholar]
- 56. Bosaeus IG, Andersson HB. Short-term effect of two cholesterol-lowering diets on sterol excretion in ileostomy patients. Am J Clin Nutr. 1987;45(1):54–9. [DOI] [PubMed] [Google Scholar]
- 57. Wan J, Jiang L, Lu Q, Ke L, Li X, Tong N. Activation of PPARdelta up-regulates fatty acid oxidation and energy uncoupling genes of mitochondria and reduces palmitate-induced apoptosis in pancreatic beta-cells. Biochem Biophys Res Commun. 2010;391(3):1567–72. [DOI] [PubMed] [Google Scholar]
Associated Data
This section collects any data citations, data availability statements, or supplementary materials included in this article.