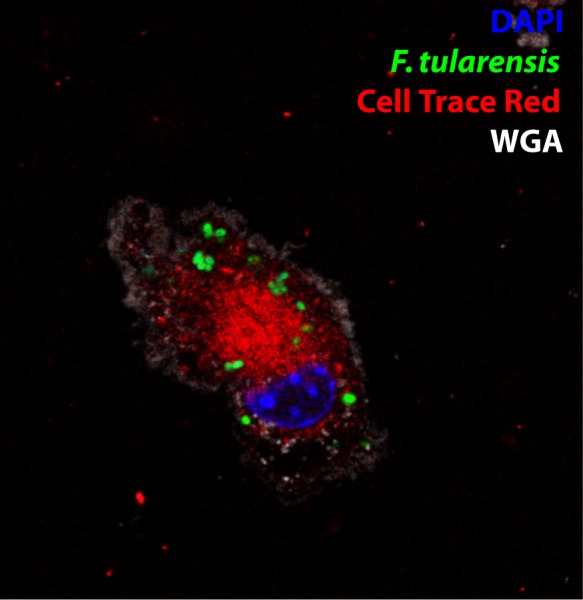
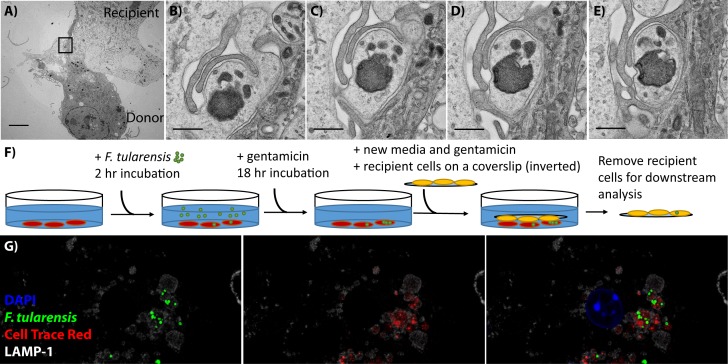
Figure 1. BMDMs acquire bacteria and cytosolic content from neighbouring cell via phagocytosis.
(A) Transmission electron microscopy of a donor and recipient BMDM. The less electron dense cell is the donor cell in this instance. The scale bar represents 5 μm. (B–E) Higher magnification images of the black box in panel A. Each panel is a sequential slice through the same region. The scale bar represents 500 nm. (F) A diagram of the synchronized transfer assay. Recipient cells are seeded onto a coverslip, inverted onto the infected cells and then the coverslip is removed to purify the recipient cells. (G) Representative confocal microscopy image of a recipient cell after bacterial transfer. This image indicates that bacteria and cytosolic content are both acquired together. The different images represent different combinations of stains and the complete overlay. F. tularensis (green), transferred cytosolic protein (Cell Trace Red) (red), LAMP-1 (white) and DAPI (blue). An example donor cells is depicted in Figure 1—figure supplement 1.
Figure 1—figure supplement 1. Representative image of a donor cell in cytosolic transfer assay.


