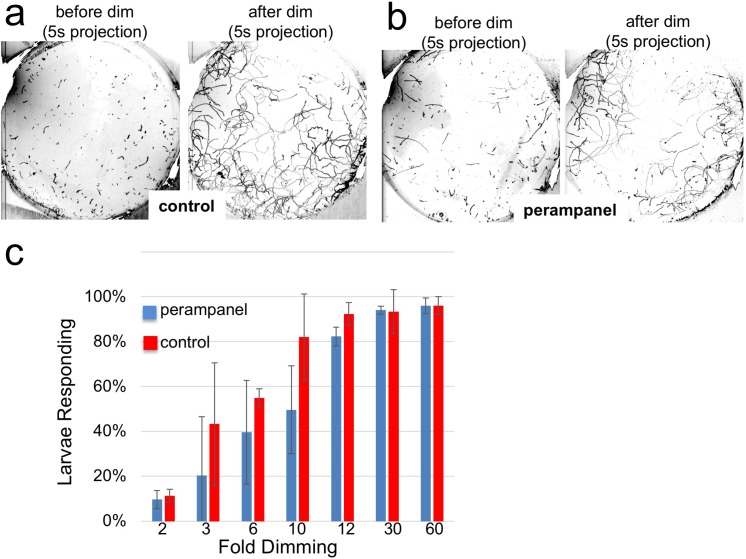
Figure 6. Perampanel does not disrupt the light dimming response.
(a) Light dimming response in control larvae. Shown are 5 s (s) projections from time-lapse videos in which swims appear as lines. Left panel shows a projection 5 s before dimming, and right panel 5 s after dimming. (b) same as a, but larvae were perampanel-treated. (c) Quantification of light dimming response in control and perampanel treated larvae. Larvae were exposed to dimming of 505 nm light from 2- to 60-fold. Dimming response was scored as percent of larvae responding. Bars show averages of three independent assays ± standard deviation.

