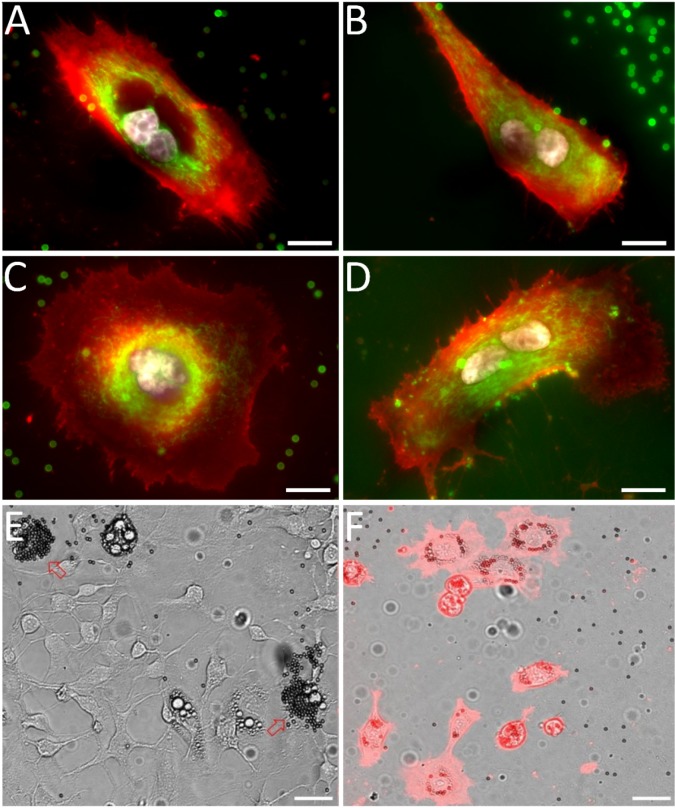
Figure 6. Examples of sorted multinucleated H226 cells (A, C) 1 and 2 (B, D) days after scMOCa.
Active mitochondria (Mitotracker) appear in green, plasma membrane (WGA-Alexa 647) in red, an nuclei (Hoechst) in white. Scale bar: 15 µm. (E) 3T3 cell population partially differentiated into adipocytes. Two cells (pointed by arrows) have been tagged with magnetic beads. Three other cells are also differentiated in adipocytes in this field of view but were not selected. (F) Cells were captured using scMOCA and kept in culture for 6 days before imaging. Cells were stained with WGA-Alexa 647 to highlight membranes. Small black circles are magnetic beads while lipid vesicles appear as small clear circles. Scale bar: 30 µm.


