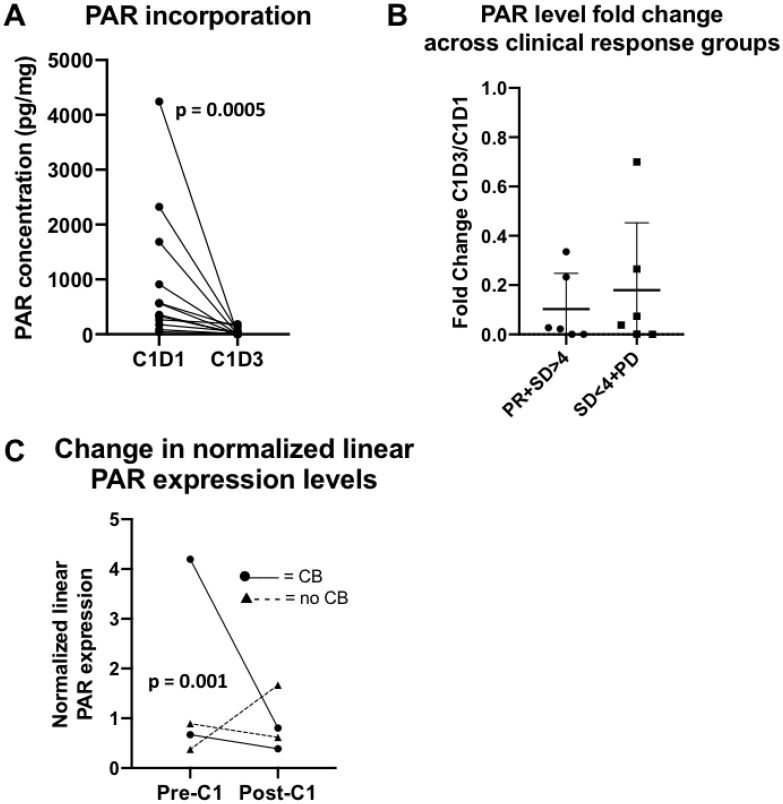
Figure 4. PAR translational studies.
(A) PAR incorporation in peripheral blood. There was an expected decrease in PAR levels after treatment with olaparib in 12 evaluable paired samples. (B) Fold change in PAR concentration in peripheral blood by clinical response. No significant differences between fold change of PAR concentrations (C1D3/C1D1) and clinical response, defined as PR+SD>4 months versus SD<4 months+PD were observed. Abbreviations: C1D1 = cycle 1, day 1; C1D3 = cycle 1, day 3; PR = partial response; SD = stable disease; PD = progressive disease. (C) Change in normalized linear PAR expression levels between pre- and post-cycle 1 biopsy. A greater decrease of PAR levels was seen in the clinical benefit group (PR+SD≥4 months) versus no benefit group (SD<4 months+PD), p = 0.001. Abbreviations: C1 = cycle 1; CB = clinical benefit.

