Abstract
Objectives:
To develop a new automated segmentation method of white-matter (WM) and cortical multiple sclerosis (MS) lesions visible on magnetization-prepared 2 inversion-contrast rapid gradient echo (MP2RAGE) images acquired at 7T MRI.
Material and Methods:
The proposed method (MSLAST: Multiple Sclerosis Lesion Analysis at Seven Tesla) takes as input a single image contrast derived from the MP2RAGE sequence and is based on partial volume estimation and topological constraints. First, MSLAST performs a skull-strip of MP2RAGE images and computes tissue concentration maps for WM, gray-matter (GM) and cerebrospinal-fluid (CSF) using a partial-volume model of tissues within each voxel. Second, MSLAST performs: i) connected-component analysis to GM and CSF concentration maps to classify small isolated components as MS lesions; ii) hole-filling in the WM concentration map to classify areas with low WM concentration surrounded by WM (i.e. MS lesions); and iii) outlier rejection to the WM mask in order to improve the classification of small WM lesions. Third, MSLAST unifies the three maps obtained from i), ii) and iii) processing steps to generate a global lesion mask.
Results:
Quantitative and qualitative assessments were performed using MSLAST in 25 MS patients from two research centers. Overall, MSLAST detected a median of 71% of MS lesions, specifically 74% of WM and 58% of cortical lesions, when a minimum lesion size of 6 μL was considered. The median false positive rate was 40%. When a 15 μL minimal lesions size was applied, which is the approximation of the minimal size recommended for 1.5/3T images, the median detection rate was 80% for WM and 63% for cortical lesions, respectively, and the median false positive rate was 33%. We observed high correlation between MSLAST and manual segmentations (Spearman’s rank correlation coefficient, ρ=0.91), though MSLAST underestimated the total lesion volume (average difference of 1.1 ml), especially in patients with high lesion loads. MSLAST also showed good scan-rescan repeatability within the same session with an average absolute volume difference and F1-score of 0.38±0.32 ml and 84%, respectively.
Conclusions:
We propose a new methodology to facilitate the segmentation of WM and cortical MS lesions at 7T MRI, our approach uses a single MP2RAGE scan and may be of special interest to clinicians and researchers.
Keywords: Lesion Segmentation, Multiple Sclerosis, MP2RAGE, Ultra-High-Field MRI, Cortical Lesions
1. Introduction
Ultra-high field (UHF) magnetic resonance imaging (MRI) provides important insights into multiple sclerosis (MS) pathophysiology due to its improved signal-to-noise and contrast-to-noise ratio as well as higher achievable spatial resolution compared to lower fields (1–4). 7T MRI has improved the detection of WM lesions – especially of small MS plaques (5) – as well as focal and diffuse pathology in the cortex (6), both in the cerebral hemispheres (7, 8) and in the cerebellum (9). The location, morphology, and inflammatory aspects of cortical lesions at 7T MRI have been described (10–12). The recent regulatory approval of 7T MRI for clinical use has made it necessary to develop tools for identification and quantification of lesions throughout the neuraxis, especially in the case of cortical lesions, which are now included in the revised MS diagnostic criteria (13).
To date, however, none of the existing methods for automatic lesion detection at 1.5T or 3T MRI (14–16) have been used for 7T MRI. This is in part because 7T images exhibit some characteristics that are challenging for direct translation of methods from lower field strengths. Most importantly, 7T MRI scans are affected by stronger intensity variations across the image due to increased inhomogeneity in the radiofrequency (B1) field compared to 1.5T and 3T MRI (2, 17). Also, spatial distortions are increased due to the inhomogeneities related to local variations of the static magnetic field (B0). Lastly, high-resolution T2 FLAIR imaging – the most often-used contrast for MS lesion detection, which is frequently the basis of lesion-detection algorithms – is challenging to perform at UHF due to its high specific absorption rate (SAR) and other restrictions (2, 18, 19). Consequently, current available methods developed for 1.5 and 3T images are not suitable to perform automatic lesion segmentation with images acquired at 7T.
In this work, we have developed “MSLAST” (Multiple Sclerosis Lesion Analysis at Seven Tesla), which is a new method tailored to detect and segment MS lesions on Magnetization-Prepared 2 Inversion-Contrast Rapid Gradient Echo (MP2RAGE) images acquired at 7T MRI. MP2RAGE has been selected as input image for our segmentation framework as it provides i) a homogenous T1-weighted contrast due to its inherent bias correction, rendering it robust to both B1 and B0 inhomogeneities, and ii) quantitative maps of T1 relaxation (20, 21). Moreover, MP2RAGE has been shown to provide high contrast between different brain tissues and high sensitivity to WM and cortical MS pathology at both high- and ultra-high-fields (8, 9, 22). These characteristics thus make MP2RAGE sequence a good image for automated evaluation of MS lesion count and volume at 7T MRI.
2. Material and Methods
2.1. MRI and subjects
MR images were acquired at two different institutions: institution A and institution B, both using a 7T research scanner (Siemens Healthcare, Erlangen, Germany). This research was approved by the local ethics committees of both institutions, and all the subjects gave written, informed consent prior to participation.
At the institution A, MP2RAGE images from 14 individuals with early relapsing-remitting MS (RRMS) (10 women, 4 men, age range: 21–46 years) were obtained. At the institution B, MP2RAGE images from 8 individuals with RRMS and 3 with secondary progressive MS (7 women, 4 men, age range: 18–64 years) were acquired. In 5 patients of the institution B cohort, two MP2RAGE exams were conducted at the beginning and the end of the same scan session to assess repeatability.
The MP2RAGE protocol parameters applied at both institutions are summarized in Table 1. In this work we excluded the quantitative maps, and we used only the homogenous T1-weighted contrast from the MP2RAGE acquisitions, where lesions appear as hypointense signals.
Table 1:
Set of parameters used for the MP2RAGE acquisition at both institutions: institution A, institution B.
| Institution A | Institution B | |
|---|---|---|
| Resolution, mm | 0.75 × 0.75 × 0.9 | 0.7 isotropic |
| Matrix size | 300 × 320 | 320 × 320 |
| No. partitions | 160 | 224 |
| Orientation/readout dir. | sagittal/S→I | sagittal/S→I |
| AT, min | 09:33 | 10:08 |
| Acceleration factor | 3 | 3 |
| TR, ms | 6000 | 6000 |
| TE, ms | 2.92 | 3.02 |
| TI1/TI2, ms | 750/2350 | 800/2700 |
| Flip angles*, degrees | 4/5 | 4/5 |
| Bandwidth, Hz/pixel | 240 | 240 |
Both acquisitions are 3D.
Flip angles for first/second GRE readout.
MP2RAGE indicates magnetization-prepared 2 inversion-contrast rapid gradient-echo; AT, acquisition time; TR, repetition time; TE, echo time; TI1 and TI2, first and second inversion times.
2.2. Manual Segmentation
Lesions were identified and delineated manually in the 25 cases (14 from institution A, and 11 from institution B). The manual segmentations were performed by consensus between one radiologist (expert 1) and one neurologist/neuroimmunologist with expertise in MS and neuroimaging (expert 2), with 4 and 14 years of experience, respectively. The observers were blinded to clinical status. Hypointense abnormalities that have similar appearance to MS lesions in MP2RAGE, such as Virchow-Robin (VR) spaces (23) and vessels were distinguished from MS lesions according to the following criteria: (i) punctuate or tubular hypodensities with a diameter inferior to 3 mm, and hypointense structures with superior size located in the basal ganglia and subinsular regions were considered as VR spaces. VR spaces were typically located around perforating brain vessels, which run perpendicular to the brain surface. (ii) Vessels were considered as deep medullary veins as tubular hypointense structures that had a parallel distribution patterns adjacent to the body or inferior horn and a radial pattern in the frontal horn or trigon of the lateral ventricle, and which could be follow on at least three slices.
Subsequently, each lesion was labeled as cortical or WM lesion. Cortical lesions were further categorized (6, 24) into: 1) leukocortical, extensions of WM lesions into the cortex; 2) intracortical, lesions within the cortex that do not involve the subcortical WM; and 3) subpial, lesions across one gyrus that affect the cortex and reach the pial surface. Segmented lesions with a volume < 6μL were subsequently excluded from the lesion masks. The resulting lesion masks were taken as a reference to validate MSLAST.
2.3. Pipeline
A scheme of the processing steps performed within MSLAST is presented in Figure 1.
Figure 1 -.
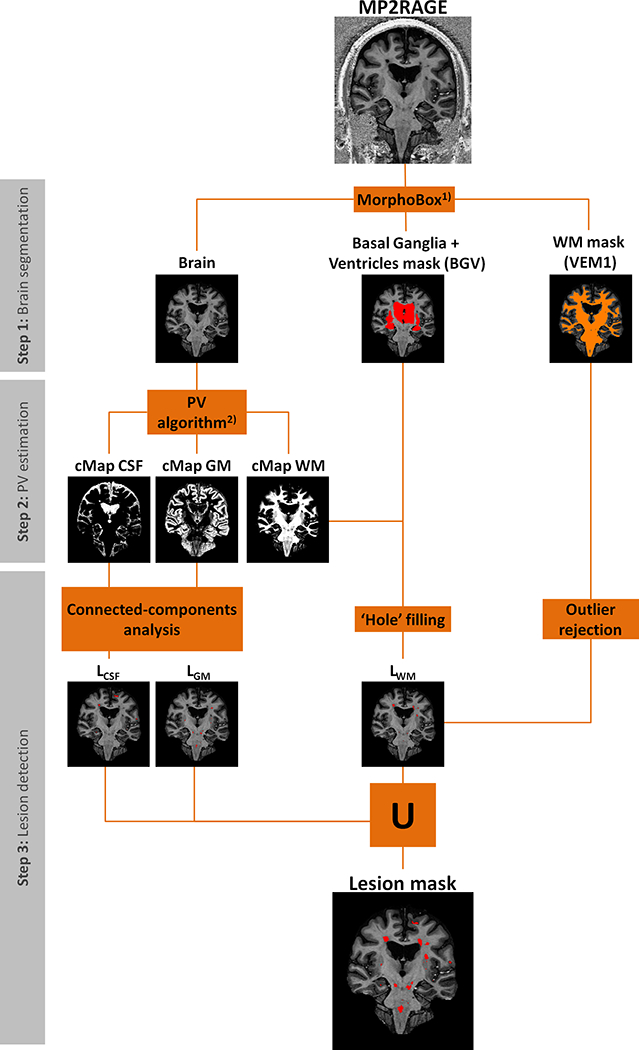
Schematic diagram of the MSLAST method for lesion segmentation using 7T MP2RAGE, divided into three main steps: brain segmentation, partial volume (PV) estimation, and post-processing. VEM 1 is a template-based WM segmentation. cMap CSF, cMap GM, and cMap are concentration maps of white matter, gray matter, and cerebrospinal fluid, respectively. LCSF, LGM, and LWM are “pseudo” lesion masks computed from the cMaps of CSF, GM and WM, respectively. 1) - (25), 2) - (28).
2.3.1. Step 1: Brain segmentation
We used the MorphoBox prototype software (25) to perform the skull stripping and to compute a mask of basal ganglia plus ventricles and WM segmentation mask (VEM1). A template image was non-rigidly registered onto the 7T MP2RAGE image using a transformation T’. The transformation T’ represents a nine-parameter affine transformation A’ (translation, rotation, and scaling) followed by a free-form diffeomorphic displacement D’. Following the registration, template-based tissue prior probability maps were resampled to the 7T MP2RAGE input image using the transformation T’. These priors were obtained using the DARTEL tool of SPM8 (26) from a data set of 136 MR scans of healthy subjects. A segmentation of the WM (VEM1) was computed using an expectation-maximization algorithm that uses a simple 4-class Gaussian mixture intensity model representing GM, WM, CSF, and non-brain tissue constrained by the tissue prior probability maps. The total intracranial volume (TIV) of the input 7T MP2RAGE image was obtained from the resampled TIV template mask according to the transformation T’. Finally, the basal ganglia plus ventricles mask was obtained by resampling the basal ganglia plus ventricles template mask to the input image space applying the affine transformation A’.
2.3.2. Step 2: Partial volume estimation
Brain tissue (WM and GM) and CSF “concentrations” from the obtained TIV of MP2RAGE were computed using a partial volume estimation algorithm. The method is an extension of the “mixel” model (27) based on a Bayesian maximum a posteriori formulation, where a prior model is used in order to regularize the problem (28). As a result, three maps were obtained representing the calculated concentrations of WM, GM, and CSF for each voxel.
2.3.3. Step 3: Lesion detection
For subsequent processing steps, the concentration maps must be binary, i.e. a threshold was applied. The three thresholds (for GM, WM, and CSF) were optimized independently using a randomly selected patient dataset from the cohort. The goal was to maximize the separation between lesions (defined by the manual segmentation) and healthy tissues evaluating the connected component analyses at different thresholds. After this optimization step, the resulting thresholds (cWM ≥ 30%, cGM ≥ 40%, cCSF ≥ 40%) were applied.
2.3.3.1. Connected-components analyses
In MP2RAGE images, lesions share similar intensities with GM and CSF. Consequently, lesions are often misclassified as one of these tissue classes by the partial volume algorithm. To address this issue, we made the assumption that cortical GM and cortical CSF are two large regions, which are either partially or fully connected. To separate the different clusters in the image, a connected component analysis was applied to the binary maps of GM and CSF. The largest connected component in the GM map was assumed to be cortical GM and all the remaining small components were classified as lesions, resulting in LGM mask. A similar procedure was applied to the CSF binary map to obtain a LCSF mask, however only clusters within 2 mm from the cortical CSF were considered as lesions. In this last case, we applied this distance rule to avoid the misclassification of sulcal CSF. Some of these regions of sulcal CSF were not connected to the main CSF component due to partial volume effects between GM and CSF.
2.3.3.2. Hole-filling
Inspired by Udupa et al. (29) and under the assumption that areas with low WM concentration surrounded by WM correspond to lesions, we applied a hole-filling technique – based on a flood-fill algorithm (30) – to the binary map of WM. All “holes” on the binary WM map were considered as lesions except the volumes corresponding to the ventricles and basal ganglia structures (defined by the basal ganglia plus ventricles mask from MorphoBox).
2.3.3.3. Outlier rejection
To improve the detection of small WM lesions that were fully prone to partial volume effects, we used the MorphoBox VEM1 mask. We assumed that hypointense regions that overlapped with VEM1 were WM lesions (defined as WM outlier mask). LWM mask was obtained by the union of the “hole” (sub-section 2.3.3.2) and the WM outlier masks.
2.3.3.4. Union mask
After applying all the post-processing techniques mentioned above, we obtained three “pseudo” lesion maps (LCSF, LGM, LWM) based on the three concentration maps. These were merged into a single mask (union mask, MSLASTmask), which is the final output of our pipeline:
2.4. Evaluation
2.4.1. Lesion detection and volume estimation
Lesion-wise true and false positive rates were estimated to evaluate the lesion detection performance of MSLAST, using two definitions of minimum lesion size: 6 μL, and 15 μL (≈ 3 mm diameter size (31)). The minimum lesion size of 15 μL was estimated considering the a 3 mm diameter minimal lesion size that was previously suggested for lower magnetic field strengths (31) and approximating the lesion shape to the one of a sphere; the minimal lesion size of 6 μL was identified by considering the 10th percentile of the distribution of lesion sizes in our data. The true positive rate (TPR) was defined by the percentage of detected lesions that overlap with the reference by at least one voxel. The false positive rate (FPR) was estimated as the ratio of the number of segmented lesions that do not overlap with any lesion in the reference by the total number of lesions segmented automatically. TPR was computed for all lesions as well as for WM and cortical lesions separately. Correlation and Bland-Altman plots were computed to evaluate the total lesion volume (TLV) agreement between manual and automatic segmentations. The correlations were evaluated using the Spearman’s rank correlation coefficient. In the Bland-Altman plot, the differences between manual and automatic segmentations were plotted against the average of the two segmentations (32).
2.4.2. Repeatability analyses
Bland-Altman plots were also used to study the repeatability, where TLV differences and averages between scan and re-scan were computed for the manual and automated segmentations. In addition, the lesion-wise F1-score and absolute volume difference between scan and re-scan were estimated for both scenarios. F1 score was adapted from Commowick et al. (33), defined here as the proportion of lesions detected in both scans relatively to the number of lesions uniquely detected in one or other scan.
2.5. Statistical analyses
Detection rates of WM and cortical lesions were compared using a paired Wilcoxon signed-rank test. The same statistical test was used to compare the absolute TLV difference and F1-score between the manual and the automated segmentations in the repeatability analyses. The tests were performed using Matlab software version 8.1.
3. Results
3.1. Manual segmentation
Based on manual segmentation of MS lesions, our cohort of patients had a total of 1820 WM lesions (median, range, 1st and 3rd quartiles of WM lesion count per patient: 66, 14–253, 36, 90) with an average lesion volume of 87 μl, and 364 cortical lesions (median, range, 1st and 3rd quartiles of cortical lesion count per patient: 10, 0–56, 1, 21) with an average volume of 63 μl. The total number/ average volume per lesion of the sub-categories of cortical lesions were 271/109 μl (leukocortical), 69/58 μl (intracortical) and 24/22 μl (subpial), respectively. Figure 2 shows the total count and the total lesion volume (TLV) across the entire cohort (panel A) and per patient (panel B). In our cohort, the majority (68% of the cases) of the patients were characterized by a low lesion load (TLV < 10 ml).
>Figure 2 -.
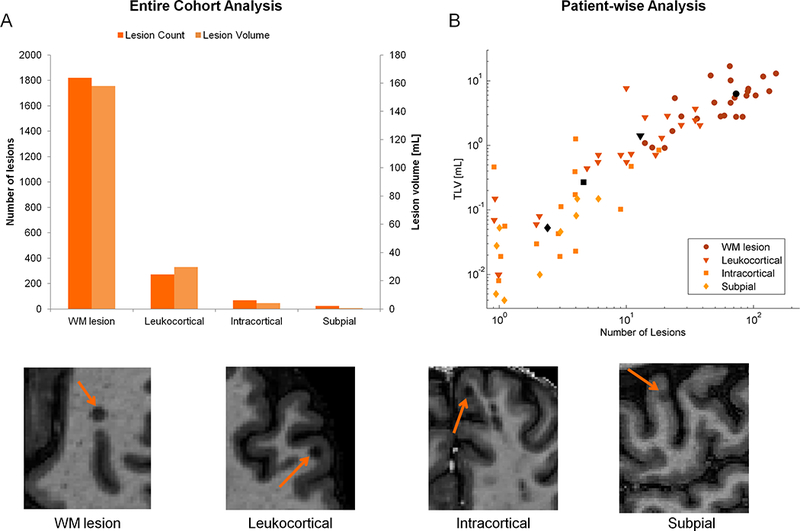
Lesion count and lesion volume estimation according to the manual segmentation results. Panel A: total number (light orange) and total lesion volume (dark orange) of each type of lesion in the entire cohort. Panel B: Log-log plot of total lesion volume (TLV) and number of lesions per each type of lesion: white matter (WM, circle), leukocortical (triangle), intracortical (square), and subpial (diamond) lesions. The coloured and black symbols represent the values per patient and average values per lesion type, respectively. An example MP2RAGE image for each type of lesion is presented below the panels A and B.
3.2. Lesion detection and volume estimation
MSLAST lesion detection identified a median of 71% (range: 41–100%) of the lesions with a median false positive rate of 40% (range: 13–75%). It showed better performance in WM lesion detection (median: 74%, range: 38–100%), when compared to cortical lesion detection (median: 58%, range: 21–100%, p<.01, see Figure 3). These numbers were obtained for a minimum lesion volume of 6 μl. When the minimum lesion size was set to 15 μl (3 mm diameter) – as defined by the MS diagnosis criteria (31) - the detection rate for WM lesions and cortical lesions increased to 80% (p<.001), and 63% (p<.05), respectively. The false positive rate median for this particular definition of minimum lesion size decrease significantly to 33% (p<0.01).
Figure 3 -.
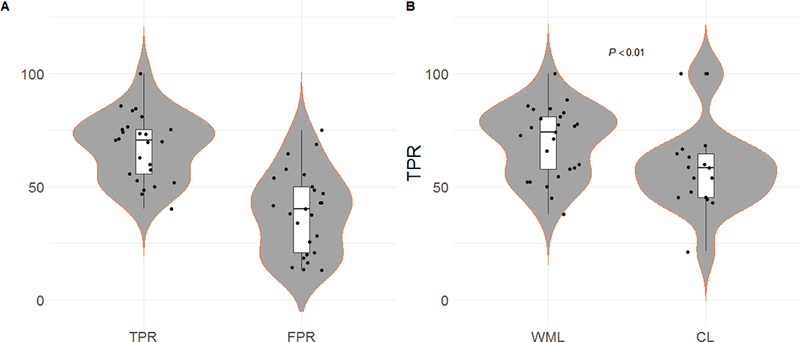
Violinplots and boxplots showing the lesion detection performance of the proposed method (MSLAST). Panel A: True positive rate (TPR) and false positive rate (FPR) from all patients across all type of lesions. Panel B: TPR of all patients across both types of lesions: white-matter lesions (WML) and cortical lesions (CL).
MSLAST results were highly correlated with those obtained by manual segmentation (ρ=0.91). However, the TLV was generally underestimated, mainly in the setting of high lesion load (Figure 4, panel A). In 3 cases, all of which had manual lesion load higher than the median, the MSLAST lesion volume was outside of the limits of agreement by Bland-Altman analysis (Figure 4, panel B). Overall, the mean TLV difference between the automated and manual segmentations was −1.1 ml, with limits of agreement ranging from −5.1 to 5.1 ml.
Figure 4 -.
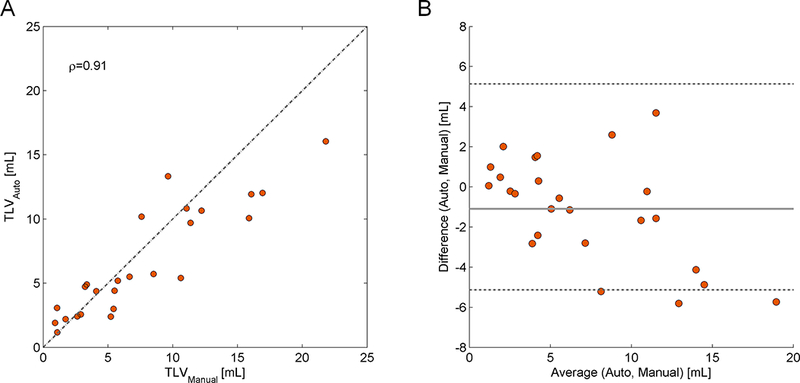
Plots showing the lesion volume estimation performance of the proposed method. Panel A: Total lesion volume (TLV) correlation between the reference and the automated segmentation. The respective Spearman’s rank correlation coefficient (ρ) is given. The dashed line represents the identity (TLVRef=TLVAuto). Panel B: Bland-Altman plot for TLV agreement between manual and automatic segmentations.
Examples of lesion segmentations obtained using the MSLAST in three different MS patients with different types of lesions are shown in Figure 5. Figure 6 shows examples of three cases where MSLAST showed poor performance due to the high number of false positives and/or false negatives.
Figure 5 -.
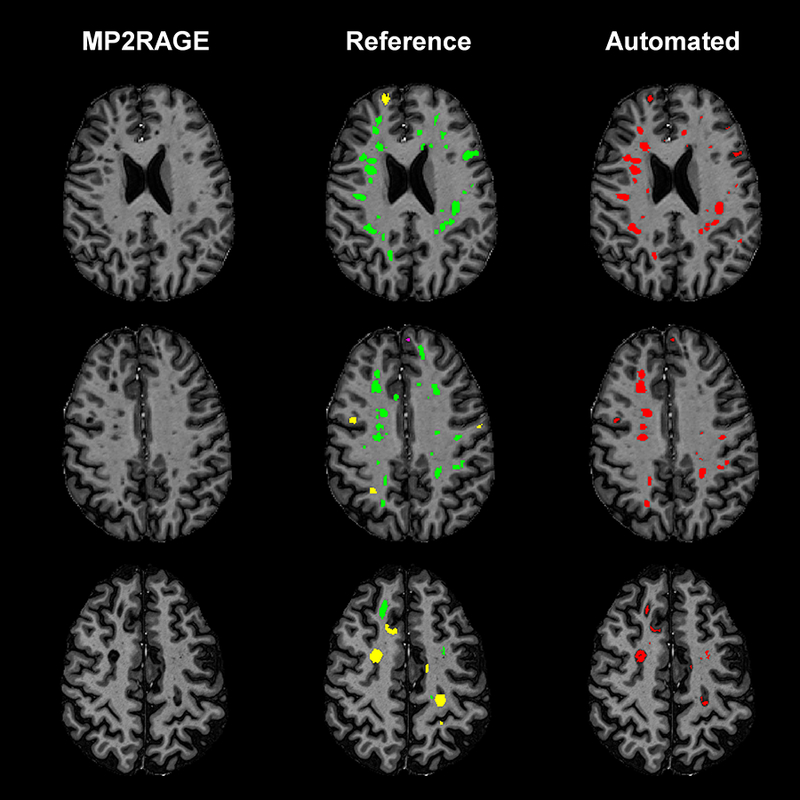
Axial slices from three different MS patients showing the detection and segmentation results of MSLAST. From left to right: MP2RAGE skull-stripped image, manual segmentation, and automated segmentation. In the manual segmentations, white matter lesions are shown in green, leukocortical lesions in yellow, and intracortical lesions in pink.
Figure 6 -.
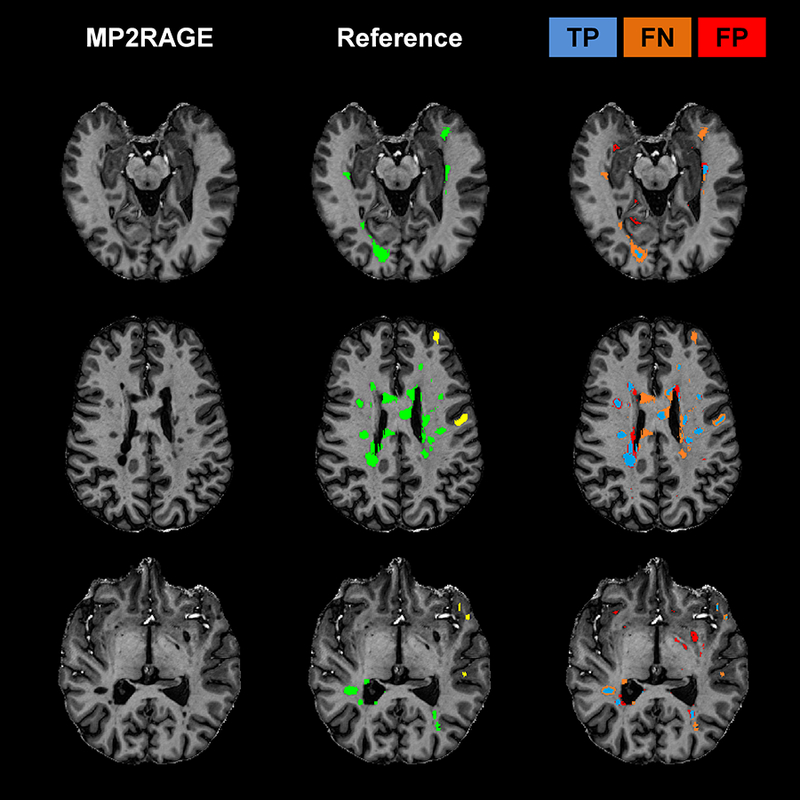
Examples of three cases where MSLAST showed low performance due to high number of false negatives and/or false positives. From left to right: MP2RAGE slice, manual segmentation, and mask representing true positives (TP, blue), false negatives (FP, orange), and false positives (FP, red). In the manual segmentations, white matter lesions are shown in green and leukocortical lesions in yellow.
3.3. Repeatability analyses
MSLAST showed a higher agreement between the segmentation of the first and second scans in the five scan/rescan cases when compared to the manual assessment (Figure 7). The mean TLV difference obtained was 0.29 ml with a deviation range of −0.82 to 0.82 ml against 0.13 ml with a deviation range of −1.58 to 1.58 obtained from the manual segmentations. MSLAST showed a better F1-score average (84% against 78.1% from manual segmentations) and a lower average of TLV absolute difference (0.38 ml against 0.64 ml obtained from the manual segmentations, Table 2) between first and second scans.
Figure 7 -.
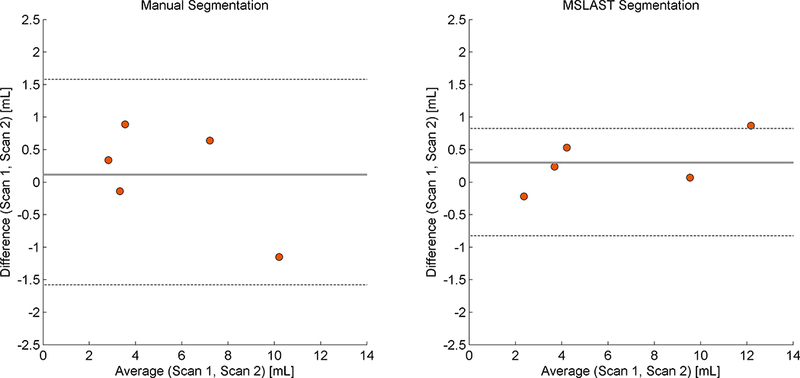
Bland-Altman plot for total lesion volume agreement in scan and re-scan data obtained using the manual (left panel), and automated (MSLAST, right panel) segmentations.
Table 2 -.
Total lesion volume (TLV), absolute volume difference and F1-score obtained using the five subjects from scan, re-scan dataset. Average and standard deviation (STD) values for absolute volume difference and F1-score are presented in the last row.
| Manual Segmentation | TLV [ml] | Absolute TLV difference [ml] | F1-score [%] | |
| Scan 1 | Scan 2 | |||
| Subject 1 | 7.59 | 6.95 | 0.64 | 77.7 |
| Subject 2 | 4.09 | 3.20 | 0.90 | 77.0 |
| Subject 3 | 9.64 | 10.79 | 1.15 | 77.2 |
| Subject 4 | 3.36 | 3.50 | 0.15 | 67.3 |
| Subject 5 | 2.90 | 2.56 | 0.34 | 91.2 |
| Average ± STD | 0.64 ± 0.41 | 78.1 ± 8.5 | ||
| MSLAST Segmentation | TLV [ml] | Absolute TLV difference [ml] | F1-score [%] | |
| Scan 1 | Scan 2 | |||
| Subject 1 | 9.64 | 9.57 | 0.06 | 89.2 |
| Subject 2 | 3.90 | 3.66 | 0.24 | 80.0 |
| Subject 3 | 12.65 | 11.78 | 0.87 | 89.4 |
| Subject 4 | 4.50 | 3.97 | 0.53 | 80.7 |
| Subject 5 | 2.34 | 2.56 | 0.22 | 79.6 |
| Average ± STD | 0.38 ± 0.32 | 83.8 ± 5.1 | ||
4. Discussion and Conclusion
In this work, we have presented and validated MSLAST, a method that automatically detects and segments MS lesions using a single MP2RAGE scan at 7T MRI.
Our results demonstrate that MSLAST effectively detects MS lesions located in both white matter and cortex using high resolution 7T MR images. Considering the radiological definition of MS lesion size (volume approximately ≥15 μl), we obtained a WM lesion detection rate of nearly 80% and a cortical lesion detection rate of 63%. This performance, based on one single image contrast, is in line with the reported results by methods developed for conventional imaging and based on multiple MRI contrasts at 1.5T and 3T (34–36).
Despite its good overall performance, MSLAST has some limitations. We found that MSLAST misses small periventricular lesions (Figure 6). This type of lesion is adjacent to the ventricles and can share similar intensities with ventricular CSF in MP2RAGE images. Consequently, when periventricular lesions are small, they are included in the ventricle mask and therefore not detected by MSLAST. In addition to periventricular lesions, cortical lesions were detected less efficiently overall than WM lesions. This might be because lesions in the cortex are typically much smaller, and often have less contrast than WM lesions, with normal tissue, rendering their identification based on a single contrast really challenging. Finally, MSLAST moderately underestimated (by 27%) the lesion volume in cases with high lesion load. The fact that MSLAST segments a lower lesion volume than manual rating is possibly due to the poor delineation of lesion borders or surrounding regions characterized by diffuse pathology, that are usually affected by partial volume effects (see Figures 5 and 6).
MSLAST appeared to be more reproducible than the manual assessment in a scan-rescan setting, and is in line with methods available for multi-channel 3T data (37). The high lesion-wise F1-score indicates the accuracy of MSLAST in detecting the same lesions in both scan and re-scan images. In comparison to other methods that use conventional field-strength images, including T2-weighted images (such as FLAIR), the number of false positives was comparable for MSLAST (median FPR of 33% for MSLAST, vs. 27 to 32% for other methods) (16, 35, 38, 39). Most of these false positives were isolated areas of sulcal CSF that appeared to be disconnected from cortical CSF due to partial volume effects between GM and CSF at the given image resolutions. Additionally, some vessels and VR spaces misclassified as lesions also contributed to the FPR, particularly in the basal ganglia (see Figure 6, third row). Indeed, these structures have similar intensity and appearance to lesions on the MP2RAGE image, rendering the automatic distinction challenging from a computer vision perspective. Methods reported in the literature showing less false positives are usually using information from different image contrasts that provide additional information to distinguish lesions from other structures, but this remains challenging at 7T, particularly for FLAIR (2, 18, 19).
Future work to improve the palette of available sequences at 7T, as well as pre-processing techniques, might minimize these limitations. Incorporation of atlas-based information into MSLAST, as well as additional topological constraints – as it has been done for other lesion segmentation approaches (38, 40, 41) – might also reduce the FPR. Another potential avenue which is – to the best of the author’s knowledge – not yet explored, is to segment lesions based on quantitative maps (as the T1 map obtained by the MP2RAGE along with the uniform contrast (20, 22)). This could improve the robustness of the segmentation results of MSLAST and other algorithms especially for longitudinal assessment and multi-centre trials due to the increased independence of quantitative maps from the employed hardware and reconstruction. We also aim at assessing the performance of MSLAST in larger cohorts of patients, which include subjects imaged in different 7T scanners.
In conclusion, we have presented an automated method to detect WM and cortical lesions applied to a single MP2RAGE image acquired using ultra-high field MRI. MSLAST represents a first step toward supporting researchers who require MS lesion segmentation at 7T, as manual segmentation is tedious and time-consuming, especially when done on the high spatial resolution images typically obtained at UHF. Moreover, MSLAST may also be of special interest to clinicians, as 7T scanners are now approved for clinical use. Future work should aim at improving the current method for cortical lesion detection and lesion delineation by exploring sensitive methods to further reduce partial volume effects and improve contrast (8).
Acknowledgments
sources of support
The Intramural Research Program of the National Institute of Neurological Disorders and Stroke is also acknowledged for financial support.
References
- 1.Filippi M, Evangelou N, Kangarlu A, et al. Ultra-high-field MR imaging in multiple sclerosis. Journal of Neurology, Neurosurgery & Psychiatry. 2013. [DOI] [PubMed] [Google Scholar]
- 2.Balchandani P, Naidich TP. Ultra-High-Field MR Neuroimaging. American Journal of Neuroradiology. 2015;36(7):1204–15. [DOI] [PMC free article] [PubMed] [Google Scholar]
- 3.Springer E, Dymerska B, Cardoso PL, et al. Comparison of routine brain imaging at 3 T and 7 T. Investigative radiology. 2016;51(8):469. [DOI] [PMC free article] [PubMed] [Google Scholar]
- 4.Tallantyre EC, Morgan PS, Dixon JE, et al. A comparison of 3T and 7T in the detection of small parenchymal veins within MS lesions. Investigative radiology. 2009;44(9):491–4. [DOI] [PubMed] [Google Scholar]
- 5.de Graaf WL, Kilsdonk ID, Lopez-Soriano A, et al. Clinical application of multi-contrast 7-T MR imaging in multiple sclerosis: increased lesion detection compared to 3 T confined to grey matter. European Radiology. 2013;23(2):528–40. [DOI] [PubMed] [Google Scholar]
- 6.Mainero C, Benner T, Radding A, et al. In vivo imaging of cortical pathology in multiple sclerosis using ultra-high field MRI. Neurology. 2009;73(12):941–8. [DOI] [PMC free article] [PubMed] [Google Scholar]
- 7.Kilsdonk ID, Jonkman LE, Klaver R, et al. Increased cortical grey matter lesion detection in multiple sclerosis with 7 T MRI: a post-mortem verification study. Brain. 2016;139(5):1472–81. [DOI] [PubMed] [Google Scholar]
- 8.Beck ES, Sati P, Sethi V, et al. Improved Visualization of Cortical Lesions in Multiple Sclerosis Using 7T MP2RAGE. American Journal of Neuroradiology. 2018. [DOI] [PMC free article] [PubMed] [Google Scholar]
- 9.Fartaria MJ, O’Brien K, Sorega A, et al. An Ultra-High Field Study of Cerebellar Pathology in Early Relapsing-Remitting Multiple Sclerosis Using MP2RAGE. Investigative Radiology. 2017;52(5):265–73. [DOI] [PubMed] [Google Scholar]
- 10.Mainero C, Louapre C, Govindarajan ST, et al. A gradient in cortical pathology in multiple sclerosis by in vivo quantitative 7 T imaging. Brain. 2015;138(4):932–45. [DOI] [PMC free article] [PubMed] [Google Scholar]
- 11.Herranz E, Giannì C, Louapre C, et al. Neuroinflammatory component of gray matter pathology in multiple sclerosis. Annals of Neurology. 2016;80(5):776–90. [DOI] [PMC free article] [PubMed] [Google Scholar]
- 12.Absinta M, Sati P, Gaitán MI, et al. Seven-tesla phase imaging of acute multiple sclerosis lesions: A new window into the inflammatory process. Annals of Neurology. 2013;74(5):669–78. [DOI] [PMC free article] [PubMed] [Google Scholar]
- 13.Thompson AJ, Banwell BL, Barkhof F, et al. Diagnosis of multiple sclerosis: 2017 revisions of the McDonald criteria. The Lancet Neurology. 2018;17(2):162–73. [DOI] [PubMed] [Google Scholar]
- 14.Lladó X, Oliver A, Cabezas M, et al. Segmentation of multiple sclerosis lesions in brain MRI: A review of automated approaches. Information Sciences. 2012;186(1):164–85. [Google Scholar]
- 15.Garcia-Lorenzo D, Francis S, Narayanan S, et al. Review of automatic segmentation methods of multiple sclerosis white matter lesions on conventional magnetic resonance imaging. Med Image Anal. 2013;17(1):1–18. [DOI] [PubMed] [Google Scholar]
- 16.Carass A, Roy S, Jog A, et al. Longitudinal multiple sclerosis lesion segmentation: Resource and challenge. NeuroImage. 2017;148:77–102. [DOI] [PMC free article] [PubMed] [Google Scholar]
- 17.Visser F, Zwanenburg JJM, Hoogduin JM, Luijten PR. High-resolution magnetization-prepared 3D-FLAIR imaging at 7.0 Tesla. Magnetic Resonance in Medicine. 2010;64(1):194–202. [DOI] [PubMed] [Google Scholar]
- 18.Zwanenburg JJM, Hendrikse J, Visser F, et al. Fluid attenuated inversion recovery (FLAIR) MRI at 7.0 Tesla: comparison with 1.5 and 3.0 Tesla. European Radiology. 2010;20(4):915–22. [DOI] [PMC free article] [PubMed] [Google Scholar]
- 19.Saranathan M, Tourdias T, Kerr AB, et al. Optimization of magnetization-prepared 3-dimensional fluid attenuated inversion recovery imaging for lesion detection at 7 T. Investigative radiology. 2014;49(5):290. [DOI] [PMC free article] [PubMed] [Google Scholar]
- 20.Marques JP, Kober T, Krueger G, et al. MP2RAGE, a self bias-field corrected sequence for improved segmentation and T1-mapping at high field. Neuroimage. 2010;49(2):1271–81. [DOI] [PubMed] [Google Scholar]
- 21.Marques JP, Gruetter R. New Developments and Applications of the MP2RAGE Sequence - Focusing the Contrast and High Spatial Resolution R1 Mapping. PLOS ONE. 2013;8(7):e69294. [DOI] [PMC free article] [PubMed] [Google Scholar]
- 22.Kober T, Granziera C, Ribes D, et al. MP2RAGE multiple sclerosis magnetic resonance imaging at 3 T. Invest Radiol. 2012;47(6):346–52. [DOI] [PubMed] [Google Scholar]
- 23.Wuerfel J, Haertle M, Waiczies H, et al. Perivascular spaces—MRI marker of inflammatory activity in the brain? Brain. 2008;131(9):2332–40. [DOI] [PubMed] [Google Scholar]
- 24.Geurts JJ, Bö L, Pouwels PJ, et al. Cortical lesions in multiple sclerosis: combined postmortem MR imaging and histopathology. American Journal of Neuroradiology. 2005;26(3):572–7. [PMC free article] [PubMed] [Google Scholar]
- 25.Schmitter D, Roche A, Maréchal B, et al. An evaluation of volume-based morphometry for prediction of mild cognitive impairment and Alzheimer’s disease. NeuroImage: Clinical. 2014;7:7–17. [DOI] [PMC free article] [PubMed] [Google Scholar]
- 26.Ashburner J, Friston KJ. Computing average shaped tissue probability templates. Neuroimage. 2009;45(2):333–41. [DOI] [PubMed] [Google Scholar]
- 27.Choi HS, Haynor DR, Kim Y. Partial volume tissue classification of multichannel magnetic resonance images-a mixel model. IEEE Transactions on Medical Imaging. 1991;10(3):395–407. [DOI] [PubMed] [Google Scholar]
- 28.Roche A, Forbes F. Partial volume estimation in brain MRI revisited Medical Image Computing and Computer-Assisted Intervention–MICCAI 2014: Springer; 2014:771–8. [DOI] [PubMed] [Google Scholar]
- 29.Udupa JK, Wei L, Samarasekera S, et al. Multiple sclerosis lesion quantification using fuzzy-connectedness principles. IEEE Transactions on Medical Imaging. 1997;16(5):598–609. [DOI] [PubMed] [Google Scholar]
- 30.Soille P Morphological Image Analysis: Principles and Applications: Springer-Verlag New York, Inc; 2003. [Google Scholar]
- 31.Polman CH, Reingold SC, Edan G, et al. Diagnostic criteria for multiple sclerosis: 2005 revisions to the “McDonald Criteria”. Annals of Neurology. 2005;58(6):840–6. [DOI] [PubMed] [Google Scholar]
- 32.Bland JM, Altman D. Statistical methods for assessing agreement between two methods of clinical measurement. The lancet. 1986;327(8476):307–10. [PubMed] [Google Scholar]
- 33.Commowick O, Cervenansky F, Ameli R. MSSEG Challenge Proceedings: Multiple Sclerosis Lesions Segmentation Challenge Using a Data Management and Processing Infrastructure. MICCAI, 2016; 2016. Athènes, Greece: http://www.hal.inserm.fr/inserm-01397806/documenthttp://www.hal.inserm.fr/inserm-01397806/file/MSSEG_Challenge_Proceedings.pdf. [Google Scholar]
- 34.Fartaria MJ, Bonnier G, Roche A, et al. Automated detection of white matter and cortical lesions in early stages of multiple sclerosis. Journal of Magnetic Resonance Imaging. 2016;43(6):1445–54. [DOI] [PubMed] [Google Scholar]
- 35.Valverde S, Cabezas M, Roura E, et al. Improving automated multiple sclerosis lesion segmentation with a cascaded 3D convolutional neural network approach. NeuroImage. 2017;155:159–68. [DOI] [PubMed] [Google Scholar]
- 36.Brosch T, Tang LY, Yoo Y, et al. Deep 3D Convolutional Encoder Networks With Shortcuts for Multiscale Feature Integration Applied to Multiple Sclerosis Lesion Segmentation. IEEE transactions on medical imaging. 2016;35(5):1229–39. [DOI] [PubMed] [Google Scholar]
- 37.Jain S, Sima DM, Ribbens A, et al. Automatic segmentation and volumetry of multiple sclerosis brain lesions from MR images. NeuroImage: Clinical. 2015. [DOI] [PMC free article] [PubMed] [Google Scholar]
- 38.Tomas-Fernandez X, Warfield SK. A model of population and subject (MOPS) intensities with application to multiple sclerosis lesion segmentation. 2015. [DOI] [PMC free article] [PubMed]
- 39.Datta S, Narayana PA. A comprehensive approach to the segmentation of multichannel three-dimensional MR brain images in multiple sclerosis. Neuroimage Clin. 2013;2:184–96. [DOI] [PMC free article] [PubMed] [Google Scholar]
- 40.Shiee N, Bazin PL, Ozturk A, et al. A topology-preserving approach to the segmentation of brain images with multiple sclerosis lesions. Neuroimage. 2010;49(2):1524–35. [DOI] [PMC free article] [PubMed] [Google Scholar]
- 41.Schmidt P, Gaser C, Arsic M, et al. An automated tool for detection of FLAIR-hyperintense white-matter lesions in Multiple Sclerosis. Neuroimage. 2012;59(4):3774–83. [DOI] [PubMed] [Google Scholar]


