

Abstract
Pancreatic ductal adenocarcinoma (PDAC), like many KRAS-driven tumors, preferentially loses CDKN2A that encodes an endogenous CDK4/6 inhibitor to bypass the RB-mediated cell cycle suppression. Analysis of a panel of patient-derived cell lines and matched xenografts indicated that many pancreatic cancers have intrinsic resistance to CDK4/6 inhibition that is not due to any established mechanism or published biomarker. Rather, there is a KRAS-dependent rapid adaptive response that leads to the upregulation of cyclin proteins, which participate in functional complexes to mediate resistance. In vivo, the degree of response is associated with the suppression of a gene-expression signature that is strongly prognostic in pancreatic cancer. Resistance is associated with an adaptive gene expression signature which is common to multiple kinase inhibitors, but is attenuated with MTOR inhibitors. Combination treatment with MTOR and CDK4/6 inhibitors had potent activity across a large number of patient derived models of PDAC underscoring the potential clinical efficacy.
Keywords: E2F, Retinoblastoma, Cyclin D1, Cyclin E, KRAS, Pancreatic cancer
Introduction:
Pancreatic ductal adenocarcinoma (PDAC) has the worst prognosis of common solid tumors with a 5-year survival of less than 10%4, 6, 24, 26, 44. Despite multitude of novel anticancer drugs tested in clinical trials, only very few targeted therapies have shown efficacy superior to that observed with combination chemotherapy34. This likely reflects the complex genetic underpinnings of PDAC and vast intertumor and intratumor heterogeneity.
One of the common genetic events that occurs in multiple KRAS-driven tumors is loss of the endogenous CDK4/6 inhibitor CDKN2A 4, 9, 47. Loss of CDKN2A is commonly observed in PDAC, but also occurs in colorectal, non-small-cell lung carcinoma, and melanoma that exhibit oncogenic RAS mutation 2, 45. In these tumors it has been hypothesized that CDKN2A loss represents an important event that allows bypass of KRAS-induced senescence 3, 40.
The degree of response to pharmacological CDK4/6 inhibition in RAS-driven preclinical models and human cancers has been surprisingly variable. In non-small-lung carcinoma, it was observed that CDK4/6 inhibition was more effective in KRAS mutated tumors compared to wild-type counterparts 36. Similarly, it has been shown that CDK4/6 inhibition is active in NRAS melanoma models and is able to induce durable responses in this aggressive and often therapy resistant subset of melanoma 30. In pancreatic cancer models data has been variable. Although CDK4/6 inhibitors showed single-agent activity in several studies 7, 16, 46, inherent resistance was also observed7, 13, 14, 21. Here we performed a detailed investigation of pharmacological CDK4/6 inhibition in a large suite of patient-derived PDAC models with the goal of leveraging the biology of CDKN2A to increase therapeutic response. This data uncovered significant adaptive responses and cell cycle plasticity, which limit activity of pharmacological CDK4/6 inhibitors in many pancreatic cancers. However, this analysis also shed light on how combination therapies enforce durable therapeutic responses that could have significance to multiple tumor types.
Results:
Variant response to CDK4/6 inhibition in PDAC models:
In order to understand the response of PDAC to CDK4/6 inhibition, we employed a panel of 16 patient-derived cell lines that reflect the genetic diversity of pancreatic cancer (Fig 1A). The cell lines and corresponding patient tumors were molecularly characterized by whole exome and RNA sequencing and demonstrated preservation of genomic characteristics between patient tumors and derived models 27, 48. These models recapitulate the genetic features of pancreatic cancer as observed in the analysis of clinical cases within the TCGA. The cell lines contain discrete KRAS mutations (94% of the cases) at frequencies consistent with that observed in patient tumors (Fig S1A) and exhibit gene expression profiles representative of pancreatic cancer molecular sub-types that have been identified through the analysis of clinical specimens (Fig S1A) 5, 8. From RNA sequencing analysis, approximately 60% of these cell lines lack expression of CDKN2A, which is consistent with the deletion or epigenetic silencing commonly present in PDAC (Fig 1B). Additionally, the gene expression levels of CDK4, CDK6, and cyclin D1 are significantly higher than CDK2, cyclin E1 and cyclin A, suggesting that the CDK4/6-signaling axis is highly engaged in these tumors. Treatment with increasing doses of the CDK4/6 inhibitor palbociclib yielded variable degrees of cell cycle inhibition as determined quantitatively by BrdU incorporation. The 7310 cell line that harbors an RB1 deletion was completely refractory to palbociclib, while a range of responses were observed in RB1 proficient cell lines (Fig 1C and Fig S1B). These differences in response were not associated with hallmark genetic alterations of PDAC (e.g., TP53, SMAD4 or CDKN2A) or the gene expression levels of KRAS, RB1, CCND1, or CCNE1 that have been reported to modify response to CDK4/6 inhibition in various tumor types 7, 22, 43. Even in the models with the highest degree of cell cycle arrest induced by palbociclib (e.g., 828), the cells could divide as determined by live cell imaging (Fig 1D and Fig S1B). In contrast, cell division was blocked in ER-positive breast cancer models treated with CDK4/6 inhibitors (Fig S1C). Together these findings suggest that although PDAC exhibit frequent loss of CDKN2A, a negative regulator of CDK4/6, the response to pharmacological blockade of CDK4/6 can be bypassed.
Figure 1. Primary patient derived cell lines exhibit differential sensitivity to CDK4/6 inhibition:
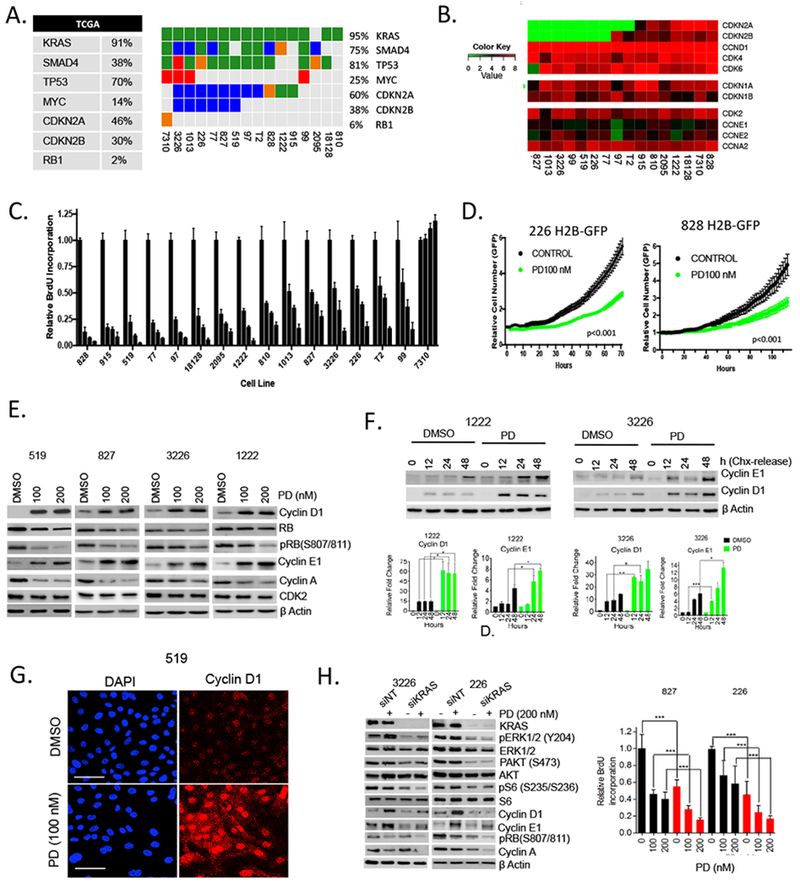
(A) The genetics of the employed cell models are summarized in the oncoprint (somatic single nucleotide variant: green, homozygous deletion: blue, small insertion/deletion: orange, amplification: red). The percent aberrations of the same genes as reported in the TCGA PDAC cohort is provided in the table. (B) The cell lines were subjected to RNA sequencing and the log2-normalized transcript levels for the indicated genes are shown. (C) The indicated cell lines were treated with increasing dose of palbociclib (PD) (0, 100, 250, 1000 nM). Forty-eight hours post-treatment cells were labeled with BrdU and the relative incorporation was determined. All experiments were performed in triplicate with multiple wells measured. Bars indicate the means and standard-deviation. (D) The indicated pancreatic cancer cell lines expressing H2B-GFP were treated with 100 nM palbociclib and proliferation was determined by live cell imaging. (E) Immunoblot analysis of the indicated proteins from 519, 827, 3226 and 1222 cell lines that were treated with palbociclib (PD) for 48 hours. (F) Cyclin D1 and cyclin E1 levels were determined at the indicated time points following CHX release in 1222 and 3226 cell lines. Cells were pre-treated with palbociclib (200 nM). Protein expression was analyzed by western blotting, with actin level used as loading control and the band intensities were quantified. The mean and SD are shown (*p< 0.5, **p < 0.01, ***p < 0.001 as determined by t test). (G) Immunofluorescence staining of cyclin D1 in 519 cell line following 48 hours exposure with palbociclib (scale bar 50 μm). (H) Immunoblot and BrdU analysis from the indicated cell lines that were transfected with KRAS (red bars) or non-target (black bars) RNAi in the presence and absence of palbociclib (PD). The mean and SD are shown (*p<0.05, **p<0.01, ***p < 0.001 as determined by t test).
Cyclin D1 and E1 induction as an adaptive response to CDK4/6 inhibition:
To delineate the mechanisms of resistance, the levels of multiple CDKs and cyclins that drive the G1/S cell cycle transition were evaluated (Fig 1E, Fig S1D and Fig S1E). Treatment with palbociclib resulted in decreased RB phosphorylation compared to baseline, and there was a decrease in cyclin A. In contrast, the protein levels of cyclin D1 and cyclin E1 were strongly elevated as a consequence of treatment with palbociclib. These adaptive events occurred even with very high-levels of palbobiclib (1 μM), and kinetically paralleled the partial effect of CDK4/6 inhibition on RB phosphorylation (Fig S1D and FigS1E). Similar increases in cyclin D1 and cyclin E1 were observed with the structurally distinct CDK4/6 inhibitor abemaciclib (Fig S2A) and were dependent on the presence of RB, as this response was not observed in the RB1 gene deficient 7310 model (Fig S2B). To investigate the mechanism underlying increase in cyclin D1 and cyclin E1 protein levels we initially analyzed CCND1 and CCNE1 gene expression by RNA sequencing. There was not a significant change in transcript levels with palbociclib treatment across the evaluated models (Fig S2C). Similarly, the protein stabilities of cyclin D1 and cyclin E1 was not significantly changed upon CDK4/6 inhibition (Fig S2D). However, we found that the synthetic rates for cyclin D1 and cyclin E1 were enhanced in cells pre-treated with palbociclib (Fig 1F) and the proteins accumulate in the nucleus (Fig 1G and S2E). It has been reported that both cyclin D1 and cyclin E1 synthesis are driven by mitogenic signaling 12; however, the impact of CDK4/6 inhibition on regulation of mitogenic signaling pathways remains controversial 14, 19, 49, 51. We found that MEK inhibition (Trametinib) or MTOR1/2 inhibition (TAK228) have canonical effects on gene expression programs related to MEK (DUSP6 and ETV4) and MTOR (ALDH3A1 and ACAT2) respectively (Fig S2F). Palbociclib treatment did not significantly inhibit these signaling pathways as determined by the analysis of transcriptional targets as well as immunoblotting for canonical pathway substrates, ERK1/2 and S6 (Fig S2F). Thus, mitogenic signaling pathways remain engaged in the presence of CDK4/6 inhibition and potentially limit anti-proliferative activity. To define the potential role of KRAS signaling in driving resistance in pancreatic cancer, we employed knockdown of KRAS (Fig 1H). The depletion of KRAS elicited expected reductions in the activity of main effector pathways (ERK, AKT, and MTOR) as determined by measuring canonical down stream substrates (pERK, pAKT, and pS6, respectively). KRAS depletion by itself had a limited effect on RB phosphorylation and cyclin A expression; however, it blunted the induction of cyclin D1 and cyclin E1 that occurs with CDK4/6 inhibition and elicited significant cooperation in suppressing cell cycle. These findings indicate that the KRAS pathway participates in the adaptive response that drives resistance to CDK4/6 inhibition.
The increase in cyclin E1 and cyclin D1 levels is potentially relevant for driving cell cycle progression in the presence of CDK4/6 inhibition. However, these cyclins conventionally require complex formation to impact on biological functions. Using co-immunoprecipitation we found that cyclin D1 and cyclin E1 were associated with their canonical CDK partners, and there was no evidence for atypical complexes that could explain resistance (Fig 2A). The accumulated CDK4 complexes were also capable of binding to p21 and p27 more effectively than CDK2 complexes, suggesting that CDK2 activity remains relatively high in the PDAC cells treated with palbociclib (Fig S3A). Kinase assays from treated cells confirmed that detectable CDK2 activity was present in palbociclib treated cell lysates that retain the CDK2 protein (Fig 2A and 2B). Knockdown experiments with CDK2 specific RNAi showed dramatic cooperation with palbociclib in arresting cell cycle underscoring the importance of CDK2 complexes in attenuating responses to CDK4/6 inhibition (Fig 2C and S3B). Similar, yet less potent effects, were observed with cyclin E1 knockdown (Fig S3C). Depletion of CDK2 resulted in potent suppression of RB phosphorylation and reduced levels of cyclin A that correlated with suppression of BrdU incorporation. Thus, the activation state of CDK2 represents a critical determinant for responsiveness to CDK4/6 inhibition. To evaluate the role of cyclin D1, knockdown studies with cyclin D1 specific RNAi were performed and showed potent cooperation with palbociclib (Fig 2D and S3D). These data suggest that the ability of cyclin D1 to form complexes in the presence of CDK4/6 inhibition is a critical determinant of resistance. To further interrogate the overall impact of cyclin D1-CDK4/6 complex formation on resistance to pharmalogical CDK4/6 inhibition, the endogenous CDK4/6 inhibitor p16ink4a, which in addition to inhibiting catalytic activity of CDK4/6 competes for complex assembly39, was employed using adenoviral delivery. The expression of p16ink4a elicited potent cell cycle inhibition that cooperated with palbociclib (Fig 2E). Additionally, p16ink4a expression elicited the suppression of CDK4 phosphorylation on T172 which denotes active/assembled complexes37 (Fig 2F), while palbociclib had little impact on CDK4 phosphorylation (Fig 2F and S3E). These data indicate that one of the key differences between the pharmacological and physiological inhibition of CDK4/6 is the impact related to the utilization of cyclin D1 in complexes.
Figure 2: Accumulated cyclins form complexes and contribute to resistance to CDK4/6 inhibition:
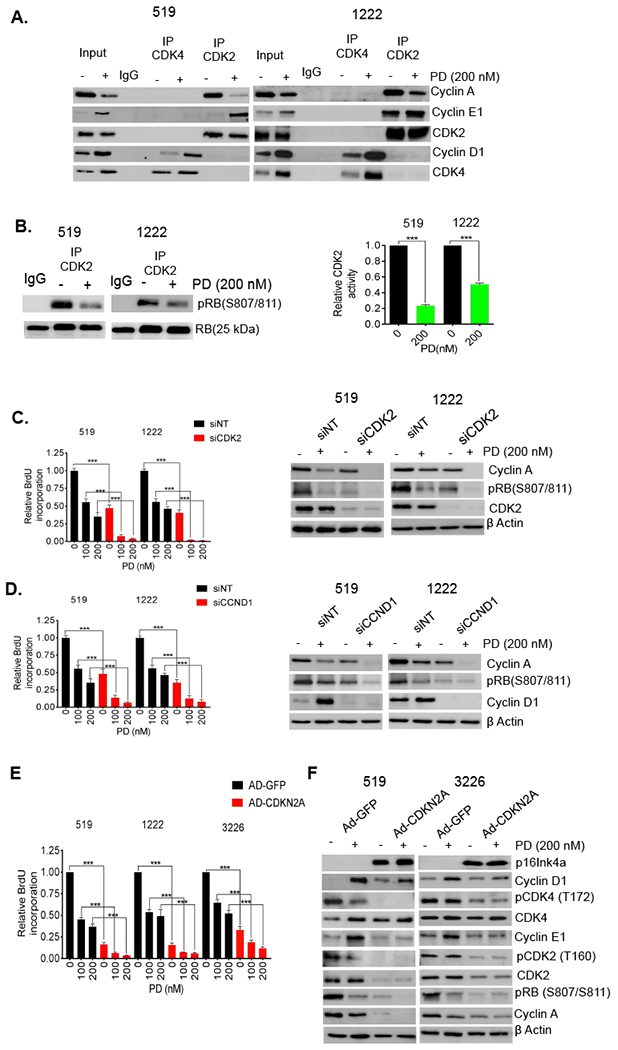
(A) Immunoprecipitation of CDK4 and CDK2 from 519 and 1222 cell lines that were exposed to PD0332991 (200 nM) up to 48 hours. Co-immunoprecipitated cyclin A, cyclin E1 and cyclin D1 were determined by immunoblotting. (B) In vitro CDK2 kinase assays were performed using lysates from 519 and 1222 cell lines that were treated with palbociclib (PD) (200 nM). Kinase activity was evaluated based on phosphorylation of an RB substrate at Ser807/811. Representative blot images and mean and SD are shown (***p < 0.001 as determined by t test) (C) 519 and 1222 cell lines were transfected with CDK2 and non-targeting (NT) RNAi and treated with DMSO or palbociclib (PD) for 72 hours. Knockdown of CDK2 inhibited BrdU incorporation and this effect was enhanced upon the treatment with palbociclib (PD). The mean and SD are shown (***p < 0.001 as determined by t test). (D) BrdU incorporation assay and immunoblot analysis for 519 and 1222 cell lines that were transfected with CCND1 and non-target (NT) RNAi in the presence and absence of palbociclib (PD). The mean and SD are shown (***p < 0.001 as determined by t test). (E) BrdU incorporation assay for 519, 1222 and 3226 cell lines that were infected with p16 and GFP expressing adenoviruses and treated with DMSO and PD0332991 for 72 h. The mean and SD are shown (***p < 0.001 as determined by t test). (F) Immunoblot analysis for the indicated proteins from 519 and 3226 cell lines that were infected with CDKN2A and GFP expressing adenoviruses in the presence and absence of palbociclib (PD).
In vivo diversity of response to CDK4/6 inhibition:
Since the findings from the cell culture models may not fully recapitulate the responses observed in vivo, we employed a panel of PDX models that match the cell lines utilized in functional studies. Consistent with other reports 7, 46, palbociclib significantly reduced tumor growth in most models; however, over the course of 21 days many tumors started to progress on treatment (Fig 3A and S4A). The degree of response in the PDX models largely correlated with effects observed in cell culture (Fig S4B). Analysis of hallmark genetic features and molecular subtypes of PDAC (Fig S4C), as well as baseline expression of genes previously implicated in modulating responses to CDK4/6 inhibition (e.g. RB1 levels)7, did not yield predictors of the response (Fig S4D). Mining the correlation of individual genes with response yield genes whose baseline expression associated with response (e.g. FLG and SMAD9); similarly using the elastic net statistical approach genes associated with response could be identified (Fig S4D). These genes did not fall within discrete pathways that would inform biological processes associated with sensitivity in the PDX models. In contrast with the absence of predictive marker, the magnitude of Ki67 suppression varied across PDX models (Fig 3B) with larger reduction in Ki67 levels correlating with improved disease control (Fig 3C). Consistent with findings in cell culture, upregulation of cyclin D1 and cyclin E1 was also observed in PDX models by immunohistochemical staining of tumor sections (Fig 3D).
Figure 3. Response to CDK4/6 inhibition in vivo is associated with reduced proliferative index:
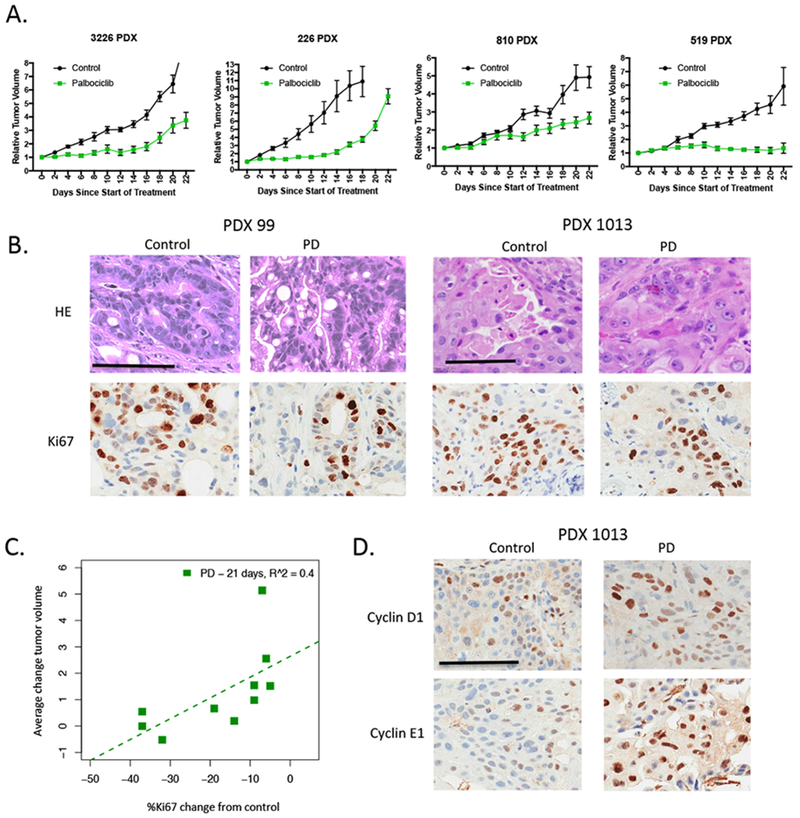
(A) The indicated PDX models were randomized for treatment with vehicle or palbociclib when tumor volume reached ~200 mm3. Tumors were treated for 21 days and tumor volume was monitored. Data shows the mean and standard error of the mean. Greater than n=5 mice were treated for each condition. For all PDX models the effect of palbociclib was significant for reducing tumor size (p<0.01). (B) Tumors from treated mice were stained for Ki67. Representative images are shown (scale bar=100 μm). (C) The average difference in Ki67 from the control and palbociclib treated mice was determined at 21 days and related to the average change in tumor volume. There is a significant relationship between change in Ki67 and response to palbociclib (p<0.05). (D) Increase in cyclin D1 and cyclin E1 levels was observed in palbociclib (PD) treated PDXs. Representative images of immunohistochemical staining are shown (scale bar=100 μm).
Signatures of CDK4/6 response in PDAC clinical prognosis and adaptive resistance:
In recognition that complex biological processes, as drug responses, are associated with changes in multiple signaling pathways rather than single genes, we performed analysis of transcriptional networks. RNA sequencing comparing control and palbociclib treated tumors identified a large number of pathways that were suppressed upon treatment with palbociclib in vivo. These included expected cell cycle regulatory pathways (DNA-replication and mitotic processes) as well as effectors of transcription and splicing (Fig 4A, Supplemental Data 1). In more resistant models (e.g., 827 PDX) the magnitude of the transcriptional repression over cell cycle events was significantly reduced compared to more sensitive models (e.g., 99 PDX) (Fig 4B and S5A). In the course of these studies, we also noted several tumors that acquired more rapid resistance than others in the same cohort. Analysis of these tumors revealed selective deregulation of multiple genes involved in cell cycle progression (Fig S5B). Together, these data suggest that transcriptional repression is critical for therapeutic response, and acquisition of resistance is associated with bypass of transcriptional repression. A signature of potent transcriptional repression mediated by CDK4/6 inhibition across PDX models was identified (Fig 4C, Supplemental Data 2). This signature exhibited discrete expression levels within the TCGA pancreatic cancer cohort and high-levels of these cell cycle genes was associated with poor overall survival (Fig 4D). Together, these data suggest that the pharmacological or biological suppression of cell cycle associated genes would be expected to delay the progression and ultimate mortality associated with PDAC.
Figure 4. Gene expression features of response to CDK4/6 inhibition are prognostic in PDAC:
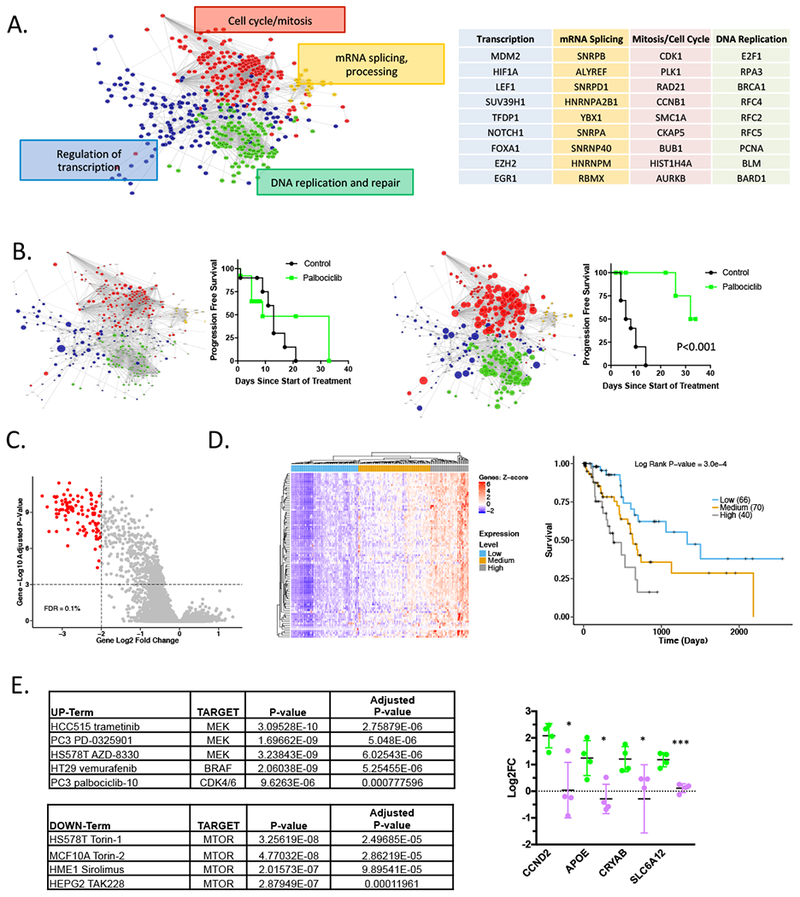
(A) RNA sequencing analysis comparing control and palbociclib treated tumors demonstrate a complex series of networks that are repressed with palbociclib treatment. The principle network terms and examples of genes within the network are summarized. (B) The progression free-survival for a relatively resistant (827 PDX) and responsive (99 PDX) models are shown. Significance was determined using the log-rank statistical test. The size of the symbols denotes the relative repression within the indicated network. (C) Gene expression from all control and palbociclib treated PDX models was evaluated. Genes with a 2 log-fold change greater than 2 and a FDR greater than 0.1% were determined to be significantly altered with palbociclib treatment. (D) The expression signature of palbociclib inhibition was applied to the TCGA pancreatic cancer cohort. Heatmap shows unsupervised clustering based on the significant genes identified in the PDX models. The Kaplan-Meier analysis is for overall survival based on the major nodes of the heatmap as indicated. (E) Gene upregulated greater than 2-fold in 5 of the relatively resistant models, identified 99 genes. This signature was significantly associated with responses to the indicated kinase inhibitors as determined using ENRICHR. The indicated genes evaluated in multiple PDX models treated with palbociclib (green) or the combination with TAK228 (purple). The mean and SD are shown (*p<0.05, **p<0.01, ***p < 0.001 as determined by t-test).
In order to identify drivers of adaptive responses to CDK4/6 inhibition, a panel of relatively resistant PDX models were analyzed for genes that were selectively upregulated as a consequence of CDK4/6 inhibition. A subset of genes were induced on average greater than 2-fold were identified. Although these genes were not strongly enriched for gene-ontology or pathways (not shown), they were strongly associated with the gene sets of response to kinase inhibition (Library of Integrated Network-based Cellular Signatures). Notably, MEK and BRAF inhibitors as well as other kinase inhibitors (including CDK4/6 inhibitors in other models) result in the upregulation of this gene set. In contrast, these genes are attenuated as a response to MTOR inhibition (Fig 4E). To test the hypothesis that MTOR inhibition could attenuate this adaptive responses underlying resistance, we evaluated genes that were strongly induced in the presence of palbocicib vs. the combination of palbociclib+TAK228 in the PDX models (Fig 4F). In this context, the adaptive gene expression was suppressed. These data suggest that there is a relatively common adaptive response to cytostatic kinase inhibitors, that is ameliorated by MTOR inhibition.
MTOR signaling promotes cyclin synthesis and resistance in PDAC models:
Since MTOR signaling plays an evolutionarily conserved role in coordinating the activity of CDKs to facilitate the G1/S transition 31, we evaluated the impact of the dual TORC1/2 inhibitor TAK228 on synthesis of cyclin D1 and cyclin E1. The treatment with TAK228 prevented the rapid accumulation of both cyclin D1 and cyclin E1 in palbociclib treated cells following release from cycloheximide block (Fig 5A). Using live cell imaging we found that the combination of TAK228 with palbociclib significantly suppressed proliferation (Fig 5B). To parse the relative contributions of TORC1 and TORC2 to observed effect on cell cycle regulatory proteins, we employed knockdown of Raptor and Rictor, respectively (Fig 5C). These data showed that Raptor knockdown had impact on cyclin D1 and cyclin E1 levels in a model specific setting, suggesting that TORC1 is relevant for induction of cyclin D1 and cyclin E1 (Fig 5C). However, the composite knockdown of Raptor and Rictor had a more significant and consistent effect across the evaluated cell models. Immunoblot analysis showed that combinatorial treatment with TAK228 and palbociclib diminished cyclin D1 and cyclin E1 levels, elicited pronounced suppression of RB phosphorylation, and blocked cyclin A expression (Fig 5D). The effects on protein levels were not associated with suppression of either cyclin D1 or cyclin E1 transcription, consistent with a mechanism impacting on protein synthesis, while cyclin A is subjected to enhanced transcriptional repression (Fig 5E), under these conditions there are diminished levels of CDK2 protein (Fig S6A). Across multiple cell lines we observed synergistic suppression of cell cycle with the combination of palbociclib and TAK228 that did not occur in RB-deficient 7310 cell model (Fig 5F, S6B, S7C). These responses were associated with potent suppression of CDK2 activity (Fig 5G), presumably due to both down-regulation of cyclins and CDK2 protein levels. Enhanced repression of critical cell cycle target genes was also observed (Fig 5H). Thus, suppression of MTOR activity cooperates with CDK4/6 inhibition to elicit potent cell cycle inhibition across all evaluated RB-proficient PDAC cell line models.
Figure 5. Cooperation between MTOR and CDK4/6 inhibition:
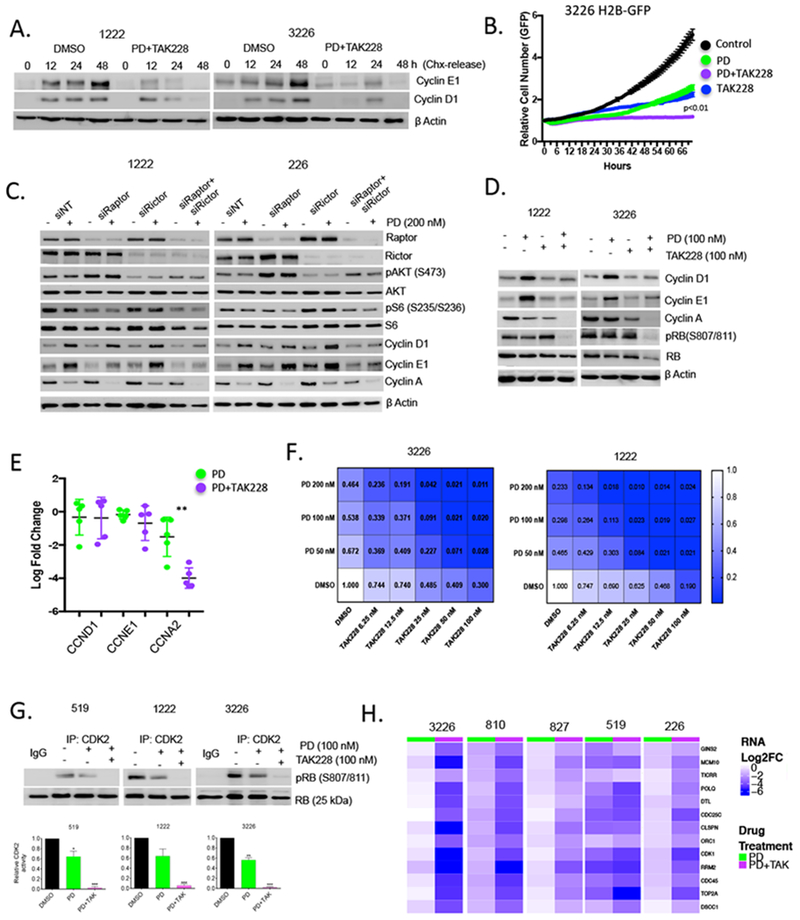
(A) Levels of cyclin D1 and cyclin E1 after cycloheximide (CHX) were evaluated at the indicated times in 1222 and 3226 cell lines with vehicle control or palbocicib (PD) (100 nM) + TAK228 (100 nM). Protein expression was analyzed by immunoblotting, with actin levels used as loading control. (B) Live cell imaging of cells treated with DMSO, palbocicib (PD) (100 nM), TAK228 (100 nM), or the combination. The cell number was determined as a function of time as indicated. (C) Knockdown of Raptor and Rictor was performed by RNAi transfection in 1222 and 226 cell lines that were then treated with palbocicib (PD) (200 nM) for 48 hours. Immunoblot analysis of the indicated proteins further confirmed the efficacy of the knockdowns. (D) Effect of palbocicib (PD) (100 nM) +/− TAK228 (100 nM) on cell-cycle regulatory proteins in 1222 and 3226 cell lines was determined by immunoblotting. (E). Gene expression analysis for CCND1, CCNE1 and CCNA2 was performed using RNA sequencing data from 5 cell lines. The mean and standard deviation are shown (**p<0.01 as determined by t-test) (F). Isobologram analysis showing dose-response relationship with both palbociclib (PD) and TAK228. Heatmaps depict relative level of BrdU incorporation at 48 hours post treatment. Blue shading is associated with response, inset numbers show the fractional BrdU incorporation relative to DMSO control. (G) In vitro CDK2 kinase assay in 519, 1222 and 3226 cell lines that were treated with palbocicib (PD) (100 nM) +/− TAK228 (100 nM) for 48 hours. The kinase activity of CDK2 was evaluated based on the phosphorylation status of RB at S807/811, which was determined by immunoblotting and the band intensities were quantified. The mean and SD are shown (*p < 0.05, **p < 0.01, ***p < 0.001 as determined by t-test. (H). Heatmaps show the relative transcriptional repression achieved with palbociclib (PD) alone versus palbociclib+TAK228 in the indicated cell line models.
Coordinate targeting of MTOR and CDK4/6 in PDX models:
To further interrogate the therapeutic efficacy and toxicity profiles, PDX models were treated with the combination of palbociclib and TAK228 for 21 days (Fig 6A). Under the conditions employed there were no clear drug-specific toxicities/lethalities, and no significant loss of mouse weight (Fig S6D). However, the combination elicited profound increase in disease control across the majority of models. Even in a model with an exceptional response to palbociclib (99 PDX), the combination with TAK228 resulted in further suppression in tumor size on treatment, and delayed the progression of the tumor with cessation of treatment (Fig 6B). Composite data analysis from all treated models indicated that combinatorial treatment significantly increased progression free survival as determined by Kaplan-Meier analysis (Fig 6C). As observed in the cell lines, the increase in cyclin D1 and cyclin E1 levels was ameliorated in PDX models with addition of MTOR inhibition (Fig S7A), without associated changes in transcript level (Fig 6D). Thus, post-transcriptional regulation of cyclin D1 and cyclin E1 appear to be critical both in vitro and in vivo. In vivo, the combination of TAK228 with palbociclib yielded enhanced suppression of Ki67 proliferation index, which was associated with improved disease control (Fig 6D and S7A). Gene expression analysis revealed that the combination of TAK228 with palbociclib exhibited enhanced suppression of cell cycle genes (Fig 6E and S7B), but also inhibited core metabolic functions as determined by gene set variance analysis (Fig S7C). Kinome profiling using MIB/Mass-spectrometry 11 revealed that addition of TAK228 results in the activation of a number of kinases that promote adaptive responses to MTOR inhibition (e.g., IGF1R) 38 providing insights into potential mechanism of resistance that could emerge (Fig 6G). However, treatment with TAK228 reduced activity of RPS6KA1, and multiple additional kinases that have been attributed to aggressive pancreatic cancer phenotypes (e.g., PTK6, and MAP3K5) 17, 33 were only inhibited with the inclusion of TAK 228. Together these data indicate that inhibition of MTOR signaling plays a crucial role in suppressing adaptive signaling pathways that contribute to resistance with CDK4/6 inhibition (Fig 6H).
Figure 6. Combination of MTOR and CDK4/6 inhibition leads to durable disease control in PDX models:
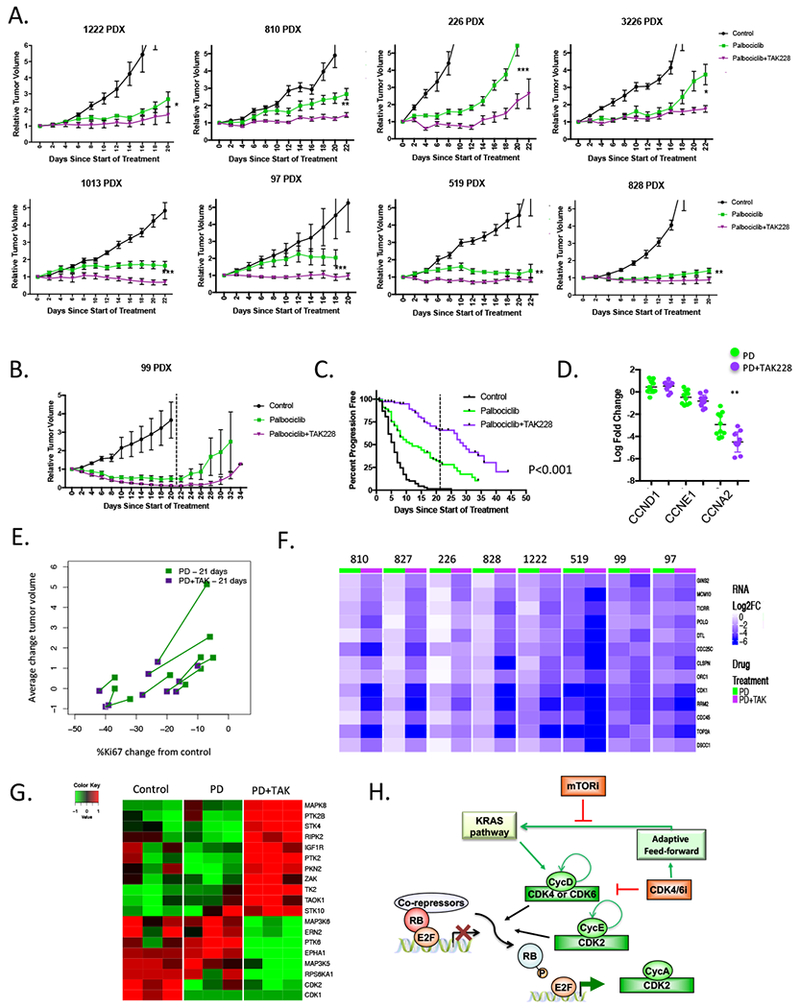
(A) The indicated PDX models were randomized for treatment with vehicle, palbociclib, or palbociclib+TAK228 when tumor volume reached ~200 mm3. Tumors were treated and tumor volume was monitored every 48 hours. Data shows the mean and standard error of the mean. Greater than n=5 tumors mice were treated for each condition. For multiple PDX models the effect of combination was significant relative to palbociclib alone (*p<0.05, **p<0.01, ***p<0.001). (B) The 99 PDX model was treated with vehicle, palbociclib, or palbociclib+TAK228 for 21 days. Tumor volume was measured beyond the cessation of treatment (indicated by the dashed line). (C) Progression free survival (where progression represented a 50% increase in tumor volume) was determined for all tumors that were treated (control, n=99; palbociclib, n=113; palbociclib+TAK228, n=111). The combination of palbociclib and TAK228 resulted in improved progression free survival that was significant as determined by log-rank statistical analysis. (D) Gene expression analysis from independent PDX models treated with palbociclib or palbociclib and TAK228 showing transcript levels of CCND1, CCNE1 and CCNA2. The log-fold change is shown relative to vehicle control (**p<0.001). (E) The average fold change in Ki67 and average change in tumor volume is shown for palbociclib or palbociclib and TAK228. The same PDX model is connected by the line, demonstrating the per-model effect of the combination relative to single agent palbociclib. (F) Heatmaps show the relative log-fold change of the indicated genes with palbociclib alone vs. palbociclib+TAK228. (G) Heatmaps of relative levels of the indicated kinases recovered by MIB-mass spectrometry in vehicle control, palbociclib and palbociclib with TAK228 treated tumors from the 519 PDX model. (H) Schematic of the network between CDK4/6 inhibition, MTOR and the expression of cyclins associated with intrinsic resistance.
Discussion:
Pancreatic cancer is a therapy recalcitrant disease for which targeted therapies have generally underperformed relative to combination chemotherapy34. Here we interrogated the use of CDK4/6 pharmacological inhibition for the treatment of PDAC. Despite the known activation of CDK4/6-Cyclin D pathway in PDAC, pancreatic cancer models were surprisingly resistant to CDK4/6 inhibitor treatment and, in many cases, exhibited potent adaptive responses that contribute to relatively weak disease control. In palbociclib treated PDAC models there was a rapid increase in cyclin D1 and cyclin E1 protein synthesis rate that was associated with preserved signaling through the KRAS-pathway. These responses were present both in vitro and in vivo and the ability to elicit a pronounced suppression of DNA replication genes was a critical determinant of response. MTOR activity played a key role in these adaptive responses and combination treatment with MTOR and CDK4/6 inhibitors elicited durable disease control across multiple patient-derived models.
Adaptive response to CDK4/6 inhibition:
Progressively more studies have interrogated the influence of pharmacological CDK4/6 inhibition on tumor biology 28, 42. Work from multiple laboratories have found that RB loss is associated with intrinsic resistance to these agents15, 18. While this event is rare in pancreatic cancer, as expected, the growth of RB-deficient PDAC cell line was not even transiently inhibited by palbociclib. Although it has been proposed that RB levels are associated with CDK4/6 sensitivity 7, we did not observe this relationship in our work. Additionally, in general PDAC, express levels of RB comparable with luminal breast cancers (not shown), which are very sensitive to CDK4/6 inhibition. Recently published studies have suggested that molecular configurations indicative of dependence on cyclin D1 track with responsiveness in preclinical models 20. While PDAC exhibit specific hallmarks of responsiveness (e.g., relatively high levels of cyclin D1, low levels of cyclin E1, and loss of CDKN2A), there is a surprisingly transient response to CDK4/6 inhibition. This feature is ostensibly not quite as simple as the presence of activated RAS oncogene, as NRAS mutated melanomas and KRAS mutated non-small-cell lung carcinoma models appear to be considerably more sensitive to CDK4/6 inhibitors 36, 49. Here we find that a key feature underlying the limited responses in PDAC is the synthetic induction of cyclin D1 and cyclin E1 protein levels. That cyclin D1 levels could contribute to resistance to CDK4/6 inhibitors would appear paradoxical; however, it is likely that assembled complexes can titrate inhibitory factors and allow ongoing cell cycle progression via CDK2 activity 41. Alternatively, it is possible that palbociclib cannot fully inhibit the assembled cyclin D1 containing complexes 35. Ectopic expression of p16ink4a exceeded the cytostatic action of palbociclib underscoring differences between pharmacological and physiological inhibitors. The induction of cyclin E1 occurred in parallel with the increase in cyclin D1 in all evaluated PDAC cell line and PDX models. This response is not generally not observed in other disease models, but could represent a key feature differentiating responsive tumors (e.g., ER positive breast cancer and melanoma) from more resistant tumor types (e.g., pancreatic and colon cancer). Importantly, the induction of cyclin expression is dependent on KRAS in the pancreatic cancer models, and thus KRAS is playing a role in mediating resistant to CDK4/6 inhibition. From our work, it is clear that the inhibition of CDK2 activity is a key downstream determinant of response, and that presumably even if CDK4/6 were effectively inhibited, the cell cycle could proceed based on the deregulation of CDK2. This hypothesis is consistent with the observations that the genetic amplification of CCNE1 is associated with resistance to CDK4/6 inhibition 22 and that even with genetic targeting of CDK4 and CDK6 cell cycle can proceed in mouse models 32. Thus, cell cycle plasticity and adaptive responses represent a limitation of the efficacy of pharmacological CDK4/6 inhibitors. Importantly, in a phase 1 study of single-agent CDK4/6 inhibitor inter-tumor differences in sensitivity were clearly observed in expansion cohorts and were not clearly associated with known defects in RB-pathway 36.
Role of MTOR in response to CDK4/6 inhibition:
The impact of CDK4/6 inhibitors on mitogenic signaling remains controversial 28. Conventionally, CDK4/6 is downstream from mitogenic signals and would be expected to have little effect on signaling. However, several studies have suggested that CDK4/6 inhibition will diminish or enhance MTOR or MEK signaling 19, 28, 43, 51. Here we found no evidence for an acute effect of CDK4/6 inhibition on either MTOR or MEK activity by both direct analysis of substrates and gene expression profiling. However, in resistant PDX models we identified an induced gene expression program that is observed with MEK inhibitors as well as other kinase inhibitors that induce cytostatic responses. This finding suggests that are certain common elements of the response to kinase inhibitors, which is interestingly suppressed by MTOR inhibition. Adaptive up regulation of cyclins is linked to sustained mitogenic signaling, and is dependent on KRAS and MTOR activity that facilitates the synthesis of both cyclin D1 and cyclin E1. Our study suggests that in the context of PDAC models, TORC1 is more important for eliciting the effects on cell cycle through enhanced synthesis of cyclin D1 and cyclin E1; however, TORC2 also appears to contribute as determined by co-depletion. Based on recent studies it would appear that targeting both TORC1 and TORC2 would be preferential for suppression of PDAC growth irrespective of CDK4/6 inhibition 10. It is also likely that in different tumor types or tumor cell populations there are distinct adaptive responses that allow for cell cycle plasticity and can bypass the action of CDK4/6 inhibitors. Thus, inhibiting TORC1 and TORC2 complexes regulating G1 cell cycle restriction checkpoints could represent a potent mechanism to enhance cytostatic activity of CDK4/6 inhibitors.
Necessity for combination therapy:
Presumably, adaptation to CDK4/6 inhibition represents a common mechanism, through which cells can partially evade loss of CDK4/6 catalytic activity. This hypothesis is supported by studies in genetically engineered mice, where proliferation can still occur in the absence of CDK4/6 or all D-type cyclins 29, 32. The mechanisms shown here would suggest that the levels of cyclin D1 and cyclin E1 are important for resistance, and therefore means to limit the expression of cyclins would be expected to increase efficacy. Similarly, the antitumor activity is associated with the depth of transcriptional repression of a host of genes that would be required for DNA-replication or mitotic progression. This group of genes includes regulators of CDK2 (e.g. CCNA2) and CDK1 (e.g. CCNB1). Thus, effective suppression of CDK4/6 leads to reduction in the activity of multiple down-stream CDK complexes. We observe that MTOR inhibition cooperates with CDK4/6 inhibition to enhance these transcriptional responses, presumably by enforcing more potent dephosphorylation/activation of RB. This could be occurring through multiple facets of MTOR function; however, the suppression of RPS6K kinase activity is particularly important in KRAS-driven tumors and could represent a critical target of cooperation 50. Irrespective of the precise mechanism, the combination of TAK228 and palbociclib resulted in durable responses in a wide-range of PDX models. Importantly, this combination also limited the evolution of resistant clones that arise in sensitive models under the selective pressure of single agent palbociclib. This finding suggests that means to enforce a potent cell cycle exit represents a potential mechanism to ameliorate acquired resistance, as most mutational or chromosomal instability events are dependent on DNA replication and mitosis 1. Thus, coordinated TORC1/2 and CDK4/6 inhibition represents a highly efficacious therapeutic regimen across a diverse representation of PDAC cases.
Materials and Methods:
Cell Culture and Therapeutic Agents:
Primary PDAC cell culture were grown in Keratinocyte SFM with 0.2 ng/mL EGF, 30 μg/mL bovine pituitary extract (Life Technologies, 10744019), and 2% fetal bovine serum on collagen coated (Millipore 08-115), tissue culture treated plates. Select cultures were transduced to express H2B-GFP as an independent measure for proliferation. Cells were treated with single agent or combination palbociclib, TAK228, abemaciclib, or everolimus at the indicated dose and treatment time. The TAK228 and palbociclib were obtained through the Cancer Therapy Evaluation Program. DMSO was used as vehicle.
Cell Proliferation and Toxicity Assays:
Treatment responses were measured using crystal violet staining or ELISA BrdU incorporation (Sigma 11669915001) as described by manufacturer. Cell Titer Glo was used to measure ATP levels and CyQuant was used to measure DNA content in treated cultures. Luminescence/fluorescence was read on a BioTek Synergy 2 plate reader. Live cell analysis was performed using 96-well collagen-coated tissue culture treated plates in IncuCyte S3 Live-Cell Analysis System (Essen Biosciences). Essen Bioscience software was used to quantify number of H2B-GFP positive cells per well and then normalized to starting cell number for each condition. Data was exported to Prism 7 (GraphPad) for statistical analysis and graph generation. Each drug treatment was carried out with multiples greater than six and verified in two independent experiments.
Knockdown experiments:
Cells were reverse transfected with siRNA using Dharmacon Human siGENOME siRNA: cyclin D1 (M-003210-05-0005), cyclin E1 (M-003213-02-0005), Raptor (L-004107-00-0005), Rictor (L-016984-00-0005) and non-targeting siRNA (D-001810-10-05) or CDK2 (ID# 103569) and CDK4 (ID# 103747) from Thermo Fisher. Transfection was performed using Lipofectamine RNAiMax Transfection Reagent (Invitrogen, 13778150) according to manufacturer’s protocol. Following 24-hour transfection, cells were incubated with palbociclib or vehicle control at the concentration and times indicated. Proliferation was determined using a chemiluminescent BrdU ELISA assay (Sigma 11669915001) as described by the manufacturer. Luminescence was read on a BioTek Synergy 2 plate reader. Parallel experiments were performed using immunoblot analysis in which cells were exposed to 200 nM palbociclib up to 48-hour following reverse transfection.
Immunoblot analysis:
Primary antibodies for immunoblot analysis that were purchased from Cell Signaling Technology include: p-RB (S807/S811) (8516S), RB (9313S) (p-Akt (S473) (4070S), Akt (4691), pS6 (S235/236) (2211), S6 (2217), cyclin E1 (4129S), p21 (2947S), p27 (2552S), CDK4 (12790), Raptor (2280S), Rictor (2140S), pCDK2 (T160) (2561S) and CDK2 (2546S). Antibodies from Santa Cruz Biotechnology include: actin (SC-47778), pERK (Y204) (SC-7383), ERK (SC-514302), cyclin D1 (SC20044), CDK2 (SC-6248) and cyclin A (SC-271682). Phospho-CDK4 (PA5-664482) antibody was purchased from Thermo Fisher. Anti-CDKN2A/p16INK4a antibody was purchased from Abcam. The whole-cell extracts were prepared by lysing the cells with RIPA lysis buffer (Santa Cruz Biotechnology, SC-24948A) in the presence of 1X Halt protease inhibitor (Thermo Fisher) and 1 mM PMSF (Sigma). The extracted proteins (20 μg) were resolved by SDS-PAGE and transferred to PVDF membranes, which were then incubated with primary antibodies at 4°C overnight, followed by incubation with HRP tagged anti-mouse or anti-rabbit secondary antibodies at room temperature up to 1 hour. An enhanced chemiluminescence kit (Thermo Fisher, 34076) was used to detect the immuno-reactive bands.
Protein stability and synthesis assays:
The stability of cyclin D1 and cyclin E1 was determined using cycloheximide (Santa Cruz Biotechnology; SC-3508) following 48-hour exposure with DMSO or 200 nM palbociclib and harvested at different time points. To determine the protein synthesis rates of cyclin D1 and cyclin E1, cells were treated with 200 nM palbociclib up to 24-hours and then exposed to cycloheximide (50 μg/ml) for 8-hours. Cells were then released from cycloheximide and harvested at 0-, 12-, 24- and 48-hours in the absence and presence of 200 nM palbociclib.
Immunoprecipitation:
Cells were lysed in immunoprecipitation lysis buffer (20 mM Tris-HCl pH 8.0, 2 mM EDTA, 137 mM NaCl, 1% NP-40) in the presence of 1X Halt protease inhibitor (Thermo Fisher) and 1 mM PMSF (Sigma). 0.5-0.8 mg of protein from the lysates were incubated with 5 μg of anti-CDK4 (Santa Cruz Biotechnology; SC-260) or anti-CDK2 (Santa Cruz Biotechnology; SC-6248) or with mouse IgG1 isotype control (Cell Signaling Technology, 5415) at 4°C overnight. Protein immunocomplexes were then incubated with protein G-agarose (Thermo Fisher) at 4°C up to 4 hour and were then washed 3 times with IP wash buffer (20 mM Tris-HcL, pH 8.0, 100 mM NaCl, 0.5% NP-40). Complexes bound to protein G-agarose were eluted using 2X SDS buffer and subjected to immunoblot analysis.
CDK2 kinase assay:
To analyze the CDK2 kinase activity, primary PDAC cells that were exposed to DMSO or palbociclib (200 nM) for 48 hour were lysed using the kinase lysis buffer (50 mM HEPES-KOH pH 7.5, 150 mM NaCl, 1 mM EDTA, 1mM DTT, 0.1% Tween-20) in the presence of 1X Halt protease inhibitor (Thermo Fisher) and 1 mM PMSF (Sigma). Active CDK2 complex was immunoprecipitated by incubating 300 μg of the lysate with 5 μg of anti-CDK2 (Santa Cruz Biotechnology; SC-6248) overnight at 4°C. Normal mouse IgG1 (Cell Signaling Technology, 5415) was used as a control. Protein G agarose-beads were added to each IP samples and incubated up to 4 hour at 4°C. Protein immunocomplexes were washed 3 times with the kinase lysis buffer and 2 times with kinase reaction buffer (40 mM Tris-HCl pH 8, 20 mM MgCl2, 0.1 mg/mL BSA, 50 μM DTT). Kinase reactions were carried out in 100 μl of kinase buffer in the presence of 100 μM ATP and 0.5 μg of bacterially purified RB C-terminal as substrate25 by gently shaking at room temperature up to 30 minutes. The resulting phosphorylated RB protein was detected by immunoblotting using anti-pRb (S807/S811) antibody (Cell Signaling Technology, 8516S).
Immunofluorescence:
Cells were plated on collagen-coated 8-well chambered slides and treated with 100 nM palbociclib as a single agent for 48 hours. At the end of the treatment, cells were washed with 1× PBS, fixed with 10% buffered formalin for 5 minutes and kept in blocking solution (5% BSA and 0.4% NP40 in PBS) for 30 minutes. Cells were then incubated with primary anti-cyclin D1 (Neomarker, RB-010-P1, Rabbit pAb, 1:100 dilution) and anti-cyclin E1 (Cell Signaling 4129S, Mouse mAb, 1:100 dilution) antibodies for 1 hour. Following primary antibody incubation, cells were washed with 1× PBS and incubated in secondary antibodies (Alexa Fluor 647 anti-rabbit/anti-mouse) for 1 hour. Finally, cells were mounted with Vectashield mounting media containing DAPI. Cells were then visualized with Leica S5 Confocal microscope using the 647 nm (RFP) laser.
Mice and Xenografts:
NSG (Jackson Laboratories) mice were maintained in the University of Arizona animal care facility. All animal care, treatment, and sacrifice were approved by the University of Arizona Institutional Animal Care and Use Committee (IACUC) in accordance with the National Institutes of Health (NIH) Guide for the Care and Use of Laboratory Animals. Mice were implanted subcutaneously with the early passage PDX tumor fragments. When tumors reached a volume of ~200 mm3 they were randomized to treatment cohorts. Mice were treated for 3 weeks by gastric gavage with vehicle control, single agent palbociclib (PD-0332991, 100 mg/kg) diluted in 50 mM lactate buffer at pH 4.0, or the combination of palbociclib with TAK-228 (0.5 mg/kg) diluted in 30% PEG400, 0.5% Tween 80, and 5% propylene glycol. Mice were treated daily for 5 days, followed by a 2-day break during 1st week, and then every other day during 2nd and 3rd weeks for a total treatment time of 3 weeks. Tumor size was assessed every 2 days using digital calipers. Mice were sacrificed at either 6 days of treatment, 21 days of treatment, or 2 weeks after the end of treatment.
Tissue Analysis:
Isolated tumor tissue was fixed in 10% neutral buffered formalin then processed and paraffin embedded. Specimens were sectioned at 4-6 μm and stained with hematoxylin and eosin or one of the following: cleaved caspase 3 (Cell Signaling, 9661), cyclin E1 (Abcam, ab3927), cyclin D1 (Santa Cruz, SC-20044), Ki67 (Leica, NCL-L-ki67-mm1), or pRb (Cell Signaling, 8516) using Leica Bond automated stainer.
Gene Expression and Analysis:
RNA was isolated from snap frozen tumor tissue using RNeasy Plus Kit (Qiagen). Resultant RNA was employed for RNA sequencing using previously described procedures 27. To selectively evaluate the expression within the tumor tissue and exclude reads from the mouse genome the alignment of reads was performed over a combined genome, so that human selective reads were captured. Triplicate reads were grouped by cell lines or respective PDX model, then normalized using the package edgeR (1, 2). Log fold-changes and student’s two-tailed t-test p-values (assuming equal variance) were calculated for each treatment from the normalized reads. Subtypes were determined using the Collisson gene signature by taking the z-score of each sample, then median centering each gene’s expression across samples (3). LINCs enrichment analysis and ontology analysis was performed with ENRICHR (amp.pharm.mssm.edu/Enrichr/). Data have been deposited at the Gene Expression Omnibus.
Palbociclib Downregulated Network Generation:
To generate the network of genes downregulated by palbociclib, an input gene list was generated where the log2-fold-change was less than −1 in at least 2 of the 10 treatment cohorts. The gene list was then input into the Gene Set/Mutation Analysis tool of the ReactomeFIViz Cytoscape plugin to construct a functional interaction network. The Cluster FI network function was used to identify specific gene/node groups. Clusters with less than 20 nodes were excluded from further analysis. Enrichment analysis was run for each cluster using the Biological Process GO terms and clusters with similar functional significance were combined.
Mutation Analysis:
Exome sequencing was performed for normal tissue, primary tumors, cell lines and PDX models where possible. Mutation calling was performed as previously described in Knudsen et al. 201727. Mutation call consensus was manually evaluated and determined to be concordant between model samples. All mutation calls in relevant oncogenes (i.e. KRAS, TP53, SMAD4, CDKN2A, CDKN2B, and MYC) were manually reviewed in IGV27.
Kinome Analysis:
Multiplexed inhibitor beads and mass-spectrometry were used to define active kinases as previously described11, 23. Peptide counts aligned to kinases were log2 transformed, then quantile normalized. Heatmaps of consistently altered kinases were produced in R.
Supplementary Material
Acknowledgements:
The authors thank all members of the laboratory group and colleagues in the discussion and preparation of this manuscript. The research was supported by a grant to AKW from the NCI.
Footnotes
Conflict of Interest: The authors have no conflicts of interest to report relative to this manuscript.
Data deposition:
RNA sequencing data is deposited in GEO: GSE113922
References:
- 1.Alexandrov LB, Nik-Zainal S, Wedge DC, Aparicio SA, Behjati S, Biankin AV et al. Signatures of mutational processes in human cancer. Nature 2013; 500: 415–421. [DOI] [PMC free article] [PubMed] [Google Scholar]
- 2.Asghar U, Witkiewicz AK, Turner NC, Knudsen ES. The history and future of targeting cyclin-dependent kinases in cancer therapy. Nat Rev Drug Discov 2015; 14: 130–146. [DOI] [PMC free article] [PubMed] [Google Scholar]
- 3.Bartkova J, Rezaei N, Liontos M, Karakaidos P, Kletsas D, Issaeva N et al. Oncogene-induced senescence is part of the tumorigenesis barrier imposed by DNA damage checkpoints. Nature 2006; 444: 633–637. [DOI] [PubMed] [Google Scholar]
- 4.Biankin AV, Waddell N, Kassahn KS, Gingras MC, Muthuswamy LB, Johns AL et al. Pancreatic cancer genomes reveal aberrations in axon guidance pathway genes. Nature 2012; 491: 399–405. [DOI] [PMC free article] [PubMed] [Google Scholar]
- 5.Cancer Genome Atlas Research N, Network CGAR. Integrated Genomic Characterization of Pancreatic Ductal Adenocarcinoma. Cancer Cell 2017; 32: 185–203 e113. [DOI] [PMC free article] [PubMed] [Google Scholar]
- 6.Cheema AR, O’Reilly EM. Management of Metastatic Pancreatic Adenocarcinoma. Surg Clin North Am 2016; 96: 1391–1414. [DOI] [PubMed] [Google Scholar]
- 7.Chou A, Froio D, Nagrial AM, Parkin A, Murphy KJ, Chin VT et al. Tailored first-line and second-line CDK4-targeting treatment combinations in mouse models of pancreatic cancer. Gut 2017. [DOI] [PMC free article] [PubMed] [Google Scholar]
- 8.Collisson EA, Sadanandam A, Olson P, Gibb WJ, Truitt M, Gu S et al. Subtypes of pancreatic ductal adenocarcinoma and their differing responses to therapy. Nature medicine 2011; 17: 500–503. [DOI] [PMC free article] [PubMed] [Google Scholar]
- 9.Cowan RW, Maitra A. Genetic progression of pancreatic cancer. Cancer journal 2014; 20: 80–84. [DOI] [PubMed] [Google Scholar]
- 10.Driscoll DR, Karim SA, Sano M, Gay DM, Jacob W, Yu J et al. mTORC2 Signaling Drives the Development and Progression of Pancreatic Cancer. Cancer Res 2016; 76: 6911–6923. [DOI] [PMC free article] [PubMed] [Google Scholar]
- 11.Duncan JS, Whittle MC, Nakamura K, Abell AN, Midland AA, Zawistowski JS et al. Dynamic reprogramming of the kinome in response to targeted MEK inhibition in triple-negative breast cancer. Cell 2012; 149: 307–321. [DOI] [PMC free article] [PubMed] [Google Scholar]
- 12.Duronio RJ, Xiong Y. Signaling pathways that control cell proliferation. Cold Spring Harbor perspectives in biology 2013; 5: a008904. [DOI] [PMC free article] [PubMed] [Google Scholar]
- 13.Franco J, Witkiewicz AK, Knudsen ES. CDK4/6 inhibitors have potent activity in combination with pathway selective therapeutic agents in models of pancreatic cancer. Oncotarget 2014; 5: 6512–6525. [DOI] [PMC free article] [PubMed] [Google Scholar]
- 14.Franco J, Balaji U, Freinkman E, Witkiewicz AK, Knudsen ES. Metabolic Reprogramming of Pancreatic Cancer Mediated by CDK4/6 Inhibition Elicits Unique Vulnerabilities. Cell reports 2016. [DOI] [PMC free article] [PubMed] [Google Scholar]
- 15.Fry DW, Harvey PJ, Keller PR, Elliott WL, Meade M, Trachet E et al. Specific inhibition of cyclin-dependent kinase 4/6 by PD 0332991 and associated antitumor activity in human tumor xenografts. Mol Cancer Ther 2004; 3: 1427–1438. [PubMed] [Google Scholar]
- 16.Gao H, Korn JM, Ferretti S, Monahan JE, Wang Y, Singh M et al. High-throughput screening using patient-derived tumor xenografts to predict clinical trial drug response. Nature medicine 2015; 21: 1318–1325. [DOI] [PubMed] [Google Scholar]
- 17.Gao S, Luo Y, Wu X, Li Y, Zhou Y, Lyu R et al. EB1 phosphorylation mediates the functions of ASK1 in pancreatic cancer development. Oncotarget 2017; 8: 98233–98241. [DOI] [PMC free article] [PubMed] [Google Scholar]
- 18.Gelbert LM, Cai S, Lin X, Sanchez-Martinez C, Del Prado M, Lallena MJ et al. Preclinical characterization of the CDK4/6 inhibitor LY2835219: in-vivo cell cycle-dependent/independent anti-tumor activities alone/in combination with gemcitabine. Invest New Drugs 2014. [DOI] [PMC free article] [PubMed] [Google Scholar]
- 19.Goel S, Wang Q, Watt AC, Tolaney SM, Dillon DA, Li W et al. Overcoming Therapeutic Resistance in HER2-Positive Breast Cancers with CDK4/6 Inhibitors. Cancer Cell 2016; 29: 255–269. [DOI] [PMC free article] [PubMed] [Google Scholar]
- 20.Gong X, Litchfield LM, Webster Y, Chio LC, Wong SS, Stewart TR et al. Genomic Aberrations that Activate D-type Cyclins Are Associated with Enhanced Sensitivity to the CDK4 and CDK6 Inhibitor Abemaciclib. Cancer Cell 2017; 32: 761–776 e766. [DOI] [PubMed] [Google Scholar]
- 21.Heilmann AM, Perera RM, Ecker V, Nicolay BN, Bardeesy N, Benes CH et al. CDK4/6 and IGF1 receptor inhibitors synergize to suppress the growth of p16INK4A-deficient pancreatic cancers. Cancer Res 2014; 74: 3947–3958. [DOI] [PMC free article] [PubMed] [Google Scholar]
- 22.Herrera-Abreu MT, Palafox M, Asghar U, Rivas MA, Cutts RJ, Garcia-Murillas I et al. Early Adaptation and Acquired Resistance to CDK4/6 Inhibition in Estrogen Receptor-Positive Breast Cancer. Cancer Res 2016. [DOI] [PMC free article] [PubMed] [Google Scholar]
- 23.Johnson GL, Stuhlmiller TJ, Angus SP, Zawistowski JS, Graves LM. Molecular pathways: adaptive kinome reprogramming in response to targeted inhibition of the BRAF-MEK-ERK pathway in cancer. Clin Cancer Res 2014; 20: 2516–2522. [DOI] [PMC free article] [PubMed] [Google Scholar]
- 24.Kleeff J, Korc M, Apte M, La Vecchia C, Johnson CD, Biankin AV et al. Pancreatic cancer. Nat Rev Dis Primers 2016; 2: 16022. [DOI] [PubMed] [Google Scholar]
- 25.Knudsen ES, Wang JY. Differential regulation of retinoblastoma protein function by specific Cdk phosphorylation sites. J Biol Chem 1996; 271: 8313–8320. [DOI] [PubMed] [Google Scholar]
- 26.Knudsen ES, O’Reilly EM, Brody JR, Witkiewicz AK. Genetic Diversity of Pancreatic Ductal Adenocarcinoma and Opportunities for Precision Medicine. Gastroenterology 2015. [DOI] [PMC free article] [PubMed] [Google Scholar]
- 27.Knudsen ES, Balaji U, Mannakee B, Vail P, Eslinger C, Moxom C et al. Pancreatic cancer cell lines as patient-derived avatars: genetic characterisation and functional utility. Gut 2017. [DOI] [PMC free article] [PubMed] [Google Scholar]
- 28.Knudsen ES, Witkiewicz AK. The Strange Case of CDK4/6 Inhibitors: Mechanisms, Resistance, and Combination Strategies. Trends Cancer 2017; 3: 39–55. [DOI] [PMC free article] [PubMed] [Google Scholar]
- 29.Kozar K, Ciemerych MA, Rebel VI, Shigematsu H, Zagozdzon A, Sicinska E et al. Mouse development and cell proliferation in the absence of D-cyclins. Cell 2004; 118: 477–491. [DOI] [PubMed] [Google Scholar]
- 30.Kwong LN, Costello JC, Liu H, Jiang S, Helms TL, Langsdorf AE et al. Oncogenic NRAS signaling differentially regulates survival and proliferation in melanoma. Nat Med 2012; 18: 1503–1510. [DOI] [PMC free article] [PubMed] [Google Scholar]
- 31.Ma XM, Blenis J. Molecular mechanisms of mTOR-mediated translational control. Nature reviews Molecular cell biology 2009; 10: 307–318. [DOI] [PubMed] [Google Scholar]
- 32.Malumbres M, Sotillo R, Santamaria D, Galan J, Cerezo A, Ortega S et al. Mammalian cells cycle without the D-type cyclin-dependent kinases Cdk4 and Cdk6. Cell 2004; 118: 493–504. [DOI] [PubMed] [Google Scholar]
- 33.Ono H, Basson MD, Ito H. PTK6 promotes cancer migration and invasion in pancreatic cancer cells dependent on ERK signaling. PLoS One 2014; 9: e96060. [DOI] [PMC free article] [PubMed] [Google Scholar]
- 34.Ottaiano A, Capozzi M, De Divitiis C, De Stefano A, Botti G, Avallone A et al. Gemcitabine mono-therapy versus gemcitabine plus targeted therapy in advanced pancreatic cancer: a meta-analysis of randomized phase III trials. Acta Oncol 2017; 56: 377–383. [DOI] [PubMed] [Google Scholar]
- 35.Patel P, Tsiperson V, Gottesman SRS, Somma J, Blain SW. Dual Inhibition of CDK4 and CDK2 via Targeting p27 Tyrosine Phosphorylation Induces a Potent and Durable Response in Breast Cancer Cells. Mol Cancer Res 2018; 16: 361–377. [DOI] [PMC free article] [PubMed] [Google Scholar]
- 36.Patnaik A, Rosen LS, Tolaney SM, Tolcher AW, Goldman JW, Gandhi L et al. Efficacy and Safety of Abemaciclib, an Inhibitor of CDK4 and CDK6, for Patients with Breast Cancer, Non-Small Cell Lung Cancer, and Other Solid Tumors. Cancer Discov 2016; 6: 740–753. [DOI] [PubMed] [Google Scholar]
- 37.Raspe E, Coulonval K, Pita JM, Paternot S, Rothe F, Twyffels L et al. CDK4 phosphorylation status and a linked gene expression profile predict sensitivity to palbociclib. EMBO Mol Med 2017; 9: 1052–1066. [DOI] [PMC free article] [PubMed] [Google Scholar]
- 38.Rodrik-Outmezguine VS, Chandarlapaty S, Pagano NC, Poulikakos PI, Scaltriti M, Moskatel E et al. mTOR kinase inhibition causes feedback-dependent biphasic regulation of AKT signaling. Cancer Discov 2011; 1: 248–259. [DOI] [PMC free article] [PubMed] [Google Scholar]
- 39.Russo AA, Tong L, Lee JO, Jeffrey PD, Pavletich NP. Structural basis for inhibition of the cyclin-dependent kinase Cdk6 by the tumour suppressor p16INK4a. Nature 1998; 395: 237–243. [DOI] [PubMed] [Google Scholar]
- 40.Serrano M, Gomez-Lahoz E, DePinho RA, Beach D, Bar-Sagi D. Inhibition of ras-induced proliferation and cellular transformation by p16INK4. Science 1995; 267: 249–252. [DOI] [PubMed] [Google Scholar]
- 41.Sherr CJ, Roberts JM. CDK inhibitors: positive and negative regulators of G1-phase progression. Genes Dev 1999; 13: 1501–1512. [DOI] [PubMed] [Google Scholar]
- 42.Sherr CJ, Beach D, Shapiro GI. Targeting CDK4 and CDK6: From Discovery to Therapy. Cancer Discov 2016; 6: 353–367. [DOI] [PMC free article] [PubMed] [Google Scholar]
- 43.Teh JLF, Cheng PF, Purwin TJ, Nikbakht N, Patel P, Chervoneva I et al. In Vivo E2F Reporting Reveals Efficacious Schedules of MEK1/2-CDK4/6 Targeting and mTOR-S6 Resistance Mechanisms. Cancer Discov 2018. [DOI] [PMC free article] [PubMed] [Google Scholar]
- 44.Vincent A, Herman J, Schulick R, Hruban RH, Goggins M. Pancreatic cancer. Lancet 2011; 378: 607–620. [DOI] [PMC free article] [PubMed] [Google Scholar]
- 45.Witkiewicz AK, Knudsen KE, Dicker AP, Knudsen ES. The meaning of p16(ink4a) expression in tumors: functional significance, clinical associations and future developments. Cell Cycle 2011; 10: 2497–2503. [DOI] [PMC free article] [PubMed] [Google Scholar]
- 46.Witkiewicz AK, Borja NA, Franco J, Brody JR, Yeo CJ, Mansour J et al. Selective impact of CDK4/6 suppression on patient-derived models of pancreatic cancer. Oncotarget 2015; 6: 15788–15801. [DOI] [PMC free article] [PubMed] [Google Scholar]
- 47.Witkiewicz AK, McMillan EA, Balaji U, Baek G, Lin WC, Mansour J et al. Whole-exome sequencing of pancreatic cancer defines genetic diversity and therapeutic targets. Nature communications 2015; 6: 6744. [DOI] [PMC free article] [PubMed] [Google Scholar]
- 48.Witkiewicz AK, Balaji U, Eslinger C, McMillan E, Conway W, Posner B et al. Integrated Patient-Derived Models Delineate Individualized Therapeutic Vulnerabilities of Pancreatic Cancer. Cell reports 2016; 16: 2017–2031. [DOI] [PMC free article] [PubMed] [Google Scholar]
- 49.Yoshida A, Lee EK, Diehl JA. Induction of Therapeutic Senescence in Vemurafenib-Resistant Melanoma by Extended Inhibition of CDK4/6. Cancer Res 2016; 76: 2990–3002. [DOI] [PMC free article] [PubMed] [Google Scholar]
- 50.Yuan TL, Amzallag A, Bagni R, Yi M, Afghani S, Burgan W et al. Differential Effector Engagement by Oncogenic KRAS. Cell reports 2018; 22: 1889–1902. [DOI] [PMC free article] [PubMed] [Google Scholar]
- 51.Zhang J, Xu K, Liu P, Geng Y, Wang B, Gan W et al. Inhibition of Rb Phosphorylation Leads to mTORC2-Mediated Activation of Akt. Mol Cell 2016; 62: 929–942. [DOI] [PMC free article] [PubMed] [Google Scholar]
Associated Data
This section collects any data citations, data availability statements, or supplementary materials included in this article.