

Abstract
Determining the clinical impact of imaging exams at the enterprise level is problematic, as radiology reports historically have been created with the content meant primarily for the referring provider. Structured reporting can establish the foundation for enterprise monitoring of imaging outcomes without manual review providing the framework for assessment of utilization and quality. Ultrasound (US) for deep vein thrombosis evaluation (DVT) is an ideal testbed for assessing this functionality. The system standard template for Doppler US for extremity venous evaluation for DVT was updated with a discrete fixed picklist of impression options and implemented system wide. Template utilization and interpretive outcomes were actively monitored and use reinforced as part of standard clinical practice. From January 1, 2017 to December 31, 2017, 9111 US exams for DVT were performed with 8997 utilizing structured reporting (98.75%). Of those in the structured reporting group, 1074 (11.79%) were positive for any type of DVT with 732 (8.03%) reported as Acute/New above the knee. Positive rates for any type of DVT were 10.29% emergency department, 14.17% inpatient, and 13.20% outpatient. While being the lowest positive rate, the emergency department had the highest overall volume of exams. Structured reporting for DVT US assessment outcomes can be implemented with a very high rate of radiologist adoption and adherence providing accurate determination of positive rates, month by month, in differing patient locations. Structured elements can be used to automatically trigger downstream processes; in our institution, this will alert providers in the EHR if the patient does not receive anticoagulation within 2 h of a positive test. This lays the foundation for effective enterprise assessment of imaging outcomes forming the basis of future quality and safety initiatives on optimizing health system resource utilization.
Keywords: Structured reporting, Utilization, DVT, Enterprise reporting, Quality
Background
Determining the clinical impact of imaging exams at the enterprise level is of increasing importance. Historically, radiology reports have been created primarily for the referring provider and not to facilitate the assessment of the presence of actionable findings. Most reports begin with a fixed text block of basic demographic information. This is followed by free-form prose consisting of an introductory section summarizing the examination technique and clinical history, a main body consisting of a list of prior studies for comparison and a paragraph or more describing the findings, and a brief overall impression section which aids in interpreting the findings [1, 2]. Thus, the radiology report, similar to many other forms of clinical documentation, does not facilitate analysis by computer or entry into discrete fields in the electronic health record (EHR) without the use of natural language processing applications [3, 4].
Given the large volume of radiology reports, the lack of standardized radiology report content has necessitated manual review of a subset of reports to determine clinical impact. While the implementation of standardized report formatting can reduce the problems of locating specific content for analysis, utilization of true structured reporting establishes the foundation for enterprise monitoring of imaging outcomes without manual review and interpretation. Insight into the interpretation of all exams and their impact, rather than a statistical subset, becomes possible providing a more complete framework for assessment of utilization and quality.
The Doppler ultrasound exam of the extremities is frequently used to assess for thrombus (DVT) and is an ideal testbed to assess the impact of structured reporting to monitor outcomes. As a targeted exam performed for a specific indication, the Doppler ultrasound exam template structure can be leveraged in a straightforward fashion to monitor the interpretation outcomes. Our aim was to employ structured reports to determine the rate of DVT in our patient population.
Methods
Standardized reporting was first introduced in our professional group in 2010. Since then, standard templates were implemented for all radiology divisions. The concept of standardized formatting and reporting is currently accepted as the enterprise standard for our practice in all divisions for all exams. More recently, discrete structured elements have been introduced into the standard formatted reports which form the basis for this project.
Unique electronic orders exist within the EHR Radiology Information System (Radiant, Epic; Verona, WI) for Doppler ultrasound for extremity venous evaluation specifically for DVT. System level structured report templates are associated with these orders in the voice-recognition dictation software (PowerScribe 360, Nuance; Burlington, MA). The dictation software automatically loads the system template when reporting the exam.
In January of 2016, a fixed picklist was created for the first line of the impression field with a set list of DVT-related impressions (Fig. 1). This was implemented system wide in the standard template for the corresponding Doppler exams. The fixed impression picklist items are:
No evidence of deep venous thrombosis (DVT) identified.
Deep venous thrombosis (DVT) identified.
Deep venous thrombosis (DVT) identified isolated to calf veins.
Superficial venous thrombosis identified. No evidence of deep venous thrombosis (DVT) identified.
Known deep venous thrombosis (DVT) is again identified.
Deep venous thrombosis (DVT) identified with features of chronic post-thrombotic change. (option added end of July 2017.)
Fig. 1.

Dictation software report template. Structured picklist for first Impression item drives standardized reporting for outcome tracking
Additional free text can be added to the impression after selecting a picklist option.
While this codified field could be deleted manually by the interpreting radiologist in its entirety, the internal text content cannot be altered. When utilized, this field will transmit the selected picklist impression item to the EHR through the HL7 interface to be stored discretely in a smart data element (Fig. 2). The selected text is also readable in the text of the report.
Fig. 2.
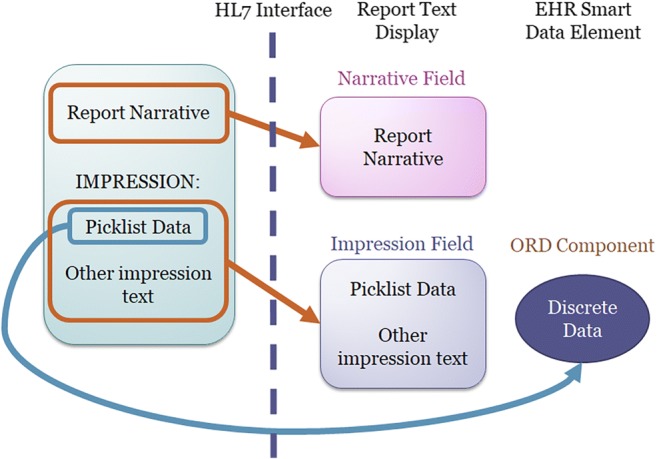
Replication of structured picklist data as both text in the human readable report as well as EHR discrete smart data element
All imaging reports for the corresponding extremity Doppler ultrasound exams were stored in the departmental imaging report data warehouse (Power BI, Microsoft; Redmond, WA). The discrete picklist impression value or absence of such a selection was recorded in its own unique reportable field in the data warehouse. This allowed for straightforward tracking, reporting, and monitoring of the field usage. The data warehouse was updated on a monthly basis.
Monthly volume and usage graphs were created and provided to divisional leadership. Using this, leadership continually reinforced usage of the appropriate reporting template field with the end user radiologist as part of standard clinical practice. Reports based on the interpretative report outcome were provided to departmental and hospital leadership. This created the opportunity to utilize this as an outcome metric for targeted assessments, such as utilization based not only on volume but also on positive rates.
Results
The report template change was initiated January 2016 at a county hospital and utilized by over 75 rotating faculty and trainees. Radiology leadership monitored structured report utilization and reinforced usage with the radiologists, with template utilization of 98.7% in 2017. This can be monitored on operational dashboards (Fig. 3) to assess for change. For example, the August 2017 rise in unstructured reports (arrow) was identified and determined to be secondary to an application outage requiring backup non-structured reporting processes. Such monitoring could also identify a newly hired provider unfamiliar with the local processes.
Fig. 3.

Monitoring rate of non-structured reporting over time. Continual reinforcement by leadership resulted in downward trend of non-structured reports. Spike in non-structured used in August 2017 (arrow) resulted from a prolonged downtime in the dictation application
Interpretive outcomes for reporting are in Table 1. From January 1, 2017 to December 31, 2017, 9111 US exams for DVT were performed with 8997 utilizing structured reporting (98.75%). Of those in the structured reporting group, 1074 (11.79%) were positive for any type of DVT with 732 (8.03%) reported as Acute/New above the knee. Positive rates for any type of DVT were 10.29% emergency department, 14.17% inpatient, and 13.20% outpatient.
Table 1.
Interpretive outcomes for reporting
| All exams | Emergency department | Inpatient | Outpatient | ||||||
|---|---|---|---|---|---|---|---|---|---|
| Count | Percent + | Count | Percent + | Count | Percent + | Count | Percent + | ||
| Total | US exams performed | 18,569 | 100.00% | 10,881 | 100.00% | 5414 | 100.00% | 2274 | 100.00% |
| Structured reporting used | 17,819 | 95.96% | 10,564 | 97.09% | 5105 | 94.29% | 2150 | 94.55% | |
| Positive for DVT* | 1962 | 10.57% | 1053 | 9.68% | 633 | 11.69% | 276 | 12.14% | |
| Superficial thrombus only | 574 | 3.09% | 140 | 1.29% | 393 | 7.26% | 41 | 1.80% | |
| No thrombus | 15,283 | 82.30% | 9371 | 86.12% | 4079 | 75.34% | 1833 | 80.61% | |
| Non-structured report | 750 | 4.04% | 317 | 2.91% | 309 | 5.71% | 124 | 5.45% | |
| 2016 | US exams performed | 9458 | 100.00% | 5575 | 100.00% | 2768 | 100.00% | 1115 | 100.00% |
| Structured reporting used | 8822 | 93.28% | 5316 | 95.35% | 2489 | 89.92% | 1017 | 91.21% | |
| Positive for DVT* | 888 | 9.39% | 507 | 9.09% | 258 | 9.32% | 123 | 11.03% | |
| Superficial thrombus only | 257 | 2.72% | 63 | 1.13% | 177 | 6.39% | 17 | 1.52% | |
| No thrombus | 7677 | 81.17% | 4746 | 85.13% | 2054 | 74.21% | 877 | 78.65% | |
| Non-structured report | 636 | 6.72% | 259 | 4.65% | 279 | 10.08% | 98 | 8.79% | |
| 2017 | US exams performed | 9111 | 100.00% | 5306 | 100.00% | 2646 | 100.00% | 1159 | 100.00% |
| Structured reporting used | 8997 | 98.75% | 5248 | 98.91% | 2616 | 98.87% | 1133 | 97.76% | |
| Positive for DVT* | 1074 | 11.79% | 546 | 10.29% | 375 | 14.17% | 153 | 13.20% | |
| Superficial thrombus only | 317 | 3.48% | 77 | 1.45% | 216 | 8.16% | 24 | 2.07% | |
| No thrombus | 7606 | 83.48% | 4625 | 87.17% | 2025 | 76.53% | 956 | 82.48% | |
| Non-structured report | 114 | 1.25% | 58 | 1.09% | 30 | 1.13% | 26 | 2.24% | |
*Options of Acute/New non-calf DVT, Calf DVT, Chronic Appearing DVT, Known DVT
+ Based on all dictated exams in the corresponding patient location
Discussion
As the practice of medicine evolves to utilize quality measures as drivers for practice, resource management, and reimbursement, the specialty of radiology needs to grow beyond the process measures of volume and speed. Newer initiatives, such as the American College of Radiology Imaging 3.0, are looking to demonstrate the value of the radiologist beyond reading room productivity [5].
An alternative to traditional free-form reporting is structured reporting, with an emphasis on report standardization for clearer communication, more complete reports, and fewer misdiagnoses [6, 7]. Appropriately implemented, this initiative can be leveraged to facilitate enterprise level monitoring and assessment of the interpretive outcomes of radiology imaging reports. Suh-Burgmann et al. demonstrated that a hashtag categorization system could effectively be used for adnexal mass categorization on pelvic US [8]. Our work demonstrates this ability with reporting on US exams for DVT evaluation. While this information can be used by radiology departmental leadership to monitor reporting practices assuring adherence to agree upon standards (Fig. 3), the true value is much greater.
Eliminating the need for manual review of a subset of reports to identify statistical rates removes a primary cost barrier to utilizing radiology reporting interpretive outcomes as metrics in quality practice assessment. In this manner, radiology departments can position themselves as suppliers of metric data for health care practices, not just on appropriateness criteria at order entry but also on sensitivity, specificity, and predictive value of the clinical practice patterns of those practices [9, 10].
Outcome rates overlaid on volume graphs will monitor enterprise practice patterns and can be used for utilization investigation and quality improvement. For example, the emergency department has the highest volume and the lowest positive test rate (Fig. 4); administration could consider investigating individual provider practice patterns in this group to assess utilization trends. In dashboard fashion, the systems of imaging utilization can be monitored with run charts for unanticipated changes in the system or to measure the impact of process improvements (Fig. 5).
Fig. 4.

Monthly monitoring of procedure volume and interpretive outcomes based on patient location: emergency department, inpatient, and outpatient
Fig. 5.

Run chart monitoring the volume of ultrasound exams for DVT assessment against the volume of positive exams from the emergency department (ED). The Upper Control Limit and Lower Control Limit can be used to identify when workflow or other variables appear to have changed the standard process of the system
Being able to assess thousands of records in seconds can support population-based research in a manner that manual review could never provide. Questions such as “What should be the positive test rate for optimum utilization” could be posed but with little hope of answering without large volumes of discrete data. BIRADS offers an example of how interpretive outcomes can be used for quality monitoring through MQSA; structured reporting offers a pathway for similar development in other facets of radiology [11]. Such a proof of concept was published by Santos et al. for pulmonary embolism as a use case showing the effectiveness of structured reporting, although that process required transforming the radiology report by a post-processing platform which is not required in our system [12].
In addition, the discrete interpretive data can be fed back into clinical practice to potentially benefit individual patients. In our practice, the positive for DVT results are set to trigger clinical decision support functionality. Two hours after a positive test result, the provider will be alerted if the patient is not on anticoagulation medication. The provider has direct access at that point to pertinent clinical information, links to anticoagulation medication, and the ability to dismiss if the setting of anticoagulation contraindication (Fig. 6). Such a system is potentially the future definition of actionable reporting [13].
Fig. 6.

EHR interruptive alert for treating provider notifying that a patient’s ultrasound exam was positive for DVT and that the patient has not yet been placed on anticoagulation
This process is not without some costs. Without a structured reporting champion and active feedback from clinical users evolving the report templates, it is possible that this reporting system will not be reliably utilized or will result in workflow inefficiencies. The balance must maintain human usability for the interpreting radiologist and clinical users of the reports while facilitating the automated categorization and reporting. Some prior publications have suggested that templates can be constraining with regard to report content and can be time consuming [14]. While ultrasound for DVT evaluation is a fairly focused exam, expansion of this system into more robust imaging such as MR and CT may be problematic. Guidance from standardized grading systems such as TI-RADS, PI-RADS, LI-RADS, and others may provide support. Technical infrastructure and/or support is needed to implement such a system.
Conclusion
Structured reporting with discrete interpretive reporting outcomes lays the foundation for effective enterprise assessment of clinical utilization of imaging exams. Our implementation of this for reporting on ultrasound for DVT assessment has demonstrated a very high rate of radiologist adoption and adherence providing accurate determination of positive rates, month by month, in differing patient locations. The data will form the basis of assessment for future quality and clinical initiatives on optimizing health system resource utilization. Future expansion into other facets of imaging could cement radiology’s role in providing such data for health care systems without the expense of manual review.
References
- 1.Kahn CE, Jr, Langlotz CP, Burnside ES, Carrino JA, Channin DS, Hovsepian DM, et al. Toward best practices in radiology reporting. Radiology. 2009;252(3):852–856. doi: 10.1148/radiol.2523081992. [DOI] [PubMed] [Google Scholar]
- 2.Dunnick NR, Langlotz CP. The radiology report of the future: a summary of the 2007 Intersociety Conference. J Am Coll Radiol. 2008;5(5):626–629. doi: 10.1016/j.jacr.2007.12.015. [DOI] [PubMed] [Google Scholar]
- 3.Alkasab TK, Bizzo BC, Berland LL, Nair S, Pandharipande PV, Harvey HB. Creation of an open framework for point-of-care computer-assisted reporting and decision support tools for radiologists. J Am Coll Radiol. 2017;14(9):1184–1189. doi: 10.1016/j.jacr.2017.04.031. [DOI] [PubMed] [Google Scholar]
- 4.Pons E, Braun LM, Hunink MG, Kors JA. Natural language processing in radiology: a systematic review. Radiology. 2016;279(2):329–343. doi: 10.1148/radiol.16142770. [DOI] [PubMed] [Google Scholar]
- 5.McGinty GB, Allen B, Jr, Geis JR, Wald C. IT infrastructure in the era of imaging 3.0. J Am Coll Radiol. 2014;11(12 Pt B):1197–1204. doi: 10.1016/j.jacr.2014.09.005. [DOI] [PubMed] [Google Scholar]
- 6.Brook OR, Brook A, Vollmer CM, Kent TS, Sanchez N, Pedrosa I. Structured reporting of multiphasic CT for pancreatic cancer: potential effect on staging and surgical planning. Radiology. 2015;274(2):464–472. doi: 10.1148/radiol.14140206. [DOI] [PubMed] [Google Scholar]
- 7.Reiner BI, Knight N, Siegel EL. Radiology reporting, past, present, and future: the radiologist’s perspective. J Am Coll Radiol. 2007;4(5):313–319. doi: 10.1016/j.jacr.2007.01.015. [DOI] [PubMed] [Google Scholar]
- 8.Suh-Burgmann EJ, Flanagan T, Lee N, Osinski T, Sweet C, Lynch M, Caponigro M, Mehta J, Alavi M, Herrinton LJ. Large-scale implementation of structured reporting of adnexal masses on ultrasound. J Am Coll Radiol. 2018;15(5):755–761. doi: 10.1016/j.jacr.2018.01.026. [DOI] [PubMed] [Google Scholar]
- 9.Jenkins HJ, Downie AS, Maher CG, Moloney NA, Magnussen JS, Hancock MJ: Imaging for low back pain: is clinical use consistent with guidelines? A systematic review and meta-analysis. Spine J, 2018. 10.1016/j.spinee.2018.05.004 [DOI] [PubMed]
- 10.ACR. ACR Appropriateness Criteria May, 2018 [Available from: https://www.acr.org/Clinical-Resources/ACR-Appropriateness-Criteria
- 11.Nass SJ, Patlak M, National Cancer Policy Forum (U.S.) Assessing and improving the interpretation of breast images : workshop summary. Washington, DC: The National Academies Press; 2015. [PubMed] [Google Scholar]
- 12.Pinto Dos Santos D, Scheibl S, Arnhold G, Maehringer-Kunz A, Duber C, Mildenberger P et al.: A proof of concept for epidemiological research using structured reporting with pulmonary embolism as a use case. Br J Radiol, 2018. 10.1259/bjr.20170564 [DOI] [PMC free article] [PubMed]
- 13.Larson PA, Berland LL, Griffith B, Kahn CE, Jr, Liebscher LA. Actionable findings and the role of IT support: report of the ACR Actionable Reporting Work Group. J Am Coll Radiol. 2014;11(6):552–558. doi: 10.1016/j.jacr.2013.12.016. [DOI] [PubMed] [Google Scholar]
- 14.Johnson AJ, Chen MY, Zapadka ME, Lyders EM, Littenberg B. Radiology report clarity: a cohort study of structured reporting compared with conventional dictation. J Am Coll Radiol. 2010;7(7):501–506. doi: 10.1016/j.jacr.2010.02.008. [DOI] [PubMed] [Google Scholar]