Abstract
Nasopharyngeal carcinoma (NPC) is prevalent in certain areas, such as South China, Southeast Asia, and the Middle East. Radiation therapy is the most efficient means to treat this malignant tumor. Positron emission tomography–computed tomography (PET-CT) is a suitable imaging technique to assess this disease. However, the large amount of data produced by numerous patients causes traditional manual delineation of tumor contour, a basic step for radiotherapy, to become time-consuming and labor-intensive. Thus, the demand for automatic and credible segmentation methods to alleviate the workload of radiologists is increasing. This paper presents a method that uses fully convolutional networks with auxiliary paths to achieve automatic segmentation of NPC on PET-CT images. This work is the first to segment NPC using dual-modality PET-CT images. This technique is identical to what is used in clinical practice and offers considerable convenience for subsequent radiotherapy. The deep supervision introduced by auxiliary paths can explicitly guide the training of lower layers, thus enabling these layers to learn more representative features and improve the discriminative capability of the model. Results of threefold cross-validation with a mean dice score of 87.47% demonstrate the efficiency and robustness of the proposed method. The method remarkably outperforms state-of-the-art methods in NPC segmentation. We also validated by experiments that the registration process among different subjects and the auxiliary paths strategy are considerably useful techniques for learning discriminative features and improving segmentation performance.
Keywords: Nasopharyngeal carcinoma, Segmentation, PET-CT, Fully convolutional neural networks
Introduction
Nasopharyngeal carcinoma (NPC) is a prevalent malignant tumor, especially in South China, Southeast Asia, the Middle East, and North Africa [1]. Results of pathological examination on patients with NPC commonly include poorly differentiated squamous cell carcinoma, which is sensitive to radiation therapy. Therefore, radiation therapy is the preferred treatment method for NPC [2]. Delineating the tumor contour is an essential step during radiotherapy, and delineation quality considerably affects the patient treatment and degree of difficulty in implementing radiotherapy. Currently, target areas are delineated manually by radiologists, but the large number of patients makes delineation time-consuming and labor-intensive. Delineation quality highly depends on the physician’s expertise and experience, and delineations may exhibit variations among different physicians [3]. Automatic NPC segmentation is highly desired in clinical practice because it alleviates clinicians’ workload and inter-observer variability.
Positron emission tomography (PET) and computed tomography (CT) images provide complementary information on the structure or functionality of tissues. The use of PET-CT scan in NPC diagnosis has become increasingly popular. A CT image usually shows no evident boundary of nasopharyngeal tumor due to its low soft tissue contrast (Fig. 1a). A PET image presents a good visualization of the tumor but loses accurate boundary information due to its low spatial resolution. Moreover, distinguishing between the tumor and normal highlighted tissues in a PET image is difficult (Fig. 1b). Therefore, using dual-modality PET-CT images is an appropriate technique for determining the tumor boundary and extent of tumor invasion. Using dual-modality PET-CT images for tumor segmentation has elicited increasing attention [4–7]. Han et al. [4] developed an effective graph-based method to segment head-and-neck cancer on PET-CT images. Song et al. [5] proposed a novel co-segmentation method and applied it to lung tumor and head-and-neck cancer segmentations on PET-CT images. Ju et al. [6] utilized random walk and the graph cut method to segment lung tumor on PET-CT images. The experimental results of these studies demonstrated the merits of using PET and CT images simultaneously compared with solely using a PET or CT image.
Fig. 1.
CT (a) and PET images (b) of a patient with nasopharyngeal carcinoma. The red curves represent the tumor boundary
NPC segmentation is a difficult task because the anatomical structure of nasopharyngeal region is complicated, the intensity of tumor is similar to that of nearby tissues, and the shape of tumor in different subjects varies greatly [8]. Several researchers have conducted trials on this field. Existing methods can be grouped into three categories, namely, intensity-, contour-, and learning-based methods. In intensity-based methods [9, 10], a probabilistic map of the tumor region was estimated by using intensity features. Region growing was then initialized according to the probabilistic map and used to segment NPC in CT images. Intensity-based methods depend on the intensity difference, which limits the performance of such methods in NPC segmentation because NPC exhibits an intensity similar to that of nearby normal tissues.
Contour-based methods mainly include active contour and level set. Huang et al. [11] segmented NPC in magnetic resonance imaging (MRI) by calculating the nasopharynx region location, using a distance-regularized level set evolution to determine the tumor contour, and applying a hidden Markov random field model with maximum entropy to refine the contour. Fitton et al. [12] implemented a semiautomatic NPC segmentation method. The physicians delineated a rough tumor contour and subsequently used the Snake method to optimize the delineation in linearly weighted CT-MRI registered images. In contour-based methods, many parameters must be adjusted by the user based on expertise, which limits the application of these methods in clinical practice.
Meanwhile, support vector machine (SVM) and neural network have been widely utilized in learning-based methods. Wu et al. [13] developed an automatic algorithm for detecting NPC lesions on PET-CT images with SVM. Mohammed et al. [14] implemented automatic segmentation and identification of NPC by using artificial neural network in microscopy images to identify preliminary NPC cases. Convolutional neural network-based methods have been proposed recently [8, 15]. Wang et al. [8] trained a patch-wise classification network to determine the class labels (tumor or normal tissue) of each pixel. Such a method only considers local information and suffers from an efficiency problem because the network must make a prediction for each patch separately, and many computations are redundant because of overlapping patches. Men et al. [15] proposed a fully convolutional network (FCN)-based method for NPC segmentation. In their work, a down-sample path and an up-sample path were added to the network for feature extraction and resolution restoration. U-net, which offers skip connections between the corresponding down- and up-sample paths, has become popular for medical image segmentation [16]. Many U-net–based methods have been reported, and their remarkable performance indicates the effectiveness of the skip connections [17–20]. In this work, we investigate the potential of using FCN with skip connections in NPC segmentation. A work that is closely related to ours is [15]. Different from [15], which only utilized CT images, the present study uses dual-modality PET-CT images that provide more useful information for distinguishing a tumor from normal tissues. We also implement a network with auxiliary paths and demonstrate the use of dual-modality PET-CT images and our model achieves better performance than existing methods that are based only on CT images and purely FCN.
The main contributions of this work can be summarized as follows:
This study is the first to segment NPC based on dual-modality PET-CT images. This technique is consistent with practical clinical work and can provide considerable convenience for subsequent radiotherapy.
The proposed method demonstrates state-of-the-art performance in NPC segmentation by deploying FCN with auxiliary paths. The deep supervision introduced by the auxiliary paths can explicitly direct the training of hidden layers, thus enabling these layers to learn more representative features. The effectiveness of the auxiliary paths is also proven by experiments.
Registration pre-processing is performed to align images to a unified space in the proposed method. The experimental results demonstrate that the registration is effective for FCN to relieve the burden of the learning of location invariant features, and this pre-processing is helpful in improving segmentation performance when the size of the training dataset is limited.
Materials and Methods
Materials
Thirty PET-CT scans were collected from 30 patients suffering from NPC. Twenty scans were obtained from the PET center of Southern Hospital, and ten were acquired from Guangzhou Military Region General Hospital. Twenty cases were selected as the training set, and the remaining ten cases were utilized as the testing set. Threefold cross-validation was performed to evaluate the robustness of the proposed method. The ground truth was delineated manually by two experienced radiologists on PET-CT fusion images.
Overview of the Segmentation Workflow
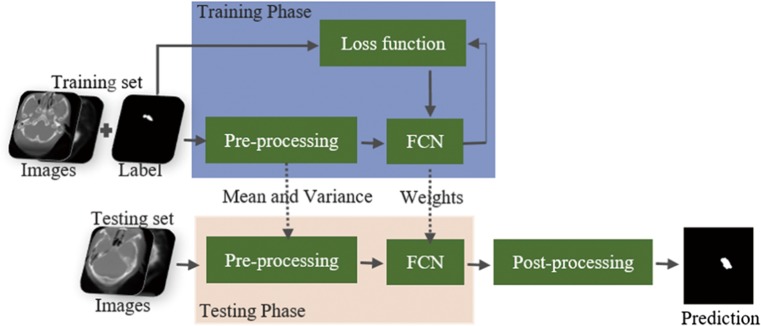
Our segmentation framework is presented in Fig. 2. The workflow comprises three main stages. The first stage depicts data preprocessing and augmentation. The second stage presents the network architecture and the strategy that alleviates class imbalance. The third stage describes the post-processing process.
Fig. 2.
Overview of the segmentation workflow
Data Preprocessing and Augmentation
Prior to segmentation, we implemented 3D affine registration among different cases using FMRIB’s Linear Image Registration Tool from FMRIB Software Library. The registration was based only on bone structure information in CT images. We used a threshold (200 Hu) to segment the bone structure of each CT image. A case was randomly selected as the template, and the remaining cases were aligned to this template. Then, the affine transformation matrix of each case was saved and applied to its corresponding PET image. We suggest that all aligned images located in a unified image space help to alleviate the learning burden of the location invariant features. After registration, several slices lost a part of the complete head image, and these slices were discarded. All remaining slices (approximately 90 per case) were used for the training and testing stages. The raw image size of 512 × 512, which contained interferential information, such as the scanning bed, was cropped to 256 × 224 to include only the head image. In the final step of data preprocessing, we computed the mean value and standard deviation over all cropped training slices and normalized CT and PET slices to zero mean and unit deviation. The mean and standard deviation calculated in the training slices were also applied to normalize the testing slices.
Similar to [16, 21], this study also implemented artificial data augmentation to increase the size of the training set and reduce overfitting. During training, each slice was randomly rotated at an angle between − 5 and 5°, scaled randomly by a factor between 0.95 and 1.05, horizontally and vertically translated by a random distance within 15 pixels, and randomly flipped around.
Network Architecture and Handling of Class Imbalance
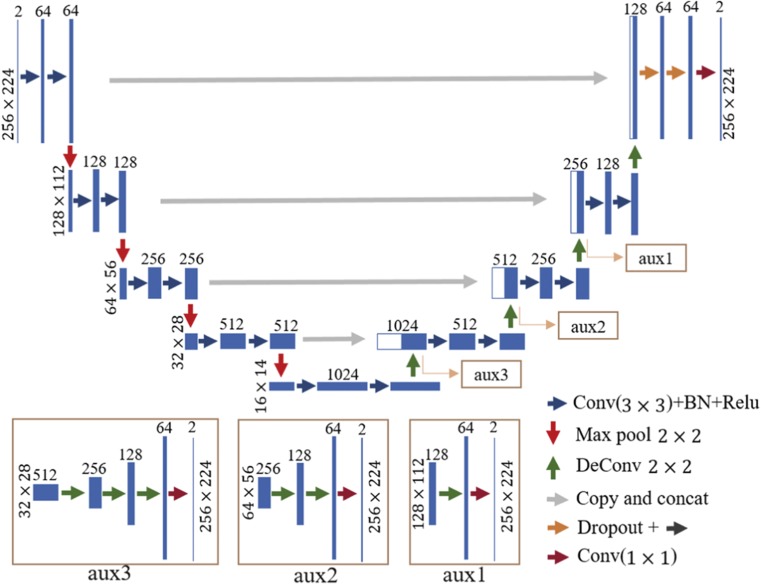
Figure 3 illustrates our network architecture. The U-net architecture was used to obtain pixel-wise prediction maps. To use the information of two modalities, we assigned two input channels, namely, CT and PET images, as the input. In convolutional layers, 3 × 3 convolution kernels were used, and feature maps were padded prior to convolution computation so that the convolution process would not change the size of feature maps. Feature maps from the down-sample paths were directly concatenated with up-sampled outputs to make better use of multiple scale features. To expedite the training process and avoid gradient vanishing or exploding, we utilized batch normalization [22] after each convolution and applied the rectified linear unit (ReLU) activation function to the output of batch normalization. Then, two dropout layers with a rate of 0.5 were added before the last two convolution layers to reduce overfitting. Afterward, label probability maps were computed by a 1 × 1 convolution layer.
Fig. 3.
Network architecture. The meaning of arrows with different colors are displayed in the lower right corner. The size of feature map in each level is shown on the left of this level. The number of channels of each layer is represented at the top of the bar. The detail of the auxiliary paths is shown below the main path
The network structure is deep to extract highly representative features. Therefore, many parameters need to be trained. Moreover, a limited dataset is available, which makes network training difficult. Thus, we considered introducing auxiliary paths, which explicitly supervise the training of lower-layer parameters, into the network to alleviate the optimization challenge [23]. As shown in Fig. 3, three auxiliary paths were added to the up-sample section of the mainstream network. Each path employed several deconvolution operations (3, 2, and 1 times for auxiliary3, auxiliary2, and auxiliary1, respectively) to obtain feature maps that matched the size of the input images. Subsequently, 1 × 1 convolutions were used to obtain label probability maps. The SoftMax activation function was applied to each label probability map, and the cross-entropy loss functions of the main path and all auxiliary paths were computed. The overall loss function is defined as the weighted sum of all loss functions, including the losses of the main path and all auxiliary paths:
| 1 |
A crucial problem in training a network for segmentation of medical data is that the class distribution is severely imbalanced according to the pixel-wise percentage of each class. In our case, the number of pixels of normal tissue accounted for > 99% of the total number of pixels. Thus, the model easily converged toward the wrong direction, i.e., predicting each pixel as normal tissue [24]. An additional weight coefficient was assigned to each pixel in each cross-entropy loss function to handle the problem of data imbalance. The weight coefficient is defined as follows:
| 2 |
where li denotes the ground truth of pixel i. In addition, committing a mistake in the boundary pixels is easy. Therefore, we dilated the ground truth with a disk-shaped structural element of radius (R) and subsequently implemented the above-mentioned weighting factor according to the dilated ground truth to increase the weight of loss of non-tumor pixels next to the boundary.
Post-Processing
Two steps were implemented to reduce the number of false positive. First, several small clusters may be incorrectly predicted as tumor. To deal with this problem, we removed clusters that were smaller than a threshold (τ) in the predicted result of each slice [25]. Second, nasopharyngeal tumors generally occur in the pharyngeal recess and the anterior wall of the nasopharynx, which indicates that the tumor location is relatively fixed and continuous. Therefore, in the 3D prediction, only the longest-connected slices predicted to contain tumor were retained as tumor regions, and all other slices were marked as non-tumor regions.
Results and Discussions
Experimental Setting
The network was trained on a workstation with an NVIDIA Titan X GPU with 12 GB VRNM, two Intel Xeon CPU E5–2623 v3 @ 3.00 GHz, and 8 16 GB DDR4 RAM @2133 MHz. We implemented the work using the deep learning framework Matconvnet. The MSRA initialization method [26] was employed to initialize filter weights, and all biases were initialized to zero. We used the Adam optimizer with a momentum of 0.9. The learning rate was initialized to 0.002 and decreased constantly during the training stage. The weight coefficients of auxiliary path1, auxiliary2, and auxiliary3 were set to 0.5, 0.3, and 0.1, respectively. The other parameters and values are summarized in Table 1.
Table 1.
Parameter setting
| Stage | Parameter | Value |
|---|---|---|
| Training | Batch size | 16 |
| Weight decay | 0.0005 | |
| Dropout ratio | 0.5 | |
| Epochs | 450 | |
| Radius R | 10 | |
| Post-processing | Threshold τ | 150 |
Evaluation Metrics
We evaluated the segmentation result based on three metrics, namely, dice similarity coefficient (DSC), positive predictive value (PPV), and sensitivity. DSC [27] calculates the overlap between the ground truth and automatic segmentation. This metric is defined as follows:
| 3 |
where TP, FP, and FN represent the amount of true positive, false positive, and false negative, respectively. PPV is used to measure the number of TP and FP and defined as follows:
| 4 |
Sensitivity is employed to compute the amount of TP and FN, and it is defined as follows:
| 5 |
High values indicate good segmentation results in these three metrics.
Contributions of Different Components
We evaluated the contributions of several main components of the proposed approach by analyzing their influence on the final segmentation performance. Except for the component under study, all other components and parameters of each comparative experiment were consistent with the proposed method. The experimental results of threefold cross-validation of the testing set are summarized in Table 2. The first column corresponds to the result that uses the approach introduced in the “Material and Methods” section. The remaining columns present the results of removing components inside the parentheses from the original architecture. According to the first two columns, the dice score of each fold was improved by adding auxiliary paths to the network. The scores of PPV and sensitivity metrics also improved or were equivalent. This finding illustrates that the deep supervision introduced by auxiliary paths can improve the discriminative capability of the network by enabling the middle and lower layers to learn more representative features [23]. As mentioned in the “Post-processing” section, the NPC location is relatively fixed, but the data were from different imaging devices, and the positioning difference of the patient and other reasons undermined this relative fixedness. We conclude that data registration among different subjects before their input to the network can help align the NPC location and relieve the learning burden of the location invariant features. Thus, high accuracy can be obtained with a small training dataset. The first and third columns of Table 2 reveal that the registration process increased the mean value of each metric. The dice scores of first and second folds improved greatly, indicating that data registration can be used as an effective preprocessing technique for segmentation when the size of the training dataset is limited. The post-process further improved the segmentation performance, as shown in the first and fourth columns of Table 2. This procedure that aims to reduce the number of false positive is simple, fast, and effective. As mentioned in the “Introduction” section, a CT image usually shows no evident boundary of nasopharyngeal tumor. Thus, we also investigated the effect of CT image by inputting only PET image to a single channel network. We observed from the first and fifth columns of Table 2 that the contribution of the CT image was not very remarkable, but it contributed nevertheless. Moreover, CT image is a necessary modality for subsequent development of a radiotherapy plan.
Table 2.
Quantitative results of the proposed method under different settings. The subtraction sign stands for the removal of the component inside parentheses from the original architecture
| Metrics | Method | Proposed | −(auxiliary paths) | −(registration) | −(post-process) | −(CT image) |
|---|---|---|---|---|---|---|
| DSC (%) | First fold | 88.27 | 86.41 | 78.95 | 87.57 | 86.87 |
| Second fold | 84.32 | 82.31 | 79.77 | 81.85 | 84.06 | |
| Third fold | 89.82 | 89.71 | 89.11 | 89.15 | 89.65 | |
| Mean | 87.47 | 86.14 | 82.61 | 86.19 | 86.86 | |
| PPV (%) | First fold | 91.59 | 91.33 | 87.11 | 88.67 | 87.93 |
| Second fold | 94.20 | 86.71 | 88.23 | 86.75 | 93.17 | |
| Third fold | 94.88 | 94.12 | 88.70 | 92.31 | 94.03 | |
| Mean | 93.56 | 90.72 | 88.01 | 89.24 | 91.71 | |
| Sen (%) | First fold | 85.47 | 82.63 | 75.73 | 86.88 | 86.34 |
| Second fold | 77.60 | 80.14 | 77.13 | 79.48 | 77.30 | |
| Third fold | 85.72 | 86.29 | 90.35 | 86.63 | 86.05 | |
| Mean | 82.93 | 83.02 | 81.07 | 84.33 | 83.23 |
Quantitative Results
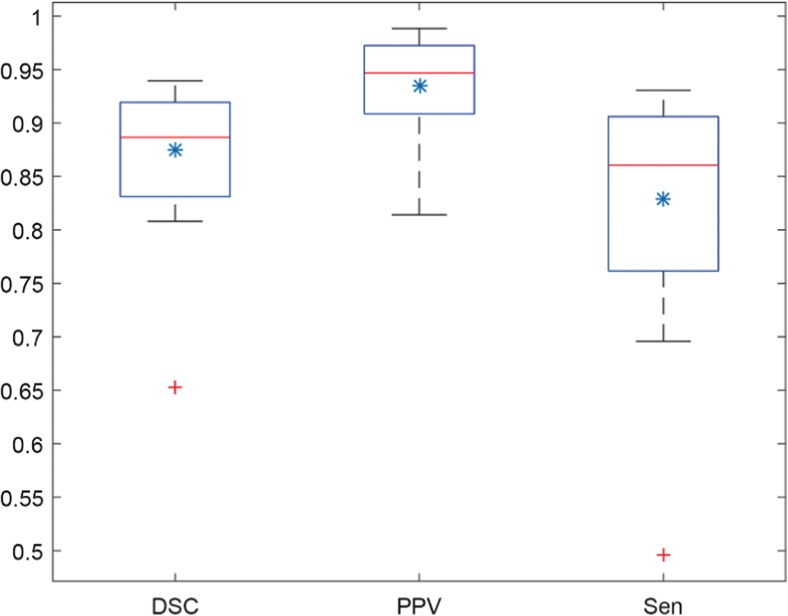
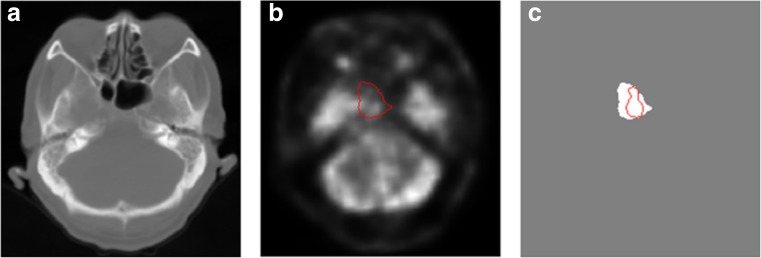
The quantitative segmentation results of threefold cross-validation of the proposed method are shown in the first column of Table 2. We achieved a mean dice score of 87.47%, which outperforms state-of-the-art methods in NPC segmentation. Table 2 also shows that the experimental result of the second fold was lower than that of the two other folds. A case of the second fold only achieved 65.27% test dice score, which decreased the mean score of the second fold. As shown in Fig. 5, an outlier marked by a red plus sign was observed. The segmentation result of a slice of this case is also displayed in Fig. 4. The difference between the automatic segmentation result (red curve) and ground truth (white area) was visible. We observed that the tumor in this case was highly conjoint with normal bright tissues, and the intensity of tumor pixels was lower than that of surrounding normal tissues in the PET image, as shown in Fig. 4b. Non-experts could not distinguish the tumor boundary at all. Thus, the network may not learn sufficient discriminative features to deal with this sample because it is more difficult to differentiate than the samples of the training set.
Fig. 5.
Boxplot of the test results for all cases. The symbols * represent the means
Fig. 4.
Display segmentation result of a slice of the failed case. a, b, and c show the CT image, PET image (red curve represents the boundary of ground truth), and the ground truth (white area) and automatic segmentation boundary (red curve), respectively
We drew boxplots of the test result for all cases in Fig. 5, where the blue asterisks represent the mean of each metric. This description reveals that all samples, except for the outlier, obtained dice scores of > 0.8, and nearly half of the samples achieved dice scores of > 0.9, indicating that our method is efficient in accuracy performance. In addition, our method has an advantage in time performance, a test set sample requires only approximately 7 s (registration time is not included) to obtain the final automatic segmentation result based on the trained model.
We also compared our work with a previous work [15] (Table 3) that also used the method of FCN. In NPC segmentation, most previous studies only calculated 2D dice scores of tumor slices and reported the average of 2D dice as a test result. This metric only considers tumor slices and is seriously affected by poor-performance slices. If only the scores of good-performance tumor slices are averaged, 2D dice will obtain a very high score. 3D dice calculates the overlap between automatic segmentation and ground truth of the entire volume data. Thus, 3D dice is a more reasonable comprehensive metric than 2D dice. To directly compare with [15], we calculated a 2D dice average of tumor slices, as shown in Table 3. The tumor volume in several slices was extremely small, and the network may be unable to locate the lesions accurately. Thus, zero dice scores were obtained in these slices, which seriously influenced the average score. Similar to most previous proposals, our 2D dice does not consider the first two and the last two slices. Table 3 shows that our implementation is much better than that in previous work.
Table 3.
Comparison of our work with the work of Men et al. [15]. The DSC score is obtained from the original paper
| Method | Modality | Network architecture | DSC (%) |
|---|---|---|---|
| Men [15] | CT | Down-sample + up-sample | 80.9 |
| Ours | PET-CT | Down-sample + up-sample | 83.53 |
| Skip connection | |||
| Auxiliary paths |
Qualitative Results
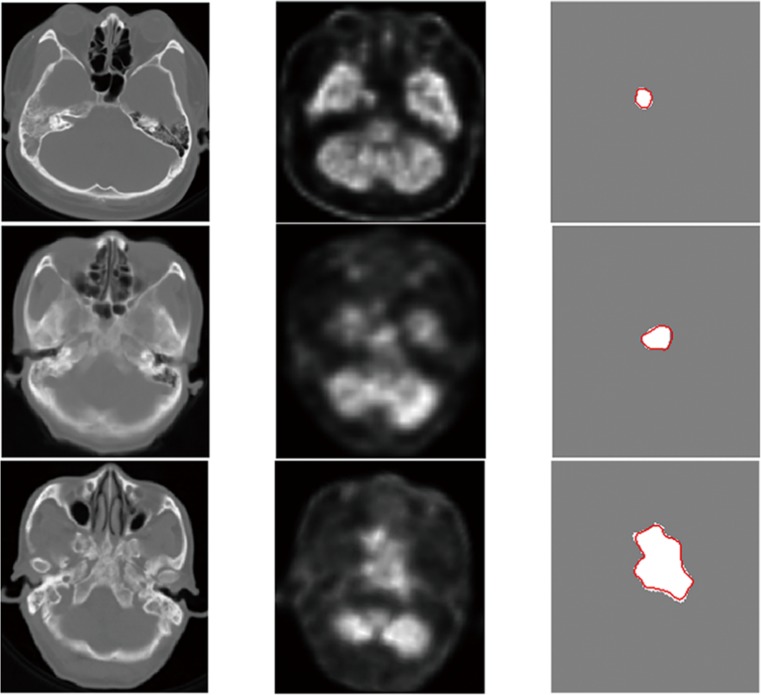
Several examples of visualized testing results are displayed in Fig. 6, where the first, second, and third columns illustrate the CT images, PET images, and ground truths (white) and automatic segmentation boundaries (red), respectively. The automatic segmentation and ground truth overlapped almost completely, although the tumor exhibited varying sizes and shapes, considerably low-intensity contrast between the tumor and the adjacent anatomical structures (second row), and an extremely irregular boundary (third row).
Fig. 6.
Examples of qualitative result. The first, second, and third columns illustrate the CT images, PET images, and the white areas and red curves represent the ground truths and automatic segmentation boundaries, respectively
Conclusions
We developed an FCN with auxiliary paths for automatic segmentation of NPC on PET-CT images. This work is the first to segment NPC based on dual-modality PET-CT images. We began from a preprocessing stage that included data registration among different subjects and other processes. During training, we implemented a deep supervision technique by adding auxiliary paths to the network. This technique can improve the discriminative capability of the network by explicitly directing the training of hidden layers. Then, a simple and efficient post-processing procedure was used to reduce the number of false positive. Threefold cross-validation results indicate that our approach is robust, and it remarkably outperforms state-of-the-art methods in NPC segmentation. We also confirmed by experiments that several components, such as simple data registration process and auxiliary path strategy, are considerably useful techniques for learning discriminative features and improving segmentation performance.
A disadvantage of our method is that the dataset is limited, such that an outlier appears. Therefore, in next work, we intend to collect more data to train a highly robust model. Another deficiency is that sequential information between consecutive slices was not utilized when we separated a 3D image into many 2D slices, implemented segmentation on each 2D slice, and concatenated the 2D results to acquire the 3D segmentation result. In future work, we plan to exploit 3D convolution to model the correlations between slices and further enhance performance.
Funding information
This work was supported by the National Natural Science Foundation Joint Fund Key Support Project under Grant U1501256 and the Applied Science and Technology Research and Development Special Project in Guangdong Province (No. 2015B010131011).
Footnotes
Publisher’s Note
Springer Nature remains neutral with regard to jurisdictional claims in published maps and institutional affiliations.
References
- 1.Tang LL, Chen WQ, Xue WQ. Global trends in incidence and mortality of nasopharyngeal carcinoma. Cancer Lett. 2016;374(1):22–30. doi: 10.1016/j.canlet.2016.01.040. [DOI] [PubMed] [Google Scholar]
- 2.Wu HB, Wang QS, Wang MF. Preliminary study of 11C-choline PET/CT for T staging of locally advanced nasopharyngeal carcinoma: comparison with 18F-FDG PET/CT. J Nucl Med. 2011;52(3):341–346. doi: 10.2967/jnumed.110.081190. [DOI] [PubMed] [Google Scholar]
- 3.Huang W, Chan KL, Zhou JY. Region-Based Nasopharyngeal Carcinoma Lesion Segmentation from MRI Using Clustering- and Classification-Based Methods with Learning. J Digit Imaging. 2013;26(3):472–482. doi: 10.1007/s10278-012-9520-4. [DOI] [PMC free article] [PubMed] [Google Scholar]
- 4.Han DF, Bayouth J, Song Q: Globally Optimal Tumor Segmentation in PET-CT Images: A Graph-Based Co-Segmentation Method. International Conference on Information Processing in Medical Imaging, 2011, pp 245–256 [DOI] [PMC free article] [PubMed]
- 5.Song Q, Bai J, Han D. Optimal co-segmentation of tumor in PET-CT images with context information. IEEE Trans Med Imaging. 2013;32(9):1685–1697. doi: 10.1109/TMI.2013.2263388. [DOI] [PMC free article] [PubMed] [Google Scholar]
- 6.Ju W, Xiang D, Zhang B. Random Walk and Graph Cut for Co-Segmentation of Lung Tumor on PET-CT Images. IEEE Trans Image Process. 2015;24(12):5854–5867. doi: 10.1109/TIP.2015.2488902. [DOI] [PubMed] [Google Scholar]
- 7.Éloïse C, Talbot H, Passat N: Automated 3D lymphoma lesion segmentation from PET/CT characteristic. IEEE International Symposium on Biomedical Imaging, 2017, pp 174–178
- 8.Wang Y, Zu C, Hu GL. Automatic Tumor Segmentation with Deep Convolutional Neural Networks for Radiotherapy Applications. Neural Process Lett. 2018;10:1–12. [Google Scholar]
- 9.Tatanun C, Ritthipravat P, Bhongmakapat T: Automatic segmentation of nasopharyngeal carcinoma from CT images: Region growing based technique. 2010 2nd International Conference on Signal Processing System, 2010, pp 18–22
- 10.Chanapai W, Bhongmakapat T, Tuntiyatorn L. Nasopharyngeal carcinoma segmentation using a region growing technique. Int J Comput Assist Radiol Surg. 2012;7(3):413–422. doi: 10.1007/s11548-011-0629-6. [DOI] [PubMed] [Google Scholar]
- 11.Huang KW, Zhao ZY, Gong Q: Nasopharyngeal carcinoma segmentation via HMRF-EM with maximum entropy. Eng Med Biol Soc:2968–2972, 2015 [DOI] [PubMed]
- 12.Fitton I, Cornelissen SA, Duppen JC. Semi-automatic delineation using weighted CT-MRI registered images for radiotherapy of nasopharyngeal cancer. Med Phys. 2011;38(8):4662–4666. doi: 10.1118/1.3611045. [DOI] [PubMed] [Google Scholar]
- 13.Wu PX, Khong PL, Chan T. Automatic detection and classification of nasopharyngeal carcinoma on PET/CT with support vector machine. Int J Comput Assist Radiol Surg. 2012;7(4):635–646. doi: 10.1007/s11548-011-0669-y. [DOI] [PubMed] [Google Scholar]
- 14.Mohammed MA, Ghani MKA, Hamed RI. Artificial neural networks for automatic segmentation and identification of nasopharyngeal carcinoma. J Comput Sci. 2017;21:263–274. doi: 10.1016/j.jocs.2017.03.026. [DOI] [Google Scholar]
- 15.Men K, Chen X, Zhang Y. Deep Deconvolutional Neural Network for Target Segmentation of Nasopharyngeal Cancer in Planning Computed Tomography Images. Front Oncol. 2017;7:315–323. doi: 10.3389/fonc.2017.00315. [DOI] [PMC free article] [PubMed] [Google Scholar]
- 16.Ronneberger O, Fischer P, Brox T: U-net: Convolutional networks for biomedical image segmentation. International Conference on Medical Image Computing and Computer-Assisted Intervention, 2015, pp 234–241
- 17.Brosch T, Tang L, Yoo YJ. Deep 3D Convolutional Encoder Networks with Shortcuts for Multiscale Feature Integration Applied to Multiple Sclerosis Lesion Segmentation. IEEE Trans Med Imaging. 2016;35(5):1229–1239. doi: 10.1109/TMI.2016.2528821. [DOI] [PubMed] [Google Scholar]
- 18.Milletari F, Navab N, Ahmadi S: V-Net: Fully Convolutional Neural Networks for Volumetric Medical Image Segmentation. Fourth International Conference on 3d Vision, 2016, pp 565–571
- 19.Dong H, Yang G, Liu F D: Automatic Brain Tumor Detection and Segmentation Using U-Net Based Fully Convolutional Networks. Conference on Medical Image Understanding and Analysis, 2017, pp 506–517
- 20.Christ PF, Ettlinger F, Grün F: Automatic Liver and Tumor Segmentation of CT and MRI Volumes using Cascaded Fully Convolutional Neural Networks. arXiv preprint (arXiv:1702.05970v2), 2017
- 21.Kamnitsas K, Ledig C, Newcombe VFJ. Efficient multi-scale 3D CNN with fully connected CRF for accurate brain lesion segmentation. Med Image Anal. 2017;36:61–78. doi: 10.1016/j.media.2016.10.004. [DOI] [PubMed] [Google Scholar]
- 22.Ioffe S, Szegedy C: Batch normalization: Accelerating deep network training by reducing internal covariate shift. International Conference on International Conference on Mach Learn, 2015, pp 448–456
- 23.Dou Q, Yu L, Chen H. 3D deeply supervised network for automated segmentation of volumetric medical images. Med Image Anal. 2017;41:40–54. doi: 10.1016/j.media.2017.05.001. [DOI] [PubMed] [Google Scholar]
- 24.Tseng K L, Lin Y L, Hus W: Joint Sequence Learning and Cross-Modality Convolution for 3D Biomedical Segmentation. arXiv preprint (arXiv:1704.07754), 2017
- 25.Pereira S, Pinto A, Alves V. Brain Tumor Segmentation Using Convolutional Neural Networks in MRI Images. IEEE Trans Med Imaging. 2016;35(5):1240–1251. doi: 10.1109/TMI.2016.2538465. [DOI] [PubMed] [Google Scholar]
- 26.He KM, Zhang XY, Ren SQ: Delving deep into rectifiers: Surpassing human-level performance on imagenet classification. Proceedings of the IEEE international conference on computer vision, 2015, pp 1026–1034
- 27.Dice LR. Measures of the Amount of Ecologic Association Between Species. Ecology. 1945;26(3):297–302. doi: 10.2307/1932409. [DOI] [Google Scholar]


