Abstract
Spontaneous echo contrast (SEC) indicates blood stasis in cardiac chambers and major vessels, and is a known precursor of thrombus formation. Transesophageal echocardiography plays a pivotal role in detecting and grading SEC in the left atrial (LA) cavity. Assessing LA SEC can identify patients at increased risk for thromboembolic events. LA SEC also develops in patients who have sinus rhythm, especially in those with heart failure. Detection of LA SEC is not uncommon in subjects who have multiple cardiovascular comorbidities, although mechanisms behind this association are not fully understood. In patients with atrial fibrillation, the role of mitral regurgitation in counteracting LA SEC and subsequent thromboembolism is controversial. Moreover, alterations of blood coagulability and elevated levels of certain biological markers in the blood contribute to occurrence of LA SEC. This review describes the pathogenesis and assessment of SEC, in addition to the relationship between LA SEC and clinical, biological and echocardiographic parameters.
Keywords: left atrial spontaneous echo contrast, trasnsesophageal echocardiography, atrial fibrillation, biological markers, heart failure
Introduction
It has been known for more than three decades that blood reflections within the cardiac chambers, which can be observed with echocardiography and are known as spontaneous echo contrast (SEC), indicate the presence of blood stagnation and are a precursor of thrombus formation (1, 2). The pathogenesis of SEC is complex, with multiple interrelated contributory factors. With the advent of transesophageal echocardiography (TEE), SEC came to be more clearly observed (3, 4). Since then, a number of reports have been published on TEE-assessed SEC which provide diagnostic, therapeutic and prognostic information on various cardiac conditions. The appearance and severity of SEC, however, depends on technical factors such as gain settings, and no clearly standardized method for assessing SEC has existed. This review starts to describe the pathogenesis and assessment of SEC, and then extends to the relationship of LA SEC with various clinical, biological and echocardiographic parameters.
Pathogenesis of SEC
In 1983, Sigel et al. found in their experimental study that SEC indicated red cell aggregation by demonstrating that SEC severity, as determined by the video densitometric method, correlated positively with hematocrit and fibrinogen concentration, and inversely with shear stress (5, 6, 7). Black et al. initially confirmed the relationship between SEC and blood components in patients with atrial fibrillation (AF), and found that LA SEC appeared in relation to hematocrit, fibrinogen concentration and LA dimension, but not to platelet count (8).
Fatkin et al. emphasized the importance of low shear stress conditions for the occurrence of SEC by demonstrating that echogenicity from human blood could be increased with the high- to low-velocity settings, at any given level of hematocrit or fibrinogen concentration (9). Clinically, a condition of low shear stress is often observed within the left atrium in patients with AF and in those with mitral valve disease (2, 10), and it can be estimated by substituting decreased LA appendage velocity (11, 12).
Virchow’s triad of factors related to thrombus formation includes abnormal changes in flow, blood constituents and vessel walls. SEC may fulfill the first two components for thrombogenesis (12). For the remaining triad component, abnormal changes in vessel walls (atrial wall), there is no direct evidence that this exists in SEC. Figure 1 shows very severe SEC in the cardiac chambers from a patient with prior mitral valve replacement surgery. In a sense, post artificial valve replacement surgery seems to be a condition of ‘abnormal changes in vessel walls’. Some investigators propose that the mechanism behind SEC occurring after valve replacement, lies in the oxygen released from hemolysing red blood cells or in fibers emanating from a cloth-covered prosthesis (13).
Figure 1.
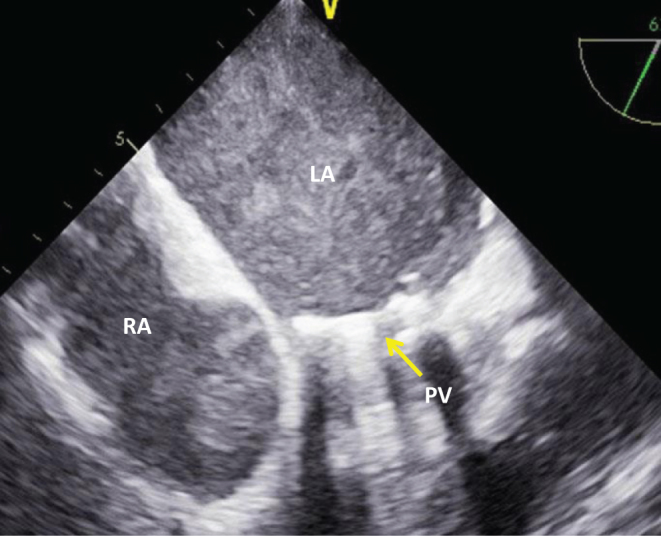
Very dense SEC in both atria imaged on transesophageal echocardiography from a patient with prior mitral valve replacement surgery. LA, left atrium; PV, prosthetic valve; RA, right atrium.
Assessment of LA SEC
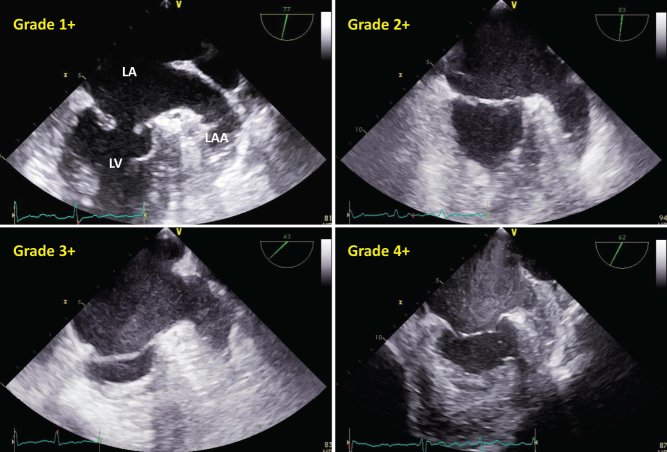
Assessment of LA SEC is useful because it can help stratify patients at high risk of embolic events who require anticoagulation treatment (8). The severity of LA SEC has been assessed in a qualitative, as well as quantitative, fashion. LA SEC is qualified simply as none, mild and severe (2, 14), although most investigators use the semi-quantitative method proposed by Fatkin et al., who demonstrated an excellent correlation of visual grading of SEC (grade 0–4+) against video-densitometry analysis (9, 15). The scoring system for LA SEC, proposed by Fatkin et al. (11), and examples of TEE images for correspondent SEC grades are shown in Fig. 2 and Table 1, respectively.
Figure 2.
Representative transesophageal echocardiographic images in four cases showing SEC grades 1+ to 4+, respectively. Note that with SEC grade 1+, minimal echogenicity can be seen within the left atrial appendage (LAA) and that with SEC grade 4+, the swirling pattern is remarkable compared with SEC grade 3+. LA, left atrium; LV, left ventricle.
Table 1.
Scoring system for LA SEC (11).
| Grade | Definition |
|---|---|
| 0 | None (absence of echogenicity) |
| 1+ | Mild (minimal echogenicity located in the LA appendage or sparely distributed in the main cavity of the left atrium; may be detectable only transiently during the cardiac cycle; imperceptible at operating gain settings for two dimensional echocardiographic analysis) |
| 2+ | Mild to moderate (more dense swirling pattern than grade 1+ but with similar distribution; detectable without increased gain settings) |
| 3+ | Moderate (dense swirling pattern in the LAA, generally associated with somewhat lesser intensity in the main cavity; may fluctuate in intensity but detectable constantly throughout the cardiac cycle) |
| 4+ | Severe (intense echo density and very slow swirling patterns in the LAA, usually with similar density in the main cavity) |
Klein et al. developed a sophisticated method of quantifying LA SEC using integrated backscatter (16). They found a good correlation between integrated backscatter-derived intensity of LA SEC and the qualitative measures. Another observation on integrated backscatter used to assess LA SEC was that the intensity of SEC in the LA appendage was greater than that of SEC in the main LA cavity, supporting the fact that a thrombus favors the LA appendage rather than the main LA cavity (17). However, with the use of either qualitative or quantitative methods for assessing SEC, care should be taken for optimal analysis to minimize the influence of ultrasound system controls such as gain settings (12).
The method employed in our institution for grading LA SEC, while optimizing the ultrasound machine settings, is as follows (Fig. 2, Table 1 and Videos 1, 2, 3, 4). First, in most cases, we perform TEE with the time-gain-control at the basic position, whereas the total gain control is used only for discriminating SEC grade 1+ from 2+. With SEC grade 2+, SEC is visible at any allowable level of the gain setting (Table 1). Second, one should pay attention not only to blood density, but also to the swirling pattern of SEC; in our experience, the swirling pattern can be seen in more than SEC grade 3+. The swirling speed of SEC looks much lower in SEC grade 4+ compared with 3+ (Videos 3 and 4). Also, LA appendage sludge (mentioned later) is prone to occur in SEC grade 4+.
Transesophageal echocardiographic image of SEC grade 1 (mild): note that minimal echogenicity can be seen within the left atrial appendage. View Video 1 at http://movie-usa.glencoesoftware.com/video/10.1530/ERP-18-0083/video-1.
Download Video 1 (1.3MB, mpg)
Transesophageal echocardiographic image of SEC grade 2 (mild to moderate): see main text and Table 1 for details. View Video 2 at http://movie-usa.glencoesoftware.com/video/10.1530/ERP-18-0083/video-2.
Download Video 2 (1.5MB, mpg)
Transesophageal echocardiographic image of SEC grade 3 (moderate): see main text and Table 1 for details. View Video 3 at http://movie-usa.glencoesoftware.com/video/10.1530/ERP-18-0083/video-3.
Download Video 3 (880KB, mpg)
Transesophageal echocardiographic image of SEC grade 4 (severe): note that the swirling pattern is remarkable and slowly moving compared with SEC grade 3+, and that sludge is perceptible within the appendage. View Video 4 at http://movie-usa.glencoesoftware.com/video/10.1530/ERP-18-0083/video-4.
Download Video 4 (1.8MB, mpg)
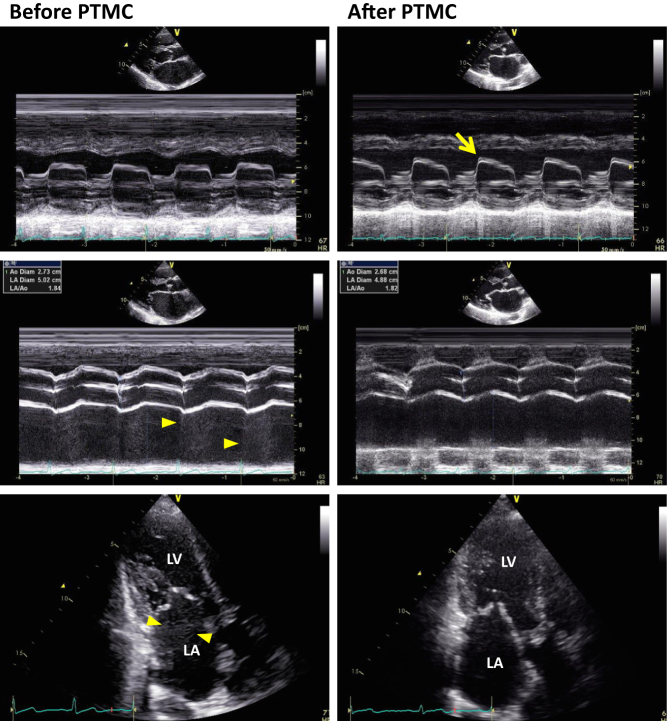
LA SEC is not infrequently observed with transthoracic echocardiography (TTE), especially in mitral valve disease (Fig. 3 and Videos 5, 6). Beppu et al. found that LA SEC was commonly seen in patients with mitral stenosis and that its presence was associated with lower cardiac output, larger LA size and smaller mitral valve area (18). Although LA SEC is difficult to see with TTE due to the use of a relatively low-frequency transducer and the attenuated ultrasound signals, the development of transthoracic harmonic imaging, which involves transmitting ultrasound at one frequency and receiving at twice the transmitted frequency, has permitted detection of LA SEC relatively easily. Ha et al. reported that among 38 patients with mitral stenosis, the sensitivity for detection of LA SEC was 100% with harmonic imaging and 13.2% with non-harmonic (fundamental) imaging (19). Harmonic imaging is incorporated in currently available high-end ultrasound machines.
Figure 3.
Transthoracic echocardiographic images before and after percutaneous transluminal mitral commissurotomy (PTMC) from a patient with severe mitral stenosis. Note that before PTMC, SEC (arrowheads) was seen in the left atrium (LA) with both M-mode (mid) and 2D methods (bottom) despite sinus rhythm, and that after PTMC, SEC disappeared concomitantly with improved mitral valve opening (arrow) (top).
2D echocardiographic image of the apical long-axis view from a patient with mitral stenosis before percutaneous transluminal mitral commissurotomy (PTMC): note that SEC can be seen within the left atrium (LA). View Video 5 at http://movie-usa.glencoesoftware.com/video/10.1530/ERP-18-0083/video-5.
Download Video 5 (1.1MB, mpg)
2D echocardiographic image of the apical long-axis view from a patient with mitral stenosis after percutaneous transluminal mitral commissurotomy (PTMC): note that with mitral valve opening improved, SEC is not evident in the left atrium (LA). View Video 6 at http://movie-usa.glencoesoftware.com/video/10.1530/ERP-18-0083/video-6.
Download Video 6 (1.1MB, mpg)
LA appendage sludge
With increasing use of TEE in the era of pulmonary vein isolation to assess for LA thrombus, sludge within the LA appendage has attracted interest from clinicians. LA appendage sludge indicates a dynamic, viscid, layered echo dense finding without a discrete mass (Fig. 4). It appears more dense than SEC and less dense than a thrombus, and is therefore considered to be a stage between SEC and thrombus formation (20, 21). This is explained by a previous observation that sludge was abolished with appropriate anticoagulation, in contrast to SEC (22, 23).
Figure 4.
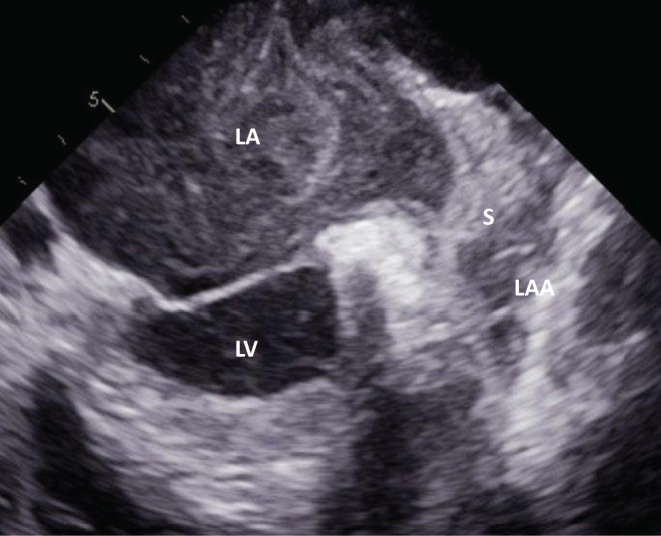
Left atrial appendage sludge (S). LAA, left atrial appendage.
Similar to LA SEC, LA appendage sludge can be a risk of thromboembolism, but data on this association are scarce. Lowe et al. found 47 out of 340 patients with AF who underwent TEE prior to direct cardioversion or pulmonary vein isolation to have LA appendage sludge (20). They found that LA appendage sludge was associated with enlarged left atrium, reduced LA appendage velocity and reduced LV ejection fraction, and that sludge was an independent predictor of embolic events and all-cause mortality (20). Hajjiri et al. observed that 8 of 1076 patients had LA appendage sludge and that none of the sludge-positive patients experienced embolic events during or after a pulmonary vein isolation procedure (21). A large-scale prospective study is needed to determine how to interpret and deal with LA appendage sludge.
LA SEC and mitral regurgitation
In the 1990s, several investigators suggested that mitral regurgitation (MR) prevented SEC and thrombus formation in the LA cavity (24, 25, 26). This way of thinking is reasonable, since turbulent flow into the LA cavity makes shear stress increase, thereby preventing red blood cells from aggregating. In fact, it was observed that among patients with nonvalvular AF, those with significant MR had lower integrated backscatter values in the LA cavity compared with those without (14).
Movsowitz et al. and later Hwang et al. reported that among AF patients of various etiologies, those with more-than-mild MR were associated much less with LA SEC, compared to those with mild-or-no MR (24, 25). Similar findings were observed when AF patients were restricted to ‘nonvalvular’ (26). Other investigators, however, did not find MR severity in nonvalvular AF patients to have as much an effect on a history of stroke, irrespective of the severity of LA SEC (27). There has recently been more evidence published that LA thrombus or SEC appears after the MitraClip procedure, which may prompt cardiologists to set an appropriate anticoagulation regimen during and after this procedure (28, 29, 30).
Given that shear stress correlates directly with blood velocity and inversely with chamber diameter (2), increased LA size as a result of severe and long-standing MR may be an exacerbating factor of LA SEC. Moreover, severe MR can often be associated with heart failure, which is identified as a prothrombotic state (31).
Impact of heart failure on LA SEC
From a therapeutic viewpoint, the presence or absence of LA SEC may be of great importance in the management of heart failure patients. Among patients with nonvalvular AF, plasma B-type natriuretic peptide (BNP) and the tissue Doppler-derived E/e’, both surrogates for LV filling pressure, were shown to be predictive of LA thrombus and SEC (32, 33). Taking into consideration that ‘heart failure’ is built into the CHADS2/CHA2DS2-VASc score, association between SEC and heart failure is plausible.
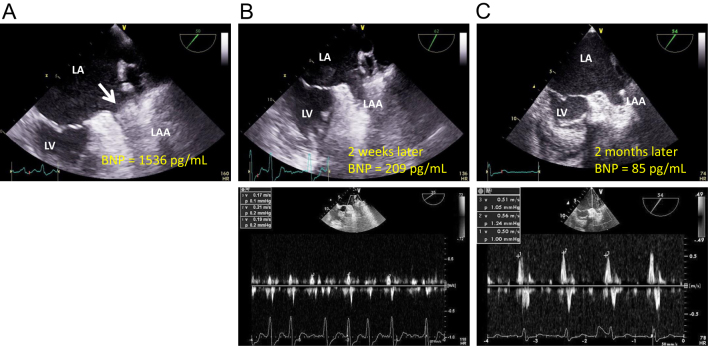
Tabata et al. found that elevated pulmonary artery wedge pressure was associated with reduced LA appendage velocities, even in patients with sinus rhythm, and that some of the patients had LA SEC and/or appendage thrombus (34). Their findings are supported by the clinical, as well as experimental, observation that LA appendage velocities decreased with increased loading conditions (35, 36). Taken together, there is no doubt that in heart failure patients, treatment which decreases LV filling pressure would be one of the tasks of immediate importance required to reduce a risk of embolic events (Fig. 5).
Figure 5.
Transesophageal echocardiographic recordings during the time-course of anticoagulation therapy from a patient with nonvalvular atrial fibrillation complicated by heart failure. At the beginning (A), a thrombus occupying the left atrial appendage (LAA) was present. Starting with heart failure treatment with therapeutic anticoagulation (B), the B-type natriuretic peptide (BNP) level decreased and LAA thrombus resolved (top) although SEC and LAA dysfunction (bottom) still were observed. Two months later (C), when the patients had spontaneously been recovered to sinus rhythm, a further decrease in the BNP level and a marked increase in the LAA velocities (bottom) were observed.
LA SEC and CHADS2/CHA2DS2-VASc scores
Quite a few reports have appeared over the past decade on the relationship of TEE-derived parameters with the CHADS2/CHA2DS2-VASc score. In many cases, the prevalence of LA SEC was shown to increase as CHADS2/CHA2DS2-VASc score became higher (37, 38). A possible explanation for this association is that an elevated CHADS2/CHA2DS2-VASc score is often accompanied by conditions predisposed to thrombosis, such as increased LA volume and impaired LV systolic function (39, 40).
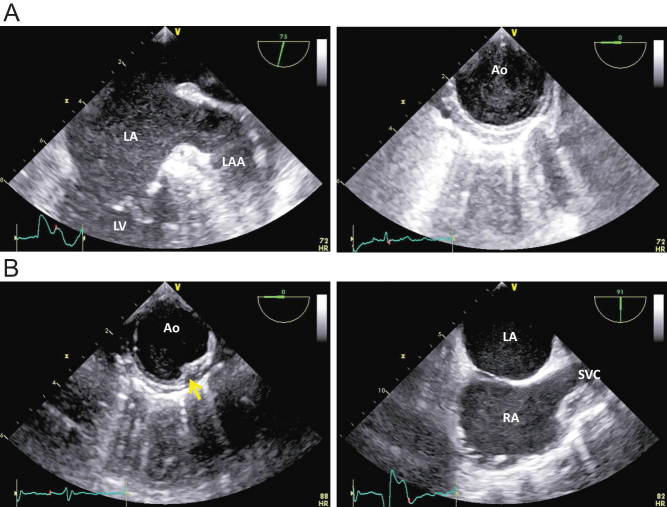
In addition, components listed on the CHADS2/CHA2DS2-VASc score (hypertension, diabetes, heart failure, etc.) involve a certain nature of the inflammatory state, and thus, there may be various inflammatory cytokines (IL-6, TGF-α, CRP, etc.) present as abnormal blood constituents in both the systemic circulation and in the left atrium (41, 42). Interestingly, patients with multiple cardiovascular risk factors were shown to have intra-aortic SEC observed with TEE (43). Figure 6 shows example TEE images of cases in which intra-aortic SEC is found concomitantly with LA SEC in patients with nonvalvular AF.
Figure 6.
(A) Dense SEC in the descending aorta (Ao) coincidentally found with LA SEC from a patient with nonvalvular atrial fibrillation. (B) Slight SEC in the descending aorta (Ao) with a mural plaque (arrow) observed from another patient with nonvalvular atrial fibrillation. Note that SEC in the right atrium (RA), swiftly flowing from the superior vena cava (SVC), is denser than SEC in the LA, indicating that some pathological factors that generate RA SEC might be involved in this patient.
Biomarkers and LA SEC
As mentioned, SEC indicates not only a hypercoagulable but also an inflammatory state, although information is limited on the relationship between LA SEC and biomarkers in the blood. Various inflammatory cytokines were shown to be elevated in AF patients (41). Among patients with nonvalvular AF, for example, C-reactive protein (CRP) levels were found to be directly positively associated with CHADS2 score. This raises the hypothesis that LA SEC correlates with CRP levels; studies have found that the incidence of LA SEC increased with elevated CHADS2 score and CRP levels (44, 45).
There are reports on the association between LA SEC and coagulation markers. Heppell et al. showed that altered hemostatic factors, such as d-dimer, β-thromboglobulin and von Willebrand factor, were all predictive of LA SEC and thrombus formation (46). A recent meta-analysis demonstrated that d-dimer measurements were useful for the identification of LA thrombus and SEC with a sensitivity and specificity of 75 and 81%, respectively (47). Among AF patients who underwent pulmonary vein isolation, the incidence of elevated d-dimer levels was higher in the left atrium than in the systemic circulation, with the trend being more pronounced in those who had large LA size (48).
Unrelated to SEC, it was found that in AF patients, some platelet factors in the blood (platelet factor 4 and plasmin-α 2-plasmin inhibitor complex) were similarly elevated in patients with chronic AF versus those with paroxysmal AF (49). This finding may substantiate the notion that patients with paroxysmal AF have as much a risk for embolic events as those with non-paroxysmal AF, and therefore definitely require anticoagulant treatment.
Conclusions
LA SEC occurs under various pathological conditions, including anatomical, hemodynamic and biological changes. This raises the hypothesis that therapeutic strategies to modify these parameters may reduce SEC, thereby reducing the risk of embolic events. The disorganized LA contraction characteristic of AF is another important consideration in the pathogenesis of LA SEC, treatement of which may facilitate AF patients to recover to sinus rhythm and prevent atrial thrombosis (Fig. 5). Large prospective studies are needed to verify such a hypothesis.
Declaration of interest
The authors declare that there is no conflict of interest that could be perceived as prejudicing the impartiality of the research reported.
Funding
This paper did not receive any specific grant from any funding agency in the public, commercial or not-for-profit sector.
References
- 1.Gramiak R, Shah PM. Detection of intracardiac blood flow by pulsed echo-ranging ultrasound. Radiology 1971. 100 415–418. ( 10.1148/100.2.415) [DOI] [PubMed] [Google Scholar]
- 2.Beppu S, Nimura Y, Sakakibara H, Nagata S, Park YD, Izumi S. Smoke-like echo in the left atrial cavity in mitral valve disease: its features and significance. Journal of the American College of Cardiology 1985. 6 744–749. ( 10.1016/S0735-1097(85)80476-9) [DOI] [PubMed] [Google Scholar]
- 3.Erbel R, Stern H, Ehrenthal W, Schreiner G, Treese N, Kramer G, Thelen M, Schweizer P, Meyer J. Detection of spontaneous echocardiographic contrast within the left atrium by transesophageal echocardiography: spontaneous echocardiographic contrast. Clinical Cardiology 1986. 9 245–252. ( 10.1002/clc.4960090603) [DOI] [PubMed] [Google Scholar]
- 4.Black IW, Hopkins AP, Lee LC, Walsh WF. Left atrial spontaneous echo contrast: a clinical and echocardiographic analysis. Journal of the American College of Cardiology 1991. 18 398–404. ( 10.1016/0735-1097(91)90592-W) [DOI] [PubMed] [Google Scholar]
- 5.Sigel B, Coelho JC, Schade SG, Justin J, Spigos DG. Effect of plasma proteins and temperature on echogenicity of blood. Investigative Radiology 1982. 17 29–33. ( 10.1097/00004424-198201000-00005) [DOI] [PubMed] [Google Scholar]
- 6.Sigel B, Machi J, Beitler JC, Justin JR. Red cell aggregation as a cause of blood-flow echogenicity. Radiology 1983. 148 799–802. ( 10.1148/radiology.148.3.6878705) [DOI] [PubMed] [Google Scholar]
- 7.Izumida Y, Seiyama A, Maeda N. Erythrocyte aggregation: bridging by macromolecules and electrostatic repulsion by sialic acid. Biochimica and Biophysica Acta 1991. 1067 221–226. ( 10.1016/0005-2736(91)90047-C) [DOI] [PubMed] [Google Scholar]
- 8.Black IW, Chesterman CN, Hopkins AP, Lee LC, Chong BH, Walsh WF. Hematologic correlates of left atrial spontaneous echo contrast and thromboembolism in nonvalvular atrial fibrillation. Journal of the American College of Cardiology 1993. 21 451–457. ( 10.1016/0735-1097(93)90688-W) [DOI] [PubMed] [Google Scholar]
- 9.Fatkin D, Loupas T, Jacobs N, Feneley MP. Quantification of blood echogenicity: evaluation of a semiquantitative method of grading spontaneous echo contrast. Ultrasound in Medicine and Biology 1995. 21 1191–1198. ( 10.1016/0301-5629(95)02006-3) [DOI] [PubMed] [Google Scholar]
- 10.Black IW, Hopkins AP, Lee LC, Walsh WF. Left atrial spontaneous echo contrast: a clinical and echocardiographic analysis. Journal of the American College of Cardiology 1991. 18 398–404. ( 10.1016/0735-1097(91)90592-W) [DOI] [PubMed] [Google Scholar]
- 11.Fatkin D, Kelly RP, Feneley MP. Relations between left atrial appendage blood flow velocity, spontaneous echocardiographic contrast and thromboembolic risk in vivo. Journal of the American College of Cardiology 1994. 23 961–969. ( 10.1016/0735-1097(94)90644-0) [DOI] [PubMed] [Google Scholar]
- 12.Black IW. Spontaneous echo contrast: where there’s smoke there’s fire. Echocardiography 2000. 17 373–382. ( 10.1111/j.1540-8175.2000.tb01153.x) [DOI] [PubMed] [Google Scholar]
- 13.Schuchman H, Feigenbaum H, Dillon JC, Chang S. Intracavitary echoes in patients with mitral prosthetic valves. Journal of Clinical Ultrasound 1975. 3 107–110. ( 10.1002/jcu.1870030206) [DOI] [PubMed] [Google Scholar]
- 14.Ito T, Suwa M, Kobashi A, Yagi H, Nakamura T, Miyazaki S, Kitaura Y. Integrated backscatter assessment of left atrial spontaneous echo contrast in chronic nonvalvular atrial fibrillation: relation with clinical and echocardiographic parameters. Journal of the American Society of Echocardiography 2000. 13 666–673. ( 10.1067/mje.2000.104739) [DOI] [PubMed] [Google Scholar]
- 15.Fatkin D, Loupas T, Jacobs N, Feneley MP. Quantification of blood echogenicity: evaluation of a semiquantitative method of grading spontaneous echo contrast. Ultrasound in Medicine and Biology 1995. 21 1191–1198. ( 10.1016/0301-5629(95)02006-3) [DOI] [PubMed] [Google Scholar]
- 16.Klein AL, Murray RD, Black IW, Chandra S, Grimm RA, DSa DA, Leung DY, Miller D, Morehead AJ, Vaughn SE, et al Integrated backscatter for quantification of left atrial spontaneous echo contrast. Journal of the American College of Cardiology 1996. 28 222–231. [DOI] [PubMed] [Google Scholar]
- 17.Ito T, Suwa M, Nakamura T, Miyazaki S, Kobashi A, Kitaura Y. Quantification of left atrial appendage spontaneous echo contrast in patients with chronic nonvalvular atrial fibrillation. Journal of Cardiology 2001. 37 325–333. [PubMed] [Google Scholar]
- 18.Beppu S, Nimura Y, Sakakibara H, Nagata S, Park YD, Izumi S. Smoke-like echo in the left atrial cavity in mitral valve disease: its features and significance. Journal of the American College of Cardiology 1985. 6 744–749. ( 10.1016/S0735-1097(85)80476-9) [DOI] [PubMed] [Google Scholar]
- 19.Ha JW, Chung N, Kang SM, Jang KJ, Kim IJ, Rim SJ, Jang Y, Shim WH, Cho SY, Kim SS. Enhanced detection of left atrial spontaneous echo contrast by transthoracic harmonic imaging in mitral stenosis. Journal of the American Society of Echocardiography 2000. 13 849–854. ( 10.1067/mje.2000.106791) [DOI] [PubMed] [Google Scholar]
- 20.Lowe BS, Kusunose K, Motoki H, Varr B, Shrestha K, Whitman C, Tang WH, Thomas JD, Klein AL. Prognostic significance of left atrial appendage ‘sludge’ in patients with atrial fibrillation: a new transesophageal echocardiographic thromboembolic risk factor. Journal of the American Society of Echocardiography 2014. 27 1176–1183. ( 10.1016/j.echo.2014.08.016) [DOI] [PubMed] [Google Scholar]
- 21.Hajjiri M, Bernstein S, Saric M, Benenstein R, Aizer A, Dym G, Fowler S, Holmes D, Bernstein N, Mascarenhas M, et al. LAtrial fibrillation ablation in patients with known sludge in the left atrial appendage. Journal of Interventional Cardiac Electrophysiology 2014. 40 147–151. ( 10.1007/s10840-014-9892-0) [DOI] [PubMed] [Google Scholar]
- 22.Fatkin D, Loupas T, Low J, Feneley M. Inhibition of red cell aggregation prevents spontaneous echocardiographic contrast formation in human blood. Circulation 1997. 96 889–896. ( 10.1161/01.CIR.96.3.889) [DOI] [PubMed] [Google Scholar]
- 23.Ito T, Suwa M, Nakamura T, Miyazaki S, Hirota Y, Kawamura K. Influence of warfarin therapy on left atrial spontaneous echo contrast in nonvalvular atrial fibrillation. American Journal of Cardiology 1999. 84 857–859, A8. ( 10.1016/S0002-9149(99)00451-8) [DOI] [PubMed] [Google Scholar]
- 24.Movsowitz C, Movsowitz HD, Jacobs LE, Meyerowitz CB, Podolsky LA, Kotler MN. Significant mitral regurgitation is protective against left atrial spontaneous echo contrast and thrombus as assessed by transesophageal echocardiography. Journal of the American Society of Echocardiography 1993. 6 107–114. ( 10.1016/S0894-7317(14)80480-X) [DOI] [PubMed] [Google Scholar]
- 25.Hwang JJ, Shyu KG, Hsu KL, Chen JJ, Kuan P, Lien WP. Significant mitral regurgitation is protective against left atrial spontaneous echo contrast formation, but not against systemic embolism. Chest 1994. 106 8–12. ( 10.1378/chest.106.1.8) [DOI] [PubMed] [Google Scholar]
- 26.Nakagami H, Yamamoto K, Ikeda U, Mitsuhashi T, Goto T, Shimada K. Mitral regurgitation reduces the risk of stroke in patients with nonrheumatic atrial fibrillation. American Heart Journal 1998. 136 528–532. ( 10.1016/S0002-8703(98)70231-5) [DOI] [PubMed] [Google Scholar]
- 27.Fukuda N, Hirai T, Ohara K, Nakagawa K, Nozawa T, Inoue H. Relation of the severity of mitral regurgitation to thromboembolic risk in patients with atrial fibrillation. International Journal of Cardiology 2011. 146 197–201. ( 10.1016/j.ijcard.2009.06.051) [DOI] [PubMed] [Google Scholar]
- 28.Ohno Y, Attizzani GF, Capodanno D, Dipasqua F, Barbanti M, Cannata S, Immé S, Ministeri M, Caggegi A, Pistritto AM, et al. Acute left atrial spontaneous echocardiographic contrast and suspicious thrombus formation following mitral regurgitation reduction with the MitraClip system. JACC: Cardiovascular Interventions 2014. 7 1322–1323. ( 10.1016/j.jcin.2014.04.027) [DOI] [PubMed] [Google Scholar]
- 29.Bekeredjian R, Mereles D, Pleger S, Krumsdorf U, Katus HA, Rottbauer W. Large atrial thrombus formation after MitraClip implantation: is anticoagulation mandatory? Journal of Heart Valve Disease 2011. 20 146–148. [PubMed] [Google Scholar]
- 30.Hamm K, Barth S, Diegeler A, Kerber S. Stroke and thrombus formation appending to the MitraClip: what is the appropriate anticoagulation regimen? Journal of Heart Valve Disease 2013. 22 713–715. [PubMed] [Google Scholar]
- 31.Yu GI, Cho KI, Kim HS, Heo JH, Cha TJ. Association between the N-terminal plasma brain natriuretic peptide levels or elevated left ventricular filling pressure and thromboembolic risk in patients with non-valvular atrial fibrillation. Journal of Cardiology 2016. 68 110–116. ( 10.1016/j.jjcc.2015.11.015) [DOI] [PubMed] [Google Scholar]
- 32.Doukky R, Gage H, Nagarajan V, Demopoulos A, Cena M, Garcia-Sayan E, Karam GJ, Kazlauskaite R. B-type natriuretic peptide predicts left atrial appendage thrombus in patients with nonvalvular atrial fibrillation. Echocardiography 2013. 30 889–895. ( 10.1111/echo.12169) [DOI] [PubMed] [Google Scholar]
- 33.Iwakura K, Okamura A, Koyama Y, Date M, Higuchi Y, Inoue K, Kimura R, Nagai H, Toyoshima Y, Ozawa M, et al. Effect of elevated left ventricular diastolic filling pressure on the frequency of left atrial appendage thrombus in patients with nonvalvular atrial fibrillation. American Journal of Cardiology 2011. 107 417–422. ( 10.1016/j.amjcard.2010.09.042) [DOI] [PubMed] [Google Scholar]
- 34.Tabata T, Oki T, Fukuda N, Iuchi A, Manabe K, Kageji Y, Sasaki M, Yamada H, Ito S. Influence of left atrial pressure on left atrial appendage flow velocity patterns in patients in sinus rhythm. Journal of the American Society of Echocardiography 1996. 9 857–864. ( 10.1016/S0894-7317(96)90478-2) [DOI] [PubMed] [Google Scholar]
- 35.Hoit BD, Shao Y, Gabel M. Influence of acutely altered loading conditions on left atrial appendage flow velocities. Journal of the American College of Cardiology 1994. 24 1117–1123. ( 10.1016/0735-1097(94)90878-8) [DOI] [PubMed] [Google Scholar]
- 36.Ito T, Suwa M, Kobashi A, Yagi H, Hirota Y, Kawamura K. Influence of altered loading conditions on left atrial appendage function in vivo. American Journal of Cardiology 1998. 81 1056–1059. ( 10.1016/S0002-9149(98)00011-3) [DOI] [PubMed] [Google Scholar]
- 37.Puwanant S, Varr BC, Shrestha K, Hussain SK, Tang WH, Gabriel RS, Wazni OM, Bhargava M, Saliba WI, Thomas JD, et al. Role of the CHADS2 score in the evaluation of thromboembolic risk in patients with atrial fibrillation undergoing transesophageal echocardiography before pulmonary vein isolation. Journal of the American College of Cardiology 2009. 54 2032–2039. ( 10.1016/j.jacc.2009.07.037) [DOI] [PubMed] [Google Scholar]
- 38.Zhang E, Liu T, Li Z, Zhao J, Li G. High CHA2DS2-VASc score predicts left atrial thrombus or spontaneous echo contrast detected by transesophageal echocardiography. International Journal of Cardiology 2015. 184 540–542. ( 10.1016/j.ijcard.2015.02.109) [DOI] [PubMed] [Google Scholar]
- 39.Topaz G, Pereg D, Shuvy M, Mausbach S, Kimiagar I, Telman G, Kitay-Cohen Y, Vorobeichik D, Shlomo N, Tanne D. Pre-admission CHA2DS2-VASc score and outcome of patients with acute cerebrovascular events. International Journal of Cardiology 2017. 244 277–281. ( 10.1016/j.ijcard.2017.06.057) [DOI] [PubMed] [Google Scholar]
- 40.Liu T, Shao Q, Korantzopoulos P, Miao S, Zhang Z, Xu G, Yuan R, Li G. Relation of red blood cell distribution width with CHADS2 and CHA2DS2-VASc score in Chinese patients with non-valvular atrial fibrillation. International Journal of Cardiology 2017. 228 861–864. ( 10.1016/j.ijcard.2016.11.255) [DOI] [PubMed] [Google Scholar]
- 41.Hijazi Z, Oldgren J, Siegbahn A, Granger CB, Wallentin L. Biomarkers in atrial fibrillation: a clinical review. European Heart Journal 2013. 34 1475–1480. ( 10.1093/eurheartj/eht024) [DOI] [PubMed] [Google Scholar]
- 42.Crandall MA, Horne BD, Day JD, Anderson JL, Muhlestein JB, Crandall BG, Weiss JP, Lappé DL, Bunch TJ. Atrial fibrillation and CHADS2 risk factors are associated with highly sensitive C-reactive protein incrementally and independently. Pacing and Clinical Electrophysiology 2009. 32 648–652. ( 10.1111/j.1540-8159.2009.02339.x) [DOI] [PubMed] [Google Scholar]
- 43.Leitman M, Sidenko S, Peleg E, Wolf R, Sucher E, Rosenblath S, Vered Z. Improved detection of spontaneous echo contrast in the aorta with tissue Doppler imaging. Echocardiography 2004. 21 503–508. ( 10.1111/j.0742-2822.2004.03065.x) [DOI] [PubMed] [Google Scholar]
- 44.Maehama T, Okura H, Imai K, Yamada R, Obase K, Saito K, Hayashida A, Neishi Y, Kawamoto T, Yoshida K. Usefulness of CHADS2 score to predict C-reactive protein, left atrial blood stasis, and prognosis in patients with nonrheumatic atrial fibrillation. American Journal of Cardiology 2010. 106 535–538. ( 10.1016/j.amjcard.2010.03.067) [DOI] [PubMed] [Google Scholar]
- 45.Abu-Mahfouz M, Cavalcante JL, Arida M, Garcia J, Al-Mallah M, Boguszewski A, Haque S, Rehman M, Al Badarin F, Akhras E, et al. Significance of high sensitivity C-reactive protein and D-dimer in evaluating intracardiac thrombus and spontaneous echo contrast in patients referred for transesophageal echocardiography: a prospective study. Cardiology Journal 2012. 19 267–273. ( 10.5603/CJ.2012.0048) [DOI] [PubMed] [Google Scholar]
- 46.Heppell RM, Berkin KE, McLenachan JM, Davies JA. Haemostatic and haemodynamic abnormalities associated with left atrial thrombosis in non-rheumatic atrial fibrillation. Heart 1997. 77 407–411. ( 10.1136/hrt.77.5.407) [DOI] [PMC free article] [PubMed] [Google Scholar]
- 47.Wan H, Wu S, Yang Y, Zhu J, Zhang A, Liang Y. Plasma fibrin D-dimer and the risk of left atrial thrombus: a systematic review and meta-analysis. PLoS ONE 2017. 12 e0172272 ( 10.1371/journal.pone.0172272) [DOI] [PMC free article] [PubMed] [Google Scholar]
- 48.Yashiro Y, Arimoto T, Hashimoto N, Tamura H, Iwayama T, Ishigaki D, Kumagai Y, Nishiyama S, Takahashi H, Shishido T, et al. Predictors of left atrial coagulation activity among paroxysmal atrial fibrillation patients. Circulation Journal 2015. 79 61–69. ( 10.1253/circj.CJ-14-0630) [DOI] [PubMed] [Google Scholar]
- 49.Motoki H, Tomita T, Aizawa K, Kasai H, Izawa A, Kumazaki S, Tsutsui H, Koyama J, Ikeda U. Coagulation activity is increased in the left atria of patients with paroxysmal atrial fibrillation during the non-paroxysmal period. Comparison with chronic atrial fibrillation. Circulation Journal 2009. 73 1403–1407. ( 10.1253/circj.CJ-09-0008) [DOI] [PubMed] [Google Scholar]
Associated Data
This section collects any data citations, data availability statements, or supplementary materials included in this article.
Supplementary Materials
Transesophageal echocardiographic image of SEC grade 1 (mild): note that minimal echogenicity can be seen within the left atrial appendage. View Video 1 at http://movie-usa.glencoesoftware.com/video/10.1530/ERP-18-0083/video-1.
Download Video 1 (1.3MB, mpg)
Transesophageal echocardiographic image of SEC grade 2 (mild to moderate): see main text and Table 1 for details. View Video 2 at http://movie-usa.glencoesoftware.com/video/10.1530/ERP-18-0083/video-2.
Download Video 2 (1.5MB, mpg)
Transesophageal echocardiographic image of SEC grade 3 (moderate): see main text and Table 1 for details. View Video 3 at http://movie-usa.glencoesoftware.com/video/10.1530/ERP-18-0083/video-3.
Download Video 3 (880KB, mpg)
Transesophageal echocardiographic image of SEC grade 4 (severe): note that the swirling pattern is remarkable and slowly moving compared with SEC grade 3+, and that sludge is perceptible within the appendage. View Video 4 at http://movie-usa.glencoesoftware.com/video/10.1530/ERP-18-0083/video-4.
Download Video 4 (1.8MB, mpg)
2D echocardiographic image of the apical long-axis view from a patient with mitral stenosis before percutaneous transluminal mitral commissurotomy (PTMC): note that SEC can be seen within the left atrium (LA). View Video 5 at http://movie-usa.glencoesoftware.com/video/10.1530/ERP-18-0083/video-5.
Download Video 5 (1.1MB, mpg)
2D echocardiographic image of the apical long-axis view from a patient with mitral stenosis after percutaneous transluminal mitral commissurotomy (PTMC): note that with mitral valve opening improved, SEC is not evident in the left atrium (LA). View Video 6 at http://movie-usa.glencoesoftware.com/video/10.1530/ERP-18-0083/video-6.
Download Video 6 (1.1MB, mpg)


 This work is licensed under a