Abstract
Background
In the pathogenesis and progression of prostate cancer, cell proliferation and cell migration results in tumor invasion and metastasis that is associated with patient morbidity and mortality. Rho-associated protein kinase (ROCK) has previously been shown to be upregulated in prostate cancer, but its biological role remains poorly understood. This study aimed to investigate the role of ROCK in the proliferation and migration of PC-3 and DU145 prostate cancer cells and to identify the possible targets involved by knockdown of ROCK1 and ROCK2 RNA expression.
Material/Methods
An RNA interference (RNAi) assay was performed to silence the expression of ROCK1 and ROCK2 in the PC-3 and DU145 human prostate cancer cell lines. Cells were also treated with a specific ROCK inhibitor, Y27632. A cell counting kit-8 (CCK-8) assay was used to determine the proliferation rate of prostate cancer cells, and cell migration and invasion assays were performed. Western blot and polymerase chain reaction were used to measure protein and RNA expression levels.
Results
In PC-3 and DU145 prostate cancer cells, knockdown of ROCK1 and ROCK2 reduced cell migration and invasion. ROCK1 and ROCK2 regulated cell proliferation in PC-3 and DU145 prostate cancer cells. Protein levels of phosphorylated LIM kinase 1 (p-LIMK1) and matrix metalloproteinase-2 (MMP-2) were reduced in ROCK1 and ROCK2 siRNA transfected cells.
Conclusions
In PC-3 and DU145 human prostate cancer cells, ROCK promoted cell proliferation and migration by targeting LIMK1 and MMP-2.
MeSH Keywords: Matrix Metalloproteinase 2, Prostatic Neoplasms, rho-Associated Kinases
Background
Worldwide, prostate cancer is the second most commonly diagnosed cancer in men, resulting in high morbidity and mortality [1,2]. Although there have been recent advances in the diagnosis and management of prostate cancer, in some patients, the prognosis remains poor [3]. Therefore, more effective and targeted approaches for the diagnosis and treatment of prostate cancer are still needed.
Rho-associated protein kinase (ROCK) belongs to the highly conserved serine/threonine kinase family. In humans, a total of two homologs, ROCK1 and ROCK2, have been identified on the 18q11 and 2p24 chromosome regions, respectively. ROCK is involved in several biological processes, including cell proliferation, cell migration, and cell motility [4–6]. The findings from several previously published studies have shown that inhibition of the expression of the ROCK gene inhibits invasion of breast cancer cells in vitro [7,8]. However, the role of ROCK in the behavior of prostate cancer cells remains unknown.
LIM kinase 1 (LIMK1) is expressed in the cell cytoplasm and cell nucleus and is upregulated in several human cancers, including prostate and breast cancer [9]. The major functions of LIMK1 in cell migration and cell proliferation are mainly dependent on phosphorylation. Previous have shown that ROCK might be a regulator for the phosphorylation of LIMK1 (p-LIMK1) in some human cancers [4,10,11]. Therefore, studies to evaluate the correlation between ROCK and p-LIMK1 expression and their effects in prostate cancer cells would appear to be an important area of study.
Matrix metalloproteinase-2 (MMP-2) belongs to MMP protein family, which has a key role in the regulation of cell proliferation, migration, and differentiation [12–14]. MMPs have been considered as an attractive therapeutic target for the cancer treatment [14]. MMP-2 is a physiological regulator for vascular remodeling, and the regulation of MMP-2 can affect angiogenesis and the progression, invasion, and metastasis of cancer cells [13,15]. A previously published study has shown that MMP-2 is regulated by ROCK [16]. However, the association between MMP-2 and ROCK in prostate cancer remains to be investigated.
Therefore, this study aimed to investigate the role of ROCK in the proliferation and migration of PC-3 and DU145 prostate cancer cells and to identify the possible targets involved by knockdown of ROCK1 and ROCK2 expression.
Material and Methods
Cell culture
Human prostate adenocarcinoma cell lines, DU145 and PC-3 were obtained from the Cell Bank of the Shanghai Biology Institute, Shanghai, China. All culture media were mixed with 10% fetal bovine serum (FBS) (Gibco, Thermofisher Scientific, Waltham, MA, USA), 2 mM L-glutamine and 1% penicillin and streptomycin (Solarbio, Beijing, China). DU145 and PC-3 cells were cultured in Dulbecco’s modified Eagle’s medium (DMEM) (Sigma-Aldrich, St. Louis MO, USA). Cell lines were maintained at 37°C in an atmosphere containing 5% CO2.
Quantitative reverse transcription polymerase chain reaction (qRT-PCR)
Total RNA was isolated from prostate cancer cell samples using TRIzol reagent (Invitrogen, Carlsbad, CA, USA) and reverse transcribed using a cDNA synthesis kit (Fermentas, Burlington, ON, Canada), according to the manufacturer’s instructions. A quantitative reverse transcription polymerase chain reaction (qRT-PCR) was performed with SYBR® Green real-time PCR Master Mix (Thermofisher Scientific, Waltham, MA, USA) on an ABI 7300 ABI 7300 Real-Time PCR System (Applied Biosystems, Foster City, CA, USA) using the following cycling parameters, 95°C for 10 min, followed by 40 cycles of 95°C for 15 s, 60°C for 45s, and normalized to GAPDH. The relative gene relative expression was calculated by the 2−ΔΔCt method. All data represented the average of three replicates. The primer sequences used were as follows:
The homo sapiens rho-associated coiled-coil containing protein kinase 1 (ROCK1), mRNA NM_005406.2:
Forward: 5′ CCCAAGGAGATGTGTATAG 3′;
Reverse: 5′ GGAAAGTGGTAGAGTGTAG 3′;
Positive: 4480–4657 C;
Amplified product size: 178 bps;
Product GC: 35%.
The homo sapiens rho-associated coiled-coil containing protein kinase 2 (ROCK2), transcript variant 2, mRNA NM_001321643.1:
Forward: 5′ TGATTGGTGGTCTGTAGG 3′;
Reverse; 5′ GCTGCCGTTTCTCTTATG 3′;
Positive: 818–1099 C;
Amplified product size: 282 bps;
Product GC: 40%.
The homo sapiens glyceraldehyde-3-phosphate dehydrogenase (GAPDH), transcript variant 2, mRNA NM_001256799.2:
Forward: 5′ AATCCCATCACCATCTTC 3′;
Reverse: 5′ AGGCTGTTGTCATACTTC 3′;
Positive: 436–653 C;
Amplified product size: 218 bps;
Product GC: 56%.
RNA interference (RNAi)
Two short interfering RNA (siRNA) targeting positions of human ROCK1 (NM_005406.2) and ROCK2 (NM_001321643.1) were synthesized. A non-specific scramble siRNA sequence was used as a negative control (NC). All of the siRNAs were transiently transfected into DU145 or PC-3 cells using Lipofectamine 2000 (Invitrogen, Carlsbad, CA, USA), according to the manufacturer’s instructions. Assays were performed 48 h after transfection. Sequence information for the ROCK siRNAs is shown in Table 1.
Table 1.
Homo sapiens ROCK1 and ROCK2 RNAi targeting locus information.
| RNAi targeting locus | Sequence | ||
|---|---|---|---|
| Name | Locus position (bp) | ||
| ROCK1 | RNAi1-1 | 1410–1428 | CCTGGTGGAGATCTTGTAA |
| RNAi1-2 | 1998–2016 | GCACCAGTTGTACCCGATT | |
| RNAi1-3 | 3476–3494 | GCTTGAAGCTGAGCAATAT | |
| ROCK2 | RNAi2-1 | 2273–2291 | GCTGGAGACTGCCAAGTTA |
| RNAi2-2 | 3224–3242 | GCAACTGGCTCGTTCAATT | |
| RNAi2-3 | 3452–3470 | GCAACTGTCAAGATTGAAA | |
Western blot
Whole protein lysates were extracted from indicated cells using RIPA lysis buffer (JRDUN, Shanghai, China) with an EDTA-free protease inhibitor cocktail (Roche, Mannheim, Germany). The protein concentration was estimated using an enhanced BCA protein assay kit (Thermofisher Scientific, Waltham, MA, USA). Equal amounts of total protein (25 μg) were fractionated using 10% sodium dodecyl sulfate-polyacrylamide gel electrophoresis (SDS-PAGE) and transferred to a nitrocellulose membrane overnight (Millipore, Burlington, MA, USA). After blocking with 5% dried skimmed milk powder for 1 h at room temperature, the membranes were incubated at 4°C overnight with the primary antibodies, followed by secondary anti-mouse IgG (1: 1000) (Beyotime, Shanghai, China) for 1 h at 37°C. The enhanced chemiluminescence (ECL) system (Tanon, Shanghai, China) was used the detect the protein expression levels. The names, source, and dilutions of the primary antibodies used are shown in Table 2.
Table 2.
The primary antibodies used in Western blot.
| Antibody name | Source | Dilution |
|---|---|---|
| ROCK1 | Abcam, Cambridge, UK | 1: 2000 |
| ROCK2 | Abcam, Cambridge, UK | 1: 1000 |
| LIMK1 | Abcam, Cambridge, UK | 1: 1000 |
| p-LIMK1 | Abcam, Cambridge, UK | 1: 500 |
| MMP-2 | Abcam, Cambridge, UK | 1: 1000 |
| GAPDH | CST, Danvers, MA, USA | 1: 2000 |
Cell proliferation assay
Cell counting kit-8 (CCK-8) assay kits (Sigma-Aldrich, St. Louis MO, USA) were used to examine the cell proliferation rate, according to manufacturer’s protocol. Briefly, cells transfected with siROCK were seeded in 96-well plates and cultured for 0, 24, 48, and 72h. CCK-8 solution (10 μl in 100 μl DMEM medium) was added to each well and incubated for 1 h. Optical density (OD) values at a wavelength of 450 nm were measured using a microplate reader (Pulangxin, Beijing, China). All experiments were performed in triplicate at each time point.
Cell migration assay
Each ROCK siRNA cell group was serum starved for 24 h followed by seeding in the upper chamber, while the medium was supplemented with 30% FBS (Gibco, ThermoFisher Scientific, Waltham, MA, USA), which was placed in the lower chamber. After 24 h of incubation, cells in the upper side of the filters were removed and the remaining cells were fixed in 4% formaldehyde and stained with 0.01% crystal violet (Solarbio, Beijing, China). Cells in the lower chamber were stained with crystal violet and counted under the light microscope, at a magnification of ×200. All the procedures were performed using Boyden chambers (Costar Technologies, Inc., China), according to the method previously described [17]. Cell migration was evaluated using Boyden chambers that contained a polycarbonate filter coated with Matrigel on the upper surface. Cell migration was viewed by light microscopy following cell staining with crystal violet.
Murine in vivo model of pulmonary metastasis
The animal study was performed following the Guidelines for the Animal Care and Use, Shanghai Eastern Hospital, China. PC-3 cells transfected with the ROCK siRNAs, or treated with the ROCK inhibitor, Y27632 (2×10⁶) were injected into the lateral tail vein of nude mice, at 4-weeks-of-age (n=16). Mouse survival was monitored daily. After four weeks, four mice in each group were sacrificed and portions of the lungs were processed for histology and light microscopy using hematoxylin and eosin (H&E) staining. The lung tissue sections were reviewed at a magnification of ×200.
Statistical analysis
GraphPad Prism software, version 6.0 (GraphPad Software, La Jolla, CA, USA) was used for statistical analysis. Data were shown as the mean ± standard deviation (SD). One-way analysis of variance (ANOVA) was used for multiple comparisons. A p-value <0.05 indicated statistical significance.
Results
Knockdown of the rho-associated protein kinase (ROCK) gene in PC-3 and DU145 prostate cancer cells
Three siRNAs targeting human ROCK1 or ROCK2 (siROCK1: RNAi1-1, RNAi1-2, RNAi1-3; siROCK2: RNAi2-1, RNAi2-2, RNAi2-3) and a non-specific scramble siRNA (siNC) were synthesized and transfected into PC-3 and DU145 cell lines. Untreated cells served as a control.
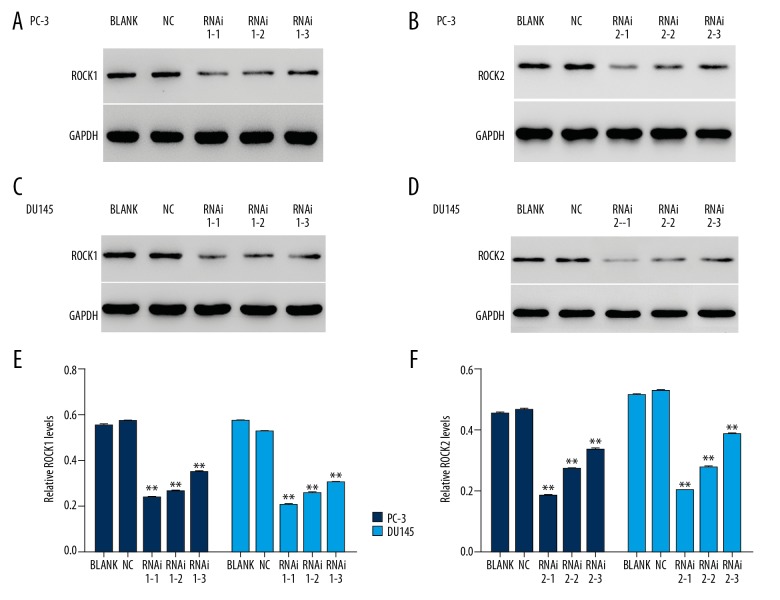
As shown in Figures 1 and 2, both the mRNA and protein of ROCK were efficiently suppressed by ROCK siRNAs. Also, cells transfected with RNAi1-1 and RNAi2-1 had a greater effect than that of other siROCKs in two cell lines. Therefore, RNAi1-1 and RNAi2-1 transfected cells were chosen for further studies. All transfected ROCK siRNAs showed highly specific characteristic for silencing ROCK (Figure 3).
Figure 1.
The mRNA expression of ROCK1 and ROCK2 were inhibited by ROCK short-interfering RNAs (siRNAs) in prostate cancer cells, PC-3 and DU145. (A) ROCK1 siRNA mRNA expression levels in prostate cancer cells. (B) ROCK2 siRNA mRNA expression levels in prostate cancer cells. ** P<0.01.
Figure 2.
The protein levels of ROCK1 and ROCK2 were inhibited by ROCK short-interfering RNAs (siRNAs) in prostate cancer cells, PC-3 and DU145. (A, C, E) The protein levels of ROCK1 were inhibited in siROCK1 (RNAi1-1, RNAi1-2, and RNAi1-3) transfected cells. (B, D, F) The protein levels of ROCK2 were inhibited in siROCK2 (RNAi2-1, RNAi2-2, and RNAi2-3) transfected cells. ** P<0.01 vs. normal control (NC).
Figure 3.
ROCK siRNAs showed highly specific characteristic for silencing ROCKs in prostate cancer cells, PC-3 and DU145. (A, B) The mRNA and protein level of ROCK1 in different siROCK2 transfected cells. (C, D) The mRNA and protein level of ROCK2 in different siROCK1 transfected cells.
Knockdown of ROCK inhibited the proliferation of PC-3 and DU145 prostate cancer cells
The cell counting kit-8 (CCK-8) assay was performed to examine the proliferation rate of siNC, siROCK1, siROCK2, and siROCK1 and siROCK2 transfected cells. Cells were cultured with a specific ROCK inhibitor, Y27632 (10 μM), and served as positive control (PC).
As shown in Figure 4, the cell proliferation rate of the siROCK transfected cells was significantly decreased when compared with siNC transfected cells. The combined siROCK1 and siROCK2 transfected cells had a lower proliferation rates when compared with the siROCK1 or siROCK2 transfected cells alone, which showed no significant difference with the control cells. These results supported an anti-proliferation effect of ROCK siRNAs on prostate cancer cells in vitro.
Figure 4.
(A–D) Knockdown of ROCK gene expression reduced the proliferation rate of prostate cancer cells, PC-3 and DU145. (A) The proliferation rate was detected at 12, 24, 48, and 72 hours after the PC-3 cells were transfected with siNC, siROCK1, siROCK2, siROCK1 and iROCK2, and treated with the ROCK inhibitor, Y27632, respectively. (B) The proliferation rate was detected 12, 24, 48, and 72 hours after the DU145 cells were transfected with siNC, siROCK1, siROCK2, siROCK1 and siROCK2, and treated with the ROCK inhibitor, Y27632, respectively. * P<0.05 vs. siNC, ** P<0.01 vs. siNC, # P<0.05 vs. siROCK1, ## P<0.01 vs. the siROCK1 group, && P<0.01 vs. the siROCK2 group.
Silencing of ROCK suppressed cell migration and invasion of PC-3 and DU145 prostate cancer cells
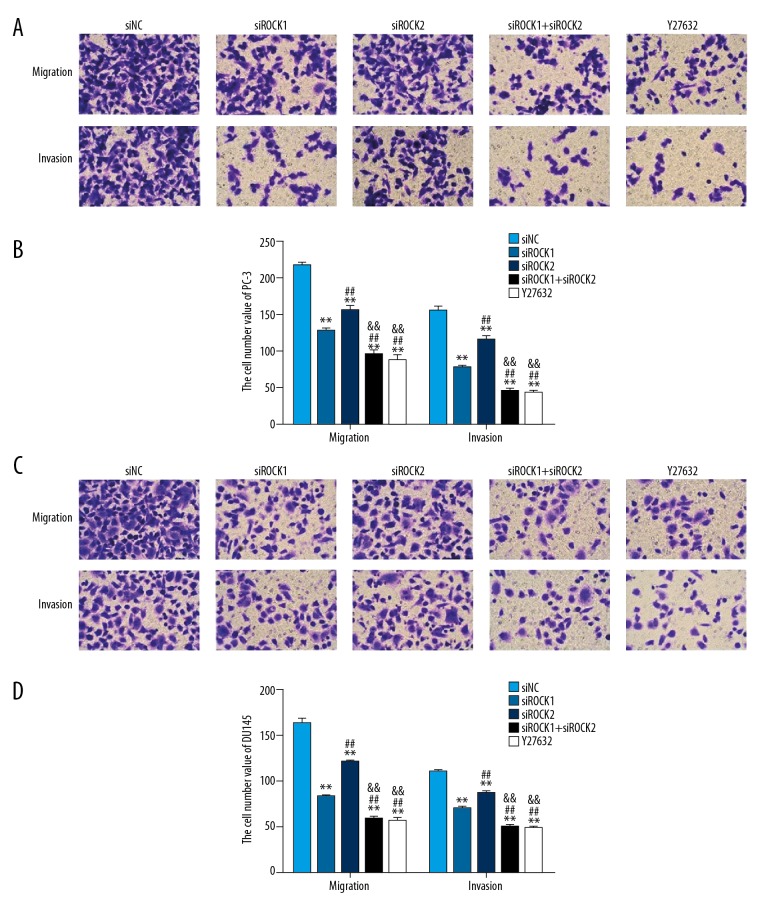
Figure 5 shows that the rate of cell migration and invasion was significantly reduced in siROCK transfected cells compared with the siNC transfected cells. Also, the migration and invasion rate of the combined siROCK1 and siROCK2 transfected cells was reduced when compared with the siROCK1 or siROCK2 transfected cells alone. These results supported the role of ROCK in promoting the invasive properties of prostate cancer cells in vitro.
Figure 5.
Silencing the ROCK gene inhibited the motility and migration of prostate cancer cells, PC-3 and DU145. (A, B) Cell migration and invasion rate was analyzed in PC-3 cells that were transfected with siNC, siROCK1, siROCK2, siROCK1 and siROCK2 and treated with the ROCK inhibitor, Y27632, respectively. (C, D) Cell migration and invasion rate was analyzed in DU145 cells that were transfected with siNC, siROCK1, siROCK2, siROCK1 and siROCK2, and treated with the ROCK inhibitor, Y27632, respectively. Magnification ×200. * P<0: 05 vs. siNC, ** P<0.01 vs. siNC, # P<0.05 vs. siROCK1, ## P<0.01 vs. siROCK1, && P<0.01 vs. siROCK2.
Knockdown of ROCK reduced the expression of p-LIMK1 and MMP-2
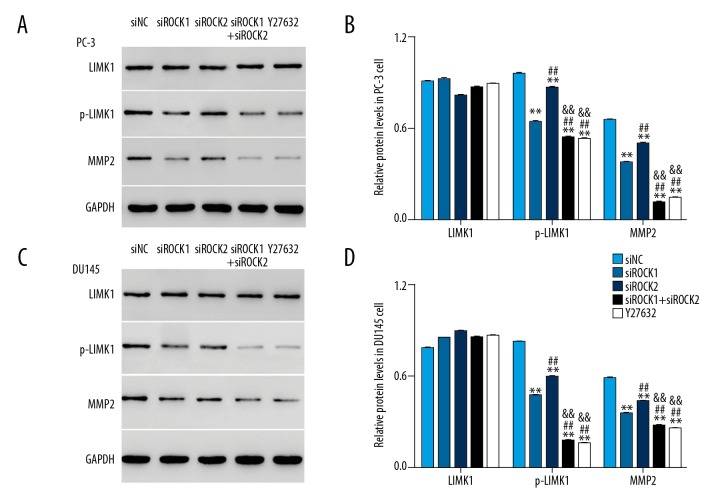
Western blot was used to examine the protein level of LIMK1, p-LIMK1, and MMP-2 in siROCK transfected cells. As shown in Figure 6, the protein level of LIMK1 showed no significant difference among all transfected cells. Protein expression levels of p-LIMK1 and MMP-2 were significantly reduced in ROCK siRNAs transfected cells, particularly in the combined siROCK1 and siROCK2 transfected cells. These results supported the role of ROCK in targeting p-LIMK1 and MMP-2 in prostate cancer cells in vitro.
Figure 6.
The protein levels of phospho-LIM kinase 1 (p-LIMK1) and matrix metalloproteinase-2 (MMP-2) were decreased in ROCK siRNA PC-3 and DU145 transfected cells. (A, B) The protein levels of LIMK1, p-LIMK1, and MMP-2 detected in PC-3 cells that were transfected with siNC, siROCK1, siROCK2, siROCK1 and iROCK2, and cells treated with the ROCK inhibitor, Y27632, respectively. (C, D) The protein levels of LIMK1, p-LIMK1, and MMP-2 detected in DU145 cells transfected with siNC, siROCK1, siROCK2, siROCK1 and siROCK2, and cells treated with the ROCK inhibitor, Y27632, respectively. * P<0.05 vs. siNC, ** P<0.01 vs. siNC, # P<0.05 vs. siROCK1, ## P<0.01 vs. siROCK1, && P<0.01 vs. siROCK2.
Knockdown of ROCK reduced pulmonary metastasis in vivo in nude mice
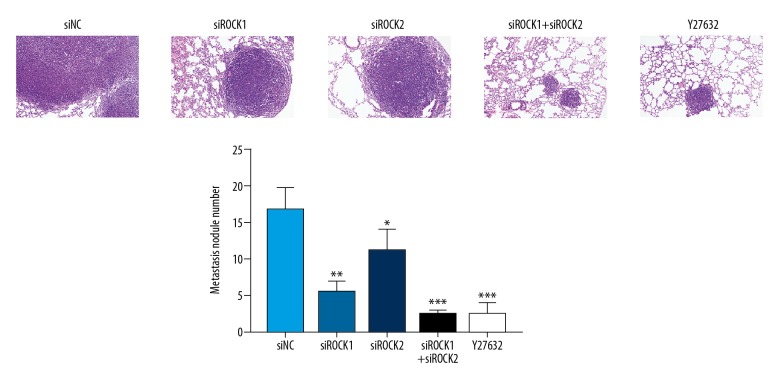
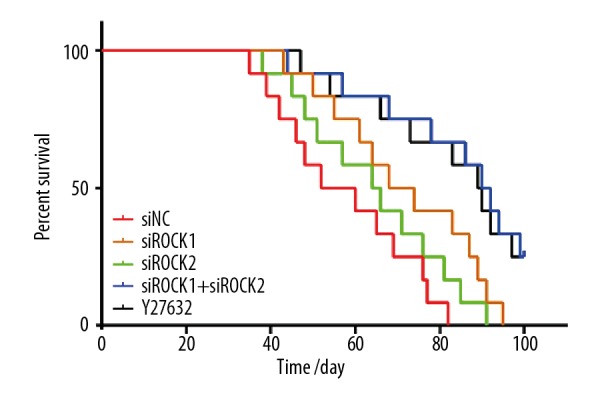
To investigate whether ROCK siRNAs influenced metastasis of prostate cancer cells in vivo, PC-3 and DU145 prostate cancer cells transfected with siROCK were injected into the lateral tail vein of nude mice. As shown in Figure 7, knockdown of ROCK reduced the number of metastatic lung tumor nodules in mice, particularly in the combined siROCK1 and siROCK2 group. ROCK siRNA transfected cells were associated with a reduced number of lung metastases in mice, and inoculation with the combined siROCK1 and siROCK2 transfected cells was associated with increased survival (Figure 8).
Figure 7.
Knockdown of ROCK gene expression inhibited pulmonary metastasis in an in vivo mouse model. PC-3 cells (2×10⁶) transfected with the ROCK siRNA were injected into the lateral tail vein of 4-week-old nude mice. At day 35, the mice were sacrificed and portions of the lungs were processed for histology. Hematoxylin and eosin (H&E) staining. Magnification, ×200.
Figure 8.
ROCK siRNAs showed highly specific characteristic for silencing ROCKs in PCa cells. A and B stands for the mRNA and protein level of ROCK1 in different siROCK2 transfected cells. C and D stands for the mRNA and protein level of ROCK2 in different siROCK1 transfected cells.
Discussion
The rho-associated protein kinase (ROCK) signaling pathway is required for the regulation of cell morphology, adhesion, and motility [7]. The findings from a previously published study showed that ROCK had a key role in the regulation of the actin cytoskeleton, and the expression level of ROCK was associated with cancer progression [18]. In the present study, the role of ROCK in human PC-3 and DU145 prostate cancer cells was studied in vitro. The RNA interference (RNAi) assay was performed to silence the expression of ROCK1 and ROCK2 and a specific ROCK inhibitor, Y27632, was used to inhibit the expression of ROCK. The concordant findings from these two approaches that inhibited ROCK expression supported the validity of the results.
Previous studies have shown that ROCK expression was associated with cell proliferation [19,20]. The findings of the present study supported the findings of these previous studies and also showed that the combined effects of the short-interfering RNAS, siROCK1and siROCK2 had a greater effect on prostate cancer cells when compared with the findings from siROCK1 or siROCK2 treatment alone. Therefore, the results of the present study supported the effect of ROCK in the regulation of cell proliferation on prostate cancer cells.
Worldwide, cancer is a major public health concern with increased morbidity and mortality from all cancers, including prostate cancer [18,21]. The properties of tumor cell invasion and metastasis are important factors that determine cancer progression [22,23]. Therefore, the inhibition of tumor cell invasion and metastasis might be a promising approach for cancer treatment. Previous reports have shown that ROCK was associated with the progression of cancer and its expression was increased in several types of cancer [7,24]. In the present study, knockdown of expression of ROCK reduced the migration and invasion of human prostate cancer cells, PC-3 and DU145 in vitro, and promoted metastasis in a mouse model in vivo.
It has previously been reported that the suppression of the expression of LIM kinase 1 (LIMK1) inhibited the invasion and proliferation of gastric cancer cells [25]. Phosphorylate LIMK1 (p-LIMK1) is the biologically active form of LIMK1 [25,26]. ROCK is reported to be a mediator in the phosphorylation of LIMK1 [27]. The findings of the present study showed that the protein level of p-LIMK1 was significantly inhibited in siROCK transfected PC-3 and DU145 human prostate cancer cells. Therefore, ROCK might regulate the metastasis of prostate cancer cells through the regulation of p-LIMK1.
Matrix metalloproteinase-2 (MMP-2) is a member of the MMPs gelatinase family with increased expression associated with tumor cell invasion due to its effects on degrading the extracellular matrix (ECM), accelerating tumor growth, and promoting tumor angiogenesis [28]. In the present study, the expression levels of MMP-2 were significantly decreased in prostate cancer cells transfected with ROCK siRNAs, especially for combined siROCK1 and siROCK2 transfected cells. These findings were supported by the findings from previous studies [29,30]. Therefore, MMP-2 might be the novel component in the ROCK/LIMK1 signaling pathway in prostate cancer cells and requires further study to investigate the roles of MMP-2 and LIMK1 in prostate cancer in vivo.
Conclusions
The findings of this preliminary study showed that in PC-3 and DU145 human prostate cancer cells, the expression of rho-associated protein kinase (ROCK) promoted cell proliferation and migration by targeting phosphorylated LIM kinase 1 (p-LIMK1) and matrix metalloproteinase-2 (MMP-2). Further in vitro and in vivo studies are warranted to determine the roles of ROCK, LIMK1, and MMP-2 in human prostate cancer to identify potential diagnostic and therapeutic targets.
Footnotes
Source of support: This study was supported by the key scientific research project of Shanghai Municipal Commission of Health and Family Planning (No. 201640014) and the project of the Natural Science Foundation of Jiangxi (No. 20171BAB205019)
References
- 1.Lefort K, Ostano GP, Farsetti A, et al. Dual tumor suppressing and promoting function of Notch1 signaling in human prostate cancer. Oncotarget. 2016;7(30):48011–26. doi: 10.18632/oncotarget.10333. [DOI] [PMC free article] [PubMed] [Google Scholar]
- 2.Lo JCY, Clark AK, Taylor RA, et al. Obesity does not promote tumorigenesis of localized patientderived prostate cancer xenografts. Oncotarget. 2016;7(30):47650–62. doi: 10.18632/oncotarget.10258. [DOI] [PMC free article] [PubMed] [Google Scholar]
- 3.Culig Z, Santer FR. Androgen receptor signaling in prostate cancer. Cancer Metast Rev. 2014;33(2–3):413–27. doi: 10.1007/s10555-013-9474-0. [DOI] [PubMed] [Google Scholar]
- 4.Amin E, Dubey BN, Zhang SC, et al. Rho-kinase: regulation, (dys)function, and inhibition. Biol Chem. 2013;394(11):1399–410. doi: 10.1515/hsz-2013-0181. [DOI] [PMC free article] [PubMed] [Google Scholar]
- 5.Chen W, Mao K, Liu Z, et al. The role of the RhoA/Rho kinase pathway in angiogenesis and its potential value in prostate cancer (Review) Oncol Lett. 2014;8(5):1907–11. doi: 10.3892/ol.2014.2471. [DOI] [PMC free article] [PubMed] [Google Scholar]
- 6.Chen W, Mao K, Hua-Huy T, et al. Fasudil inhibits prostate cancer-induced angiogenesis in vitro. Oncol Rep. 2014;32(6):2795–802. doi: 10.3892/or.2014.3491. [DOI] [PubMed] [Google Scholar]
- 7.Liu S, Goldstein RH, Scepansky EM, Rosenblatt M. Inhibition of rho-associated kinase signaling prevents breast cancer metastasis to human bone. Cancer Res. 2009;69(22):8742–51. doi: 10.1158/0008-5472.CAN-09-1541. [DOI] [PubMed] [Google Scholar]
- 8.Ying H, Biroc SL, Li WW, et al. The Rho kinase inhibitor fasudil inhibits tumor progression in human and rat tumor models. Mol Cancer Ther. 2006;5(9):2158–64. doi: 10.1158/1535-7163.MCT-05-0440. [DOI] [PubMed] [Google Scholar]
- 9.McConnell BV, Koto K, Gutierrez-Hartmann A. Nuclear and cytoplasmic LIMK1 enhances human breast cancer progression. Mol Cancer. 2011;10:75. doi: 10.1186/1476-4598-10-75. [DOI] [PMC free article] [PubMed] [Google Scholar]
- 10.Matsubara M, Bissell1 MJ. Inhibitors of Rho kinase (ROCK) signaling revert the malignant phenotype of breast cancer cells in 3D context. Oncotarget. 2016;7(22):31602–22. doi: 10.18632/oncotarget.9395. [DOI] [PMC free article] [PubMed] [Google Scholar]
- 11.Schofield AV, Bernard O. Rho-associated coiled-coil kinase (ROCK) signaling and disease. Crit Rev Biochem Mol Biol. 2013;48(4):301–16. doi: 10.3109/10409238.2013.786671. [DOI] [PubMed] [Google Scholar]
- 12.Rempe RG, Hartz AM, Bauer B. Matrix metalloproteinases in the brain and blood-brain barrier: Versatile breakers and makers. J Cereb Blood Flow Metab. 2016;36(9):1481–507. doi: 10.1177/0271678X16655551. [DOI] [PMC free article] [PubMed] [Google Scholar]
- 13.Cui N, Hu M, Khalil RA. Biochemical and biological attributes of matrix metalloproteinases. Prog Mol Biol Transl Sci. 2017;147:1–73. doi: 10.1016/bs.pmbts.2017.02.005. [DOI] [PMC free article] [PubMed] [Google Scholar]
- 14.Tokito A, Jougasaki M. Matrix metalloproteinases in non-neoplastic disorders. Int J Mol Sci. 2016;17(7) doi: 10.3390/ijms17071178. pii: E1178. [DOI] [PMC free article] [PubMed] [Google Scholar]
- 15.Hecht E, Freise C, Websky KV, et al. The matrix metalloproteinases 2 and 9 initiate uraemic vascular calcifications. Nephrol Dial Transplant. 2016;31(5):789–97. doi: 10.1093/ndt/gfv321. [DOI] [PubMed] [Google Scholar]
- 16.Cui Y, Sun YW, Lin HS, et al. Platelet-derived growth factor-BB induces matrix metalloproteinase-2 expression and rat vascular smooth muscle cell migration via ROCK and ERK/p38 MAPK pathways. Mol Cell Biochem. 2014;393(1–2):255–63. doi: 10.1007/s11010-014-2068-5. [DOI] [PubMed] [Google Scholar]
- 17.Chen Y, Guo Y, Yang H, et al. TRIM66 overexpresssion contributes to osteosarcoma carcinogenesis and indicates poor survival outcome. Oncotarget. 2015;6(27):23708–19. doi: 10.18632/oncotarget.4291. [DOI] [PMC free article] [PubMed] [Google Scholar]
- 18.Morgan-Fisher M, Wewer UM, Yoneda A. Regulation of ROCK activity in cancer. J Histochem Cytochem. 2013;61(3):185–98. doi: 10.1369/0022155412470834. [DOI] [PMC free article] [PubMed] [Google Scholar]
- 19.Leve F, Peres-Moreira RJ, Binato R, et al. LPA induces colon cancer cell proliferation through a cooperation between the ROCK and STAT-3 pathways. PLoS One. 2015;10(9):e0139094. doi: 10.1371/journal.pone.0139094. [DOI] [PMC free article] [PubMed] [Google Scholar]
- 20.Jing J, Chen L, Fu HY, et al. Annexin V-induced rat Leydig cell proliferation involves Ect2 via RhoA/ROCK signaling pathway. Sci Rep. 2015;5:9437. doi: 10.1038/srep09437. [DOI] [PMC free article] [PubMed] [Google Scholar]
- 21.Siegel R, Naishadham D, Jemal A. Cancer statistics, 2012. Cancer J Clin. 2012;62(1):10–29. doi: 10.3322/caac.20138. [DOI] [PubMed] [Google Scholar]
- 22.Hanahan D, Weinberg RA. Hallmarks of cancer: The next generation. Cell. 2011;144(5):646–74. doi: 10.1016/j.cell.2011.02.013. [DOI] [PubMed] [Google Scholar]
- 23.Munkley J, McClurg UL, Livermore KE, et al. The cancer-associated cell migration protein TSPAN1 is under control of androgens and its upregulation increases prostate cancer cell migration. Sci Rep. 2017;7(1):5249. doi: 10.1038/s41598-017-05489-5. [DOI] [PMC free article] [PubMed] [Google Scholar]
- 24.Fujita Y, Yamashita T. Axon growth inhibition by RhoA/ROCK in the central nervous system. Front Neurosci. 2014;8:338. doi: 10.3389/fnins.2014.00338. [DOI] [PMC free article] [PubMed] [Google Scholar]
- 25.Su B, Su1 J, Zhou G, et al. Diallyl disulfide suppresses epithelial-mesenchymal transition, invasion and proliferation by downregulation of LIMK1 in gastric cancer. Oncotarget. 2015;7(9):10498–512. doi: 10.18632/oncotarget.7252. [DOI] [PMC free article] [PubMed] [Google Scholar]
- 26.Arber S, Barbayannis FA, Hanser H, et al. Regulationof actin dynamics through phosphorylation of cofilin by LIM-kinase. Nature. 1998;393(6687):805–9. doi: 10.1038/31729. [DOI] [PubMed] [Google Scholar]
- 27.Ohashi K, Nagata K, Maekawa M, et al. Rho-associated Kinase ROCK Activates LIM-kinase 1 by Phosphorylation at Threonine 508 within the Activation Loo. J Biol Chem. 1999;275:3577–82. doi: 10.1074/jbc.275.5.3577. [DOI] [PubMed] [Google Scholar]
- 28.Yu CF, Chen FH, Lu MH, et al. Dual roles of tumour cells-derived matrix metalloproteinase 2 on brain tumour growth and invasion. Br J Cancer. 2017;117(12):1828–36. doi: 10.1038/bjc.2017.362. [DOI] [PMC free article] [PubMed] [Google Scholar]
- 29.Zhang J, Wang P, Yan Y, et al. IL33 enhances glioma cell migration and invasion by upregulation of MMP-2 and MMP-9 via the ST2NFκB pathway. Oncol Rep. 2017;38:2033–42. doi: 10.3892/or.2017.5926. [DOI] [PMC free article] [PubMed] [Google Scholar]
- 30.Caraballo-Miralles V, Cardona-Rossinyol A, Garcera A, et al. SMN deficiency attenuates migration of U87MG astroglioma cells through the activation of RhoA. Mol Cell Neurosci. 2012;49(3):282–89. doi: 10.1016/j.mcn.2011.12.003. [DOI] [PubMed] [Google Scholar]


