Abstract
Phenotyping immune cells and cell clusters in situ, including their activation state and function, can aid in interpretation of spatial relationships within the tissue microenvironment. Immune cell phenotypes require multiple biomarkers. However, conventional microscopy setups can only image up to four biomarkers at one time. In this report, we describe and give an example of a workflow to phenotype, quantitate, and visualize greater than four biomarkers in silico utilizing multiplexed fluorescence histology and the TissueFAXS quantitative imaging system with a conventional microscopy setup. Biomarkers were conjugated to Cy3 or Cy5. Multiplexed staining was performed on formalin-fixed paraffin-embedded tissue sections. We imaged the slides, inactivated the dyes, and repeated the process until all biomarkers were stained. Phenotype profiles were built based on in silico combinations of the biomarkers. We used algorithms that aligned all images to create a composite image, isolated each cell in the image, and identified biomarker positive cells in the image. The in silico phenotypes were quantitated and displayed through flow cytometry-like histograms and dot scatterplots in addition to backgating into the tissue images. The advantage of our workflow is that it provides visual verification of cell isolation and identification as well as highlight characteristics of cells and cell clusters.
Keywords: immune cells, cell clusters, quantitative imaging, multiplexed histology, tissue cytometry, TissueFAXS, in silico analysis, FFPE
INTRODUCTION
In clinical practice, histological analysis of immune cells in solid tissue is now required for diagnosis, therapeutic selection, and therapeutic monitoring of many diseases including cancer. With the advent of immunotherapy, there is a need for the histological analysis to be quantitative. Over the last decade, there have been several quantitative imaging systems developed to assess the microenvironment of solid tissues as all-in-one platforms for imaging and analysis (1). Systems that have similar capabilities and functionality to flow cytometry are desired for enumeration of cell populations. An important outcome of the development of the more recent quantitative imaging hardware and software for histology tissue is the ability to capture phenotype profiles of single cells in situ.
Phenotype profiles can be any observable physical properties that include appearance, development, behavior, and other characteristics such as gene and protein expression. In situ phenotype profiles of immune cells can highlight their activation state and function within the tissue microenvironment. This in situ information provides clues as to the spatial relationships and the role of these cells in the tissue microenvironment. The more we learn about immune cells, the more complex their characterization becomes since each type has been shown to have multiple subtypes. Therefore, phenotype profiles for characterization of immune cells often requires greater than four biomarkers per cell type. There are emerging microscopy systems, such as mass spectrometry imagers currently owned by a limited number of laboratories worldwide, that can image potentially up to 100 biomarkers simultaneously (2–4). However, the conventional microscopy setup, which most laboratories have access to, can only image up to four biomarkers at one time in situ.
In this report we describe a workflow and provide an example of how to phenotype, quantitate, and visualize cells and cell clusters with greater than four biomarkers in silico utilizing multiplexed fluorescence histology and the TissueFAXS imaging system with a conventional microscopy setup. To demonstrate the utility of in silico image analysis, we focused on the transmembrane protein, CD4, which is notorious for being a key biomarker for at least 6 distinct T cell subtypes (Th1, Th2, Th9, Th17, Tfh, and Treg) (5). Although not an exhaustive list, some common biomarkers of cell activity that are associated with the CD4 T cell subtypes are proliferation (e.g. Ki-67), cytokines (e.g. IL-6), proteases (e.g. Granzyme B (cytotoxicity)), and transcription factors (e.g. T-bet (Th1), RORγ(t) (Th17), Foxp3 (Treg)) (5,6). We show how cell phenotyping and cell clusters highlight the associations of these biomarkers with splenic CD4 cells from a mouse model of melanoma.
MATERIALS AND METHODS
Mice
YUMM1.7 (Yale University Mouse Melanoma Cell Line 1.7) cancer cells containing oncogenic alleles BrafV600E, Pten−/−, and Cdkn2a−/− were subcutaneously injected into the rear flank of C57BL/6J mice (4 – 6 weeks old; Jackson Laboratory, Bar Harbor, ME, USA) using a 27-gauge needle (7). Tumors were allowed to grow for at least 30 days post implantation. Spleens from these animals were resected, formalin-fixed, and paraffin-embedded. All animal experiments were carried out in accordance with the Yale Office of Animal Research Support Committee guidelines.
Reagents
Cy3 and Cy5 NHS ester conjugation kits were obtained from GE Healthcare (Pittsburg, PA, USA). DAPI, CD4 (clone 4SM95), Foxp3 (clone FJK-16s), and IL-6 (clone 20F3) were obtained from Thermo Fisher Scientific (Grand Island, NY USA). Ki-67 (clone SP6) and Granzyme B (rabbit polyclonal) were obtained from Abcam (Cambridge, MA, USA). T-bet (clone H-210X) was obtained from Santa Cruz Biotechnology (Dallas, Texas, USA). RORγ(t) (clone REA278) was obtained from Miltenyi Biotech (Auburn, CA, USA). Vectashield antifade mounting medium was obtained from Vector Laboratories (Burlingame, CA, USA).
Multiplexed Fluorochrome-Based Histology
Slides of formalin-fixed paraffin-embedded (FFPE) tissues (5 µm sections) were deparaffinized in xylene and rehydrated in decreasing concentrations of ethanol ending in deionized water. Heat-induced antigen retrieval in citrate buffer at pH 6.0 was performed. The tissue was blocked for non-specific antibody binding in 3% BSA for 30 minutes. Primary antibodies were directly conjugated to either Cy3 or Cy5 NHS esters according to the manufacturer’s protocol. The dilution of antibody used for tissue staining was determined empirically for each antibody. The conjugated antibodies were incubated on the tissue for up to 24 hours in PBS with 3% BSA. Slides were stained with DAPI and mounted with a coverslip and Vectashield mounting medium.
Image Acquisition
The TissueFAXS Quantitative Imaging System (TissueGnostics, Vienna, Austria) was used to acquire images from the slides. The TissueFAXS uses a standard widefield epi-fluorescence Zeiss AXIO Observer.Z1 Inverted Microscope with high efficiency fluorochrome specific DAPI, GFP, CFP, Cy3, and Cy5 shift free filter sets and a X-Cite 120Q FL Mercury Vapor Short Arc light source. Images were captured with a Hamamatsu ORCA-Flash 4.0 CMOS Camera. The entire slide (75mm × 25mm) was scanned at low magnification using a 5× objective. The low magnification scan was used to identify the location of the tissue on the slide. It also captures the stage and tissue coordinates. This allows repeated return to the same location on the slide for each imaging round. A region gate was drawn around the perimeter of the tissue which selects the entire biospecimen for acquisition in multiple sequential tiles at 20x high magnification. The high magnification image was used for all downstream analysis. The resulting images were exported as full resolution TIFF files in greyscale for each dye channel.
Dye Inactivation
Dye inactivation was performed as described by Gerdes et al (8). Briefly, after imaging the tissue, the coverslips were removed by soaking the slide in PBS. Slides were incubated in an alkaline solution (pH 10 – 12) with hydrogen peroxide for up to 30 minutes with gentle agitation at room temperature and washed in PBS (8). The slides were subsequently imaged to validate dye inactivation and/or restained with the next round of antibodies followed by imaging. This process was repeated until all antibodies were stained and imaged.
Quantitative Analysis of In Silico Multiplexed Images
Image processing and analysis was performed using StrataQuest software version 6.0.1.145 (TissueGnostics, Vienna, Austria). Image processing included reconstruction of whole images and creation of in silico multiplexed images. Image analysis included cell phenotyping and tissue cytometry. A proprietary image stitching algorithm was performed on the acquired tiled images to reconstruct the whole image. Algorithms were created to align the stitched images, generate a composite image containing all biomarkers from all staining rounds, isolate each cell in the composite image, and identify the positive cells in the composite image. Tissue cytometry and backgating into the tissue images were used for quantitation and visualization of the in silico data. The nonproprietary details are as follows:
1. Creation of In Silico Multiplexed Images.
Step 1: Aggregate images. Import all staining rounds into one StrataQuest project through the “Add Channels To All Samples” engine. Step 2. Align images. Images of DAPI, a dye that stains the nucleus of cells, were acquired at each round. One DAPI image was used as a reference in which to align all other DAPI and therefore all other channels (Cy3, Cy5) to the same position. This was accomplished through a cross-correlation engine set at a search template width and height of 1800 pixels x 1800 pixels. The proprietary cross-correlation algorithm finds common regions in an image that most resemble the reference image, determines the offset between the reference and the other images, and then shifts the positions of the other images to match the position of the reference image. Step 3. Remove relative autofluorescence. We define relative autofluorescence as positive signal for the same entities in unstained and multiple stained channels. Therefore, an additional unstained channel, CFP, was captured during all imaging rounds. This unstained channel contained positive signal for entities that were in both the Cy3 and Cy5 channels. An “Add Images Weighted” algorithm was used to remove the entities that were captured in the unstained CFP images from their corresponding Cy3 and Cy5 images. Weight values ranges for CFP were between −1.00 and −2.50. Weight value ranges for Cy3 or Cy5 were between +1.00 and +2.00. Step 4. In silico pairing of final images. Composite images were constructed by overlaying aligned pseudocolored greyscale DAPI (blue) and CD4 (green) images with Foxp3, IL-6, Ki-67, Granzyme B, T-bet, and RORγ(t) (all red) images.
2. Cell Phenotyping Through Cell Isolation and Identification.
Two proprietary algorithms were used to isolate cells from the greyscale images (9–11). One algorithm identified the nucleus of the cell and the other algorithm identified the cell biomarker for the cell phenotype. The nuclei algorithm was based on the presence or absence of DAPI staining (12,13). Nuclei size was set at 5 pixels. Background threshold was set to ignore values below a grey level of 5 and cells smaller than 5 µm. A filled mask was built over areas in the image that contained DAPI staining. A line border was created to encase the filled mask to demark the border of the nucleus. A cellular mask algorithm was used to identify the biomarker for the cell phenotype (14,15). A ring mask was used with a −0.32µm interior radius, 0.63µm exterior radius, 1.26 µm maximum growing step, and a 5 grey level background threshold. A filled mask was built over the biomarker area starting from the centroid of the identified nucleus and stopping at the exterior of the biomarker (e.g. CD4). As with the nuclear border, a line border was created to encase the filled mask to demark the border of the biomarker. This type of cell segmentation was required for linkage of biomarkers to specific cells which allows isolation of individual cells by a specific phenotype. Global standard measurements were computed for area (µm2), mean grey level intensity, perimeter (µm), compactness, and cell location (Cartesian coordinates).
3. Quantitation by Tissue Cytometry.
The staining intensity of each biomarker was based on the computed mean grey level intensity of the biomarker in the cell (16). The grey level is a value that corresponds to the brightness of a pixel in a greyscale image. The range is between 0 (minimum, i.e. black) and 255 (maximum, i.e. white). Since each cell was composed of many pixels, the mean grey level intensity was taken as a global representation of the biomarker in the cell. The histograms contained the mean grey level intensity of the biomarkers on the x-axis (logarithmic scale) and the number of events on the y-axis (linear scale). The 2-D dot scatterplots contained the mean grey level intensity of one biomarker on each axis (logarithmic scale). To enumerate the number of positive and negative cells for each biomarker, threshold cutoffs depicted by horizontal and/or vertical lines were determined manually by backgating to the greyscale and in silico multiplexed tissue images for each biomarker. The proprietary backgating algorithm uses the link between the mean grey level intensity of a cell and its corresponding cell Cartesian coordinates to locate the cell in the tissue images. A contour mask is drawn around the cells to highlight them in the tissue images. Using the backgating algorithm, threshold cutoffs were manually positioned to include or exclude cells and/or cell clusters.
Validation of the Methods
The multiplexed fluorochrome-based histology was validated by single staining of each biomarker using chromogen-based histology on spleen as the gold standard for the location and quality of the biomarkers. The protocol was identical to the above fluorochrome-based histology with the following exceptions: The unconjugated purified versions of the biomarkers were used for staining. After incubation with primary antibodies, the slides were incubated with IgG secondary antibodies conjugated to horseradish peroxidase polymers (Vector Laboratories, Burlingame, CA, USA). The antibody complexes were developed with diaminobenzidine (DAB) (Biocare Medical, Concord, CA, USA). The cell nucleus was stained with hematoxylin (Biocare Medical). The slides were coverslipped and mounted with EcoMount mounting medium (Biocare Medical).
The dye inactivation and proper image acquisition was verified through visual inspection of each image tile. The quantitative analysis of the in silico multiplexed images was validated by several processes. Internally, the StrataQuest software was used to backgate from the histogram plots into both greyscale and in silico multiplexed images of each biomarker to visually verify that both the location and magnitude of staining corresponded with the relative value of the mean grey level intensity. Manually created freeform region gates were also used as a means of verifying cells and cell clusters. Externally, ground truth images of quantitation were generated manually using the cell counter plugin within FIJI software (17). Statistical performance measures of recall/sensitivity, specificity, precision, and F1 score (weighted average of recall/sensitivity and precision) were evaluated comparing the StrataQuest results with the ground truth (18). The following formulas were used:
Recall/sensitivity = true positive ÷ (true positive + false negative)
Specificity = true negative ÷ (true negative + false positive)
Precision = true positive ÷ (true positive + false positive)
F1 score = 2 × ((precision × recall/sensitivity) ÷ (precision + recall/sensitivity))
The true positive is the ground truth positive cell count. The false positive is the numerical difference between the StrataQuest and the ground truth positive cell counts. The false negative is the numerical difference between the StrataQuest and ground truth negative cell counts. The true negative is the ground truth negative cell count.
Data Sharing
All data generated or analyzed in this study are included in this article and are available upon request.
RESULTS
Workflow
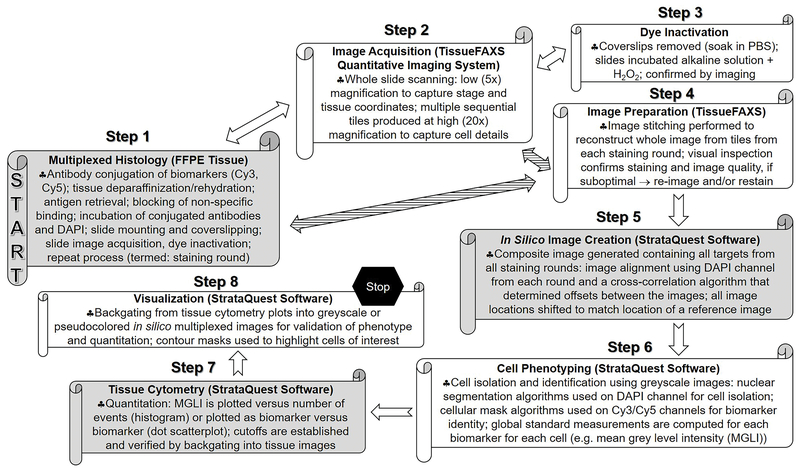
The workflow of the multiplexed fluorochrome-based histology, imaging acquisition, and quantitative analysis process for in silico multiplexed images was summarized in Figure 1. Each histology staining round took up to 2 days. Since this method was designed for FFPE tissue, we performed single stains to evaluate the quality of the conjugation and to optimize the antibodies before multiplexing. Depending on the size of the biospecimen, imaging acquisition took up to 6 hours per slide. Although, through the in silico image creation step, a composite image was generated with all biomarkers, visualization of the biomarkers was still limited to three pseudocolors (red, green, blue) per image to capture colocalized (orange to yellow) biomarkers. Cell phenotyping was empirical and required several iterations of fine-tuning for each biomarker. Tissue cytometry coupled with backgating into the tissue images consistently served as a source of internal validation of the quantitation and provided information on spatial relationships.
Figure 1.
Workflow of the histology, imaging, and analysis process for in silico multiplexed images.
Application
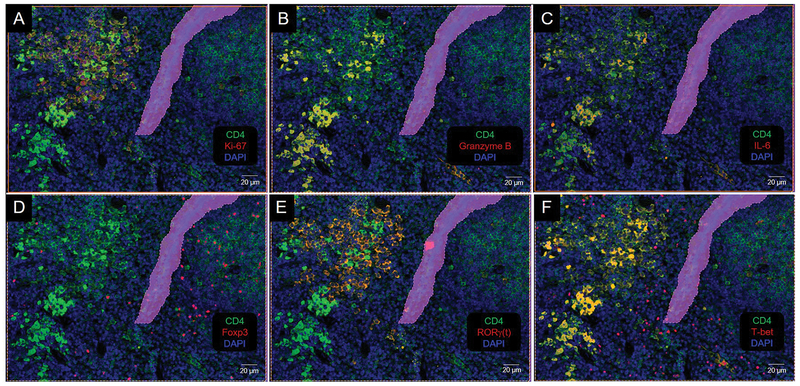
As an example of our approach, we present results from characterizing CD4 cells and cell clusters in spleens from mice with melanoma (7,19). CD4 Cy5, Ki-67 Cy5, Granzyme B Cy5, Foxp3 Cy3, RORγ(t) Cy3, T-bet Cy5, and IL-6 Cy3 were combined in multiple staining rounds with the DAPI nuclear marker on the same slide. The results from the in silico image creation show that the distribution of biomarkers can be distinct in connection with CD4 and that phenotype profiles can be generated using this process (Figure 2). DAPI was our anchor for all of our images and was therefore used to isolate individual cells. However, we identified the cell phenotypes by their co-expression with the CD4 antigen. The spatial distributions of the biomarkers from qualitative assessment suggested that there were three distinct CD4 population clusters (Figure 2). We used cell phenotyping, tissue cytometry, and backgating visualization to characterize the clusters.
Figure 2.
Colocalization of CD4 with biomarkers of cell activity. (A) Ki-67, (B) Granzyme B, (C) IL-6, (D) Foxp3, (E) RORγ(t), and (F) T-bet. Colocalization produces an orange to yellow color. Purple area is a region of exclusion.
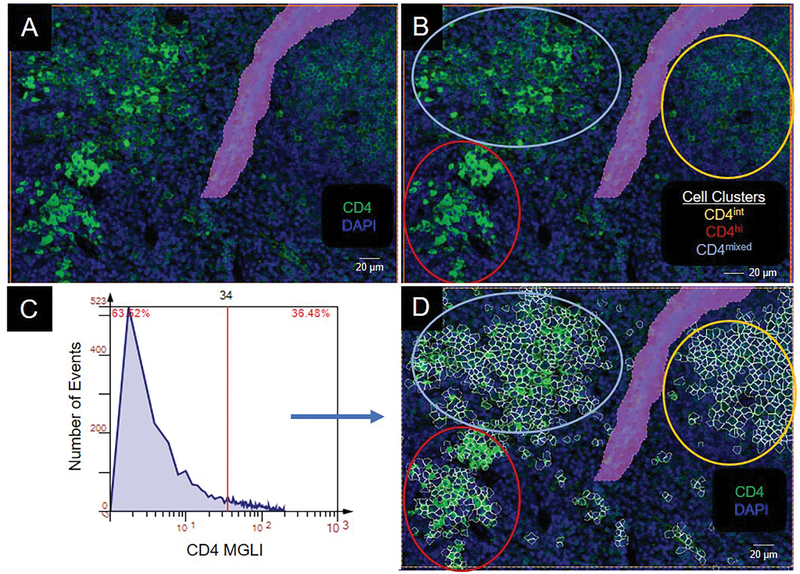
We circled the three CD4 population clusters: high CD4 expressers (lower left), intermediate CD4 expressers (upper right), and mixed CD4 expressers (upper left) (Figure 3A, B). To identify individual cells that expressed CD4, we created a histogram of CD4 expression using greyscale values from 0 to 255. A cutoff value was defined for positive cells by backgating into a CD4 DAPI image and visibly highlighting cells that expressed grey levels greater than the user defined cutoff (Figure 3C, D). In segmenting the images, we observed that areas within the image containing tissue folds, air bubbles from displaced mounting medium, or debris, excited light nonspecifically in the DAPI and Cy3 channels. Therefore, we omitted these areas from segmentation by encasing them in exclusion regions (Figure 3A, B, D).
Figure 3.
Identification and segmentation of CD4 cells. (A) Photomicrograph of CD4+ cells. (B) Cell clusters in panel A are circled based on CD4 staining intensity: intermediate (int), yellow; high (hi), red; mixed, light blue. (C) Histogram of CD4 expression in panel A. MGLI, mean grey level intensity. Cutoff, red vertical line. (D) CD4+ cells backgated from intensity values above the cutoff in panel C. Backgated cells, white contour mask. Purple area is a region of exclusion.
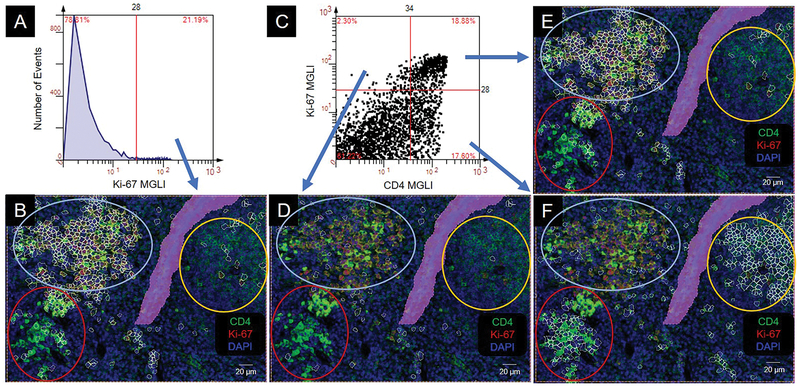
Since we uncovered discrete clusters (intermediate; high, mixed) of CD4 antigen expressing cells, we were interested in determining whether the difference was due to their proliferation state as determined by the biomarker, Ki-67. All Ki-67 positive cells were identified and isolated by histogram (above cutoff) (Figure 4A, B). Using a dot scatterplot, the CD4−Ki-67+ proliferating cells (upper left quadrant) were on the periphery of the clusters (Figure 4C, D). The majority of CD4+Ki-67+ proliferating cells (upper right quadrant) were within the mixed CD4 expresser cluster (Figure 4C, E). The majority of CD4+Ki-67− non-proliferating cells (lower right quadrant) were in the high and the intermediate CD4 expresser clusters (Figure 4C, F).
Figure 4.
Colocalization of CD4 and Ki-67. Colocalization produces an orange to yellow color. CD4 cell clusters are circled: intermediate (int), yellow; high (hi), red; mixed, light blue. MGLI, mean grey level intensity. Cutoffs, red vertical and/or horizonal line. Backgated cells, white contour mask. Purple area is a region of exclusion. (A) Histogram of Ki-67 expression. (B) Backgating of panel A. (C) Scatterplot of Ki-67 and CD4 expression on individual cells. (D, E, F) Backgating from panel C.
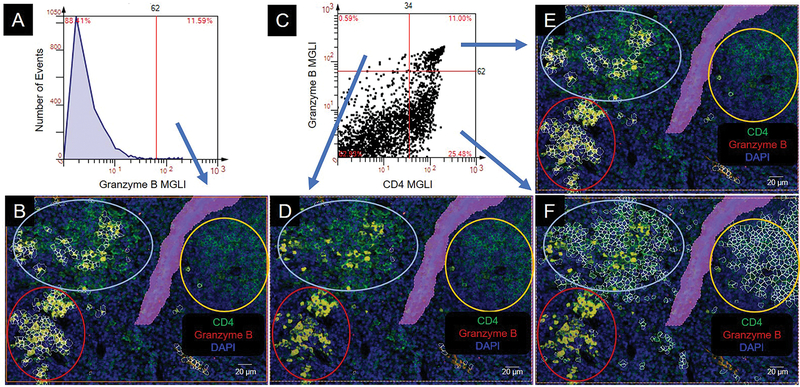
To determine the potential function of the cells in the three clusters we evaluated two secreted products, Granzyme B and IL-6. Granzyme B is a serine protease secreted by cytotoxic cells whose function is to processes cytokines, degrade extracellular matrix proteins, and induce cell apoptosis (20). Our results show that by histogram (above cutoff) the Granzyme B expressing cells were in discrete regions (Figure 5A, B). The dot scatterplot showed that CD4−Granzyme B+ cells (upper left quadrant) were not within the clusters (Figure 5C, D). The CD4+Granzyme B+ cells (upper right quadrant) were located primarily in the mixed and the high CD4 expresser clusters (Figure 5C, E). Interestingly, in these clusters, the CD4+Granzyme B+ cells were predominately associated with the high CD4 expressing cells (Figure 5C, E, F). The CD4+Granzyme B− cells (lower right quadrant) were predominately in the intermediate and mixed CD4 expresser clusters (Figure 5C, F).
Figure 5.
Colocalization of CD4 and Granzyme B. Colocalization produces an orange to yellow color. CD4 cell clusters are circled: intermediate (int), yellow; high (hi), red; mixed, light blue. MGLI, mean grey level intensity. Cutoffs, red vertical and/or horizonal line. Backgated cells, white contour mask. Purple area is a region of exclusion. (A) Histogram of Granzyme B expression. (B) Backgating of panel A. (C) Scatterplot of granzyme B and CD4 expression on individual cells. (D, E, F) Backgating from panel C.
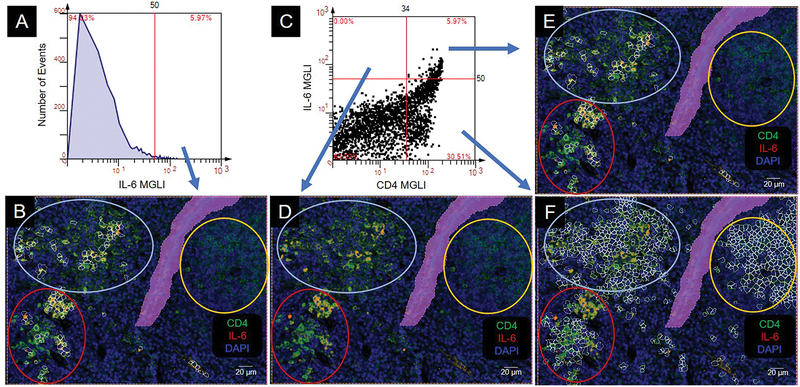
IL-6 is a cytokine that has a role in both inducing and ceasing proinflammatory processes. Histogram analysis showed that IL-6 was in the high expressing CD4 cells (above cutoff) (Figure 6A, B). The dot scatterplot showed that there were very few CD4−IL-6+ cells (upper left quadrant) (Figure 6C, D). The CD4+IL-6+ cells were a subset of both the mixed and the high CD4 expresser clusters (Figure 6C, E). The CD4+IL-6− cells (lower right quadrant) were expressed in all clusters (Figure 6C, F).
Figure 6.
Colocalization of CD4 and IL-6. Colocalization produces an orange to yellow color. CD4 cell clusters are circled: intermediate (int), yellow; high (hi), red; mixed, light blue. MGLI, mean grey level intensity. Cutoffs, red vertical and/or horizonal line. Backgated cells, white contour mask. Purple area is a region of exclusion. (A) Histogram of IL-6 expression. (B) Backgating of panel A. (C) Scatterplot of IL-6 and CD4 expression on individual cells. (D, E, F) Backgating from panel C.
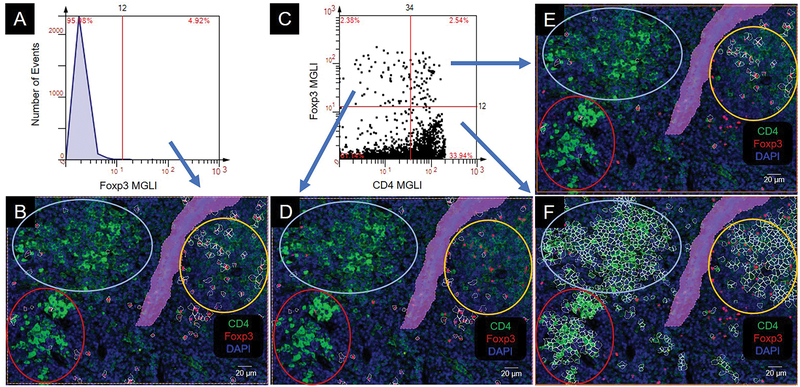
To determine which CD4 subtype best fit each of the three clusters (intermediate, high, mixed), we assessed transcription factors that are known to define specific CD4 subtypes. Forkhead Box P3 (Foxp3) transcription factor suppresses proinflammatory responses as a component of CD4 T cells (Treg). Our histogram (above cutoff) results show areas that were more geared towards the Treg anti-inflammatory response (Figure 7A, B). The dot scatterplot showed that CD4−Foxp3+ cells (upper left quadrant) were predominately located on the periphery of the intermediate CD4 expresser cluster (Figure 7C, D). The CD4+Foxp3+ regulatory cells (upper right quadrant) were predominately within the intermediate CD4 expresser cluster (Figure 7C, E). The CD4+Foxp3− cells (lower right quadrant) were expressed in all clusters (Figure 7C, F).
Figure 7.
Colocalization of CD4 and Foxp3. Colocalization produces an orange to yellow color. CD4 cell clusters are circled: intermediate (int), yellow; high (hi), red; mixed, light blue. MGLI, mean grey level intensity. Cutoffs, red vertical and/or horizonal line. Backgated cells, white contour mask. Purple area is a region of exclusion. (A) Histogram of Foxp3 expression. (B) Backgating of panel A. (C) Scatterplot of Foxp3 and CD4 expression on individual cells. (D, E, F) Backgating from panel C.
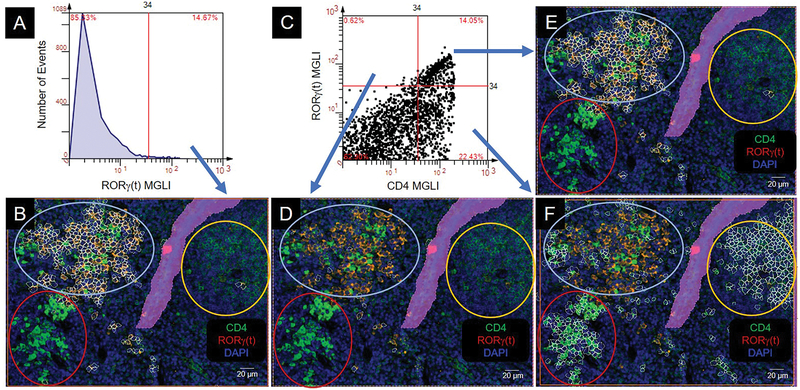
RORγ(t) transcription factor is an isoform (short form) of retinoid acid-related orphan receptor γ (long form) (21). It is found exclusively in immune organs and has been shown to be required for thymocyte survival and lymphoid organogenesis (22). The RORγ(t) clone that we used for staining contained both the long and short forms. We found that the RORγ(t) positive cells from the histogram (above cutoff) were stained in the cytoplasm (Figure 8A, B). In the dot scatterplot, CD4−RORγ(t)+ cells (upper left quadrant) were not notable in any clusters (Figure 8C, D). However, CD4+RORγ(t)+ cells (upper right quadrant) were primarily located in the mixed CD4 expressers cluster (Figure 8C, E). The CD4+RORγ(t)− cells (lower right quadrant) were appreciable in all clusters (Figure 8C, F).
Figure 8.
Colocalization of CD4 and RORγ(t). Colocalization produces an orange to yellow color. CD4 cell clusters are circled: intermediate (int), yellow; high (hi), red; mixed, light blue. MGLI, mean grey level intensity. Cutoffs, red vertical and/or horizonal line. Backgated cells, white contour mask. Purple area is a region of exclusion. (A) Histogram of RORγ(t) expression. (B) Backgating of panel A. (C) Scatterplot of RORγ(t) and CD4 expression on individual cells. (D, E, F) Backgating from panel C.
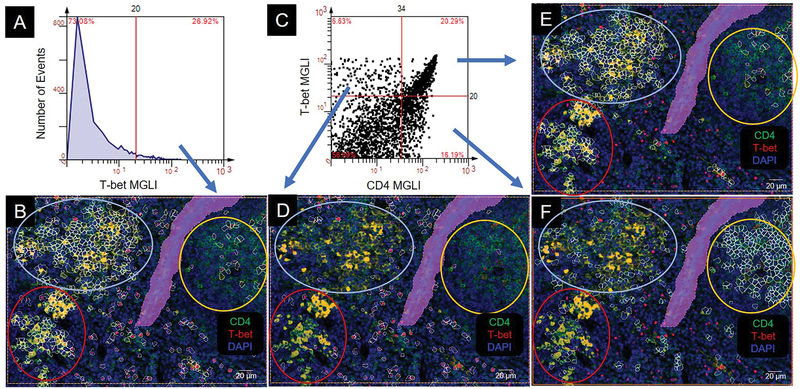
T-bet is a transcription factor whose role in immune cells is to assist in development, differentiation, diversification, and adaption to changing local microenvironments (23). Our results show that by histogram (above cutoff) the T-bet expressing cells were stained either in the cytoplasm or the nucleus and were in all three clusters (Figure 9A, B). The dot scatterplot of T-bet showed that CD4−T-bet+ cells (upper left quadrant) were predominantly nuclear stained and located on the outside or on the periphery of the clusters (Figure 9C, D). The CD4+T-bet+ cells (upper right quadrant) were present in all clusters (Figure 9C, E). However, the cytoplasmic T bet cells were in the mixed and high CD4 expresser clusters. The nuclear T-bet cells were in the intermediate CD4 expresser cluster (Figure 9C, E). The CD4+T-bet− cells (lower right quadrant) were expressed in all clusters (Figure 9C, F).
Figure 9.
Colocalization of CD4 and T-bet. Colocalization produces an orange to yellow color. CD4 cell clusters are circled: intermediate (int), yellow; high (hi), red; mixed, light blue. MGLI, mean grey level intensity. Cutoffs, red vertical and/or horizonal line. Backgated cells, white contour mask. Purple area is a region of exclusion. (A) Histogram of T-bet expression. (B) Backgating of panel A. (C) Scatterplot of T-bet and CD4 expression on individual cells. (D, E, F) Backgating from panel C.
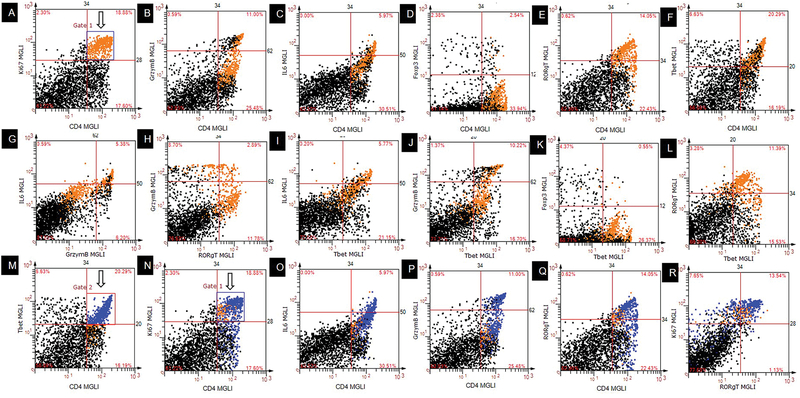
As an alternative gating strategy for dot scatterplots, we used freeform gates equivalent to those used in traditional flow cytometry (Figure 10). Comparable to flow cytometry, the cells within the freeform gates were given a distinct color which allowed visualization of the gated population in all linked dot scatterplots (Figure 10A, B-L). An additional advantage is that these gates can also be used to backgate into the tissue images (data not shown). There are two limitations to this feature: (1) when using multiple gates, it is difficult to distinguish cell populations that overlap spatially (Figure 10M, N, O-R). (2) quantitative data from the linked gates are currently not available (Figure 10B-L; O-R). These limitations are currently being resolved.
Figure 10.
Freeform gated scatterplots. (A – L) Single gate. Cells from Gate1 (orange) in panel A are highlighted in orange in panels B – L. (M – R) Multiple gates. Cells from Gate 2 (blue) in panel M are highlighted in blue in panels N – R in addition to Gate 1 cells (orange). MGLI, mean grey level intensity.
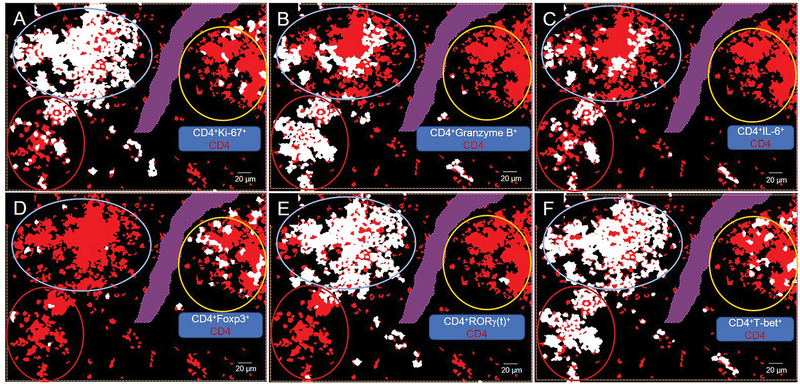
To better display the global results in the context of spatial relationships, cell phenotype masks of each double positive cell were overlaid on a CD4 phenotype mask (Figure 11). This type of visualization accentuated the following global spatial relationships: (1) The intermediate CD4 expresser cluster contained a mixture of Treg and T-bet cells with only a few cells proliferating. (2) The high CD4 expresser cluster contained T-bet, Granzyme B, and IL-6 cells with some cells proliferating. (3) The mixed CD4 expresser cluster contained RORγ(t), T-bet, Granzyme B, and IL-6 cells with most cells proliferating (Figure 11). The limitation of this simplistic representation is that it conceals the nuances associated with biomarkers that are expressed at varying intensities and/or in multiple cellular compartments such as T-bet (Figures 2F, 9, 11F). We are currently working on better visualization approaches to address these limitations.
Figure 11.
Phenotype masks depicting spatial relationships. CD4 cell clusters are circled: intermediate (int), yellow; high (hi), red; mixed, light blue. CD4 cells are labeled with red mask. From backgating, cells that are positive for both CD4 and (A)Ki-67, (B) Granzyme B, (C) IL-6, (D) Foxp3, (E) RORγ(t), (F) T-bet are labeled with white mask. Purple area is a region of exclusion.
To validate the StrataQuest software quantitation, we used performance measures of recall/sensitivity, specificity, precision, and F1 score. The StrataQuest software results were compared with ground truth manual quantitation using FIJI software (Supplemental Table 1, Supplemental Figure 1). The biomarkers had a recall/sensitivity range of 0.85 - 0.99, specificity range of 0.89 – 0.99, precision range of 0.44 – 0.88, and F1 score range of 0.60 – 0.89 (Supplemental Table 1, Supplemental Figure 1).
DISCUSSION
In many diseases such as cancer and autoimmunity, immune cells play a role in disease pathogenesis and responses to therapy. Having the ability to view immune cells in the unadulterated disease microenvironment gives context to the existence of the cells in the microenvironment. In this report we show that our workflow can be used to analyze biomarkers in silico to highlight their associations with cells and cell clusters in solid tissue. In our example, we show associations between splenic CD4 and six of its most common biomarkers of cell activity. Through in silico analysis we found three clusters of CD4 expressing cell populations: intermediate, high, and mixed. Each cell cluster was composed of different combinations of the common biomarkers. Overall, we show that in silico analysis with flow cytometry-like abilities such as gating, backgating, histogram/dot scatterplot outputs are powerful tools for cell phenotyping and uncovering distinct clusters of cells.
Each step of the process leading up to the in silico analysis is critical. We recommend that antibody conjugation be performed with primary antibodies that have been proven to work in FFPE tissue. We routinely perform both immunohistochemistry and immunofluorescence indirect staining on candidate primary antibodies to ensure performance. The primary antibody concentration needs to be at least 1 mg/ml for efficient direct conjugation. Stabilizing agents such as BSA and glycerol inhibit the activity of NHS esters. Therefore, if possible, it is best to use purified antibodies that are formulated only in buffered saline solutions.
There is no replacement for good quality tissue sections or good quality staining. Multiplexed immunofluorescence histology requires elimination of nonspecific binding and accounting for autofluorescence. The biomarker signal to noise ratio must be high. Each round of staining may take at least 24 hours depending on the antibodies and the tissue. Although multiplex histology procedures in general are long, FFPE tissue quality is maintained under chemically-induced antibody stripping and/or dye inactivation procedures (8,24,25). Although rare, some epitopes may not only be sensitive to the multiplexing procedures but may be sensitive to FFPE histology in general (8).
Image acquisition can be performed on small regions or on the full biopsy specimen. We strongly recommend that before moving on to the next staining round, all image tiles be reviewed for consistency in quality and camera focus. Any discrepancies must be corrected before moving on to the next staining round. The in silico multiplexed images are the key to cell phenotyping, visualization, enumeration, and validation of the multiplexed stains. Image alignment is a critical step in this process. Accurate registration of all DAPI images with the reference image should be verified visually by combining the DAPI images. The quantitative analysis histogram plots and dot scatterplots should be viewed in both linear and logarithmic scale to determine which form best represents the data.
We have previously shown a similar workflow process using the Vectra Quantitative Imaging System and now show this type of process using the TissueFAXS Quantitative Imaging System (24,25). The software tools that are included with these all-in-one systems (Vectra, TissueFAXS), although proprietary, are not unique to digital image processing. Although not an exhaustive list, there are several commercial (FCS Express, FlowJo, MATLAB) and open source (Cell Profiler, FIJI) software that can create the tissue cytometry plots from imported data from the quantitative imaging systems and/or perform various levels of cell segmentation/analysis ranging from basic to complex. However, there are many advantages of using the all-in-one systems (Vectra, TissueFAXS): (1) The hardware and software tools are packaged together, which ensures compatibility and a streamlined programming language. (2) The software allows creation and saving of complex templates that can be reused, which reduces analysis preparation time. (3) The software has automated analysis that allows unsupervised batch processing of thousands of tiles, which significantly reduces hands-on time for the user. (4) Although not presented for this study, the most promising feature included specifically in the TissueFAXS system is the ability for users to incorporate their own MATLAB and Python scripts into the StrataQuest analysis software.
Since immunotherapy is at the forefront of therapeutic treatment, these all-in-one systems can be used to interrogate the microenvironment of any tissue, pre-, post-, and on- therapy. Any entity (RNA, DNA, Protein, Drug) that can be stained on FFPE tissue can be assessed using the methods described here or in our previous studies, and in similar studies from others (8,24–26). This ability provides another mechanism that can be utilized in the global movement towards personalized medicine.
Supplementary Material
Supplemental Figure 1. Manual cell count with FIJI software. (A) DAPI, (B) Foxp3, (C) RORγT, (D) IL-6, (E) Ki-67, (F) Granzyme B, (G) T-bet, and (H) CD4.
Supplemental Table 1. Performance assessment of StrataQuest quantitation.
ACKNOWLEDGEMENTS
We would like to thank Radu Rogojanu, Cosmin Popovici, Catalin Captarencu, Stefan Sarbu, Eduard Clim, Bogdan Boghiu, and Rupert Ecker from TissueGnostics, (Vienna, Austria) for their technical support. We gratefully acknowledge the support of this study by National Cancer Institute, Grant/Award Number: R01 CA196660; Melanoma Research Alliance Young Investigator Award; and Melanoma Research Foundation
Footnotes
This work was supported by National Cancer Institute, Grant/Award Number: R01 CA196660; Melanoma Research Alliance Young Investigator Award; and Melanoma Research Foundation
REFERENCES
- 1.Isse K, Lesniak A, Grama K, Roysam B, Minervini MI, Demetris AJ. Digital transplantation pathology: combining whole slide imaging, multiplex staining and automated image analysis. Am J Transplant 2012;12:27–37. [DOI] [PMC free article] [PubMed] [Google Scholar]
- 2.Levenson RM, Borowsky AD, Angelo M. Immunohistochemistry and mass spectrometry for highly multiplexed cellular molecular imaging. Lab Invest 2015;95:397–405. [DOI] [PMC free article] [PubMed] [Google Scholar]
- 3.Giesen C, Wang HA, Schapiro D, Zivanovic N, Jacobs A, Hattendorf B, Schuffler PJ, Grolimund D, Buhmann JM, Brandt S and others. Highly multiplexed imaging of tumor tissues with subcellular resolution by mass cytometry. Nat Methods 2014;11:417–22. [DOI] [PubMed] [Google Scholar]
- 4.Bodzon-Kulakowska A, Suder P. Imaging mass spectrometry: Instrumentation, applications, and combination with other visualization techniques. Mass Spectrom Rev 2016;35:147–69. [DOI] [PubMed] [Google Scholar]
- 5.DuPage M, Bluestone JA. Harnessing the plasticity of CD4(+) T cells to treat immune-mediated disease. Nat Rev Immunol 2016;16:149–63. [DOI] [PubMed] [Google Scholar]
- 6.Takeuchi A, Saito T. CD4 CTL, a Cytotoxic Subset of CD4(+) T Cells, Their Differentiation and Function. Front Immunol 2017;8:194. [DOI] [PMC free article] [PubMed] [Google Scholar]
- 7.Meeth K, Wang JX, Micevic G, Damsky W, Bosenberg MW. The YUMM lines: a series of congenic mouse melanoma cell lines with defined genetic alterations. Pigment Cell Melanoma Res 2016;29:590–7. [DOI] [PMC free article] [PubMed] [Google Scholar]
- 8.Gerdes MJ, Sevinsky CJ, Sood A, Adak S, Bello MO, Bordwell A, Can A, Corwin A, Dinn S, Filkins RJ and others. Highly multiplexed single-cell analysis of formalin-fixed, paraffin-embedded cancer tissue. Proc Natl Acad Sci U S A 2013;110:11982–7. [DOI] [PMC free article] [PubMed] [Google Scholar]
- 9.Steiner GE, Ecker RC, Kramer G, Stockenhuber F, Marberger MJ. Automated data acquisition by confocal laser scanning microscopy and image analysis of triple stained immunofluorescent leukocytes in tissue. Journal of immunological methods 2000;237:39–50. [DOI] [PubMed] [Google Scholar]
- 10.Ecker RC, Steiner GE. Microscopy-based multicolor tissue cytometry at the single-cell level. Cytometry A 2004;59:182–90. [DOI] [PubMed] [Google Scholar]
- 11.Ramoser H, Laurain V, Bischof H, Ecker R. Leukocyte segmentation and classification in blood-smear images. Conf Proc IEEE Eng Med Biol Soc 2005;4:3371–4. [DOI] [PubMed] [Google Scholar]
- 12.Laurain V, Ramoser H, Nowak C, Steiner G, Ecker R. Fast automatic segmentation of nuclei in microscopy images of tissue sections. 2006. IEEE; p 3367–3370. [DOI] [PubMed] [Google Scholar]
- 13.Rogojanu R, Bises G, Smochina C, Manta V. Segmentation of cell nuclei within complex configurations in images with colon sections. 2010. IEEE Computer Society; p 243–246. [Google Scholar]
- 14.Smochina C, Rogojanu R, Manta V, Kropatsch W. Epithelial area detection in cytokeratin microscopic images using MSER segmentation in an anisotropic pyramid. 2011. Springer; p 318–329. [Google Scholar]
- 15.Schmid M, Dufner B, Durk J, Bedal K, Stricker K, Prokoph LA, Koch C, Wege AK, Zirpel H, van Zandbergen G and others. An Emerging Approach for Parallel Quantification of Intracellular Protozoan Parasites and Host Cell Characterization Using TissueFAXS Cytometry. PLoS One 2015;10:e0139866. [DOI] [PMC free article] [PubMed] [Google Scholar]
- 16.Ecker RC, Rogojanu R, Streit M, Oesterreicher K, Steiner GE. An improved method for discrimination of cell populations in tissue sections using microscopy-based multicolor tissue cytometry. Cytometry A 2006;69:119–23. [DOI] [PubMed] [Google Scholar]
- 17.Schindelin J, Arganda-Carreras I, Frise E, Kaynig V, Longair M, Pietzsch T, Preibisch S, Rueden C, Saalfeld S, Schmid B and others. Fiji: an open-source platform for biological-image analysis. Nat Methods 2012;9:676–82. [DOI] [PMC free article] [PubMed] [Google Scholar]
- 18.Rogojanu R, Thalhammer T, Thiem U, Heindl A, Mesteri I, Seewald A, Jager W, Smochina C, Ellinger I, Bises G. Quantitative Image Analysis of Epithelial and Stromal Area in Histological Sections of Colorectal Cancer: An Emerging Diagnostic Tool. Biomed Res Int 2015;2015:569071. [DOI] [PMC free article] [PubMed] [Google Scholar]
- 19.Wang J, Perry CJ, Meeth K, Thakral D, Damsky W, Micevic G, Kaech S, Blenman K, Bosenberg M. UV-induced somatic mutations elicit a functional T cell response in the YUMMER1.7 mouse melanoma model. Pigment Cell & Melanoma Research 2017;30:428–435. [DOI] [PMC free article] [PubMed] [Google Scholar]
- 20.Afonina IS, Cullen SP, Martin SJ. Cytotoxic and non-cytotoxic roles of the CTL/NK protease granzyme B. Immunol Rev 2010;235:105–16. [DOI] [PubMed] [Google Scholar]
- 21.Eberl G, Littman DR. The role of the nuclear hormone receptor RORgammat in the development of lymph nodes and Peyer’s patches. Immunol Rev 2003;195:81–90. [DOI] [PubMed] [Google Scholar]
- 22.Kurebayashi S, Ueda E, Sakaue M, Patel DD, Medvedev A, Zhang F, Jetten AM. Retinoid-related orphan receptor gamma (RORgamma) is essential for lymphoid organogenesis and controls apoptosis during thymopoiesis. Proc Natl Acad Sci U S A 2000;97:10132–7. [DOI] [PMC free article] [PubMed] [Google Scholar]
- 23.Kallies A, Good-Jacobson KL. Transcription Factor T-bet Orchestrates Lineage Development and Function in the Immune System. Trends Immunol 2017;38:287–297. [DOI] [PubMed] [Google Scholar]
- 24.Blenman KR, Lee PP. Quantitative and spatial image analysis of tumor and draining lymph nodes using immunohistochemistry and high-resolution multispectral imaging to predict metastasis. Methods Mol Biol 2014;1102:601–21. [DOI] [PubMed] [Google Scholar]
- 25.Blenman KRM, He TF, Frankel PH, Ruel NH, Schwartz EJ, Krag DN, Tan LK, Yim JH, Mortimer JE, Yuan Y and others. Sentinel lymph node B cells can predict disease-free survival in breast cancer patients. NPJ Breast Cancer 2018;4:28. [DOI] [PMC free article] [PubMed] [Google Scholar]
- 26.Bruggen MC, Bauer WM, Reininger B, Clim E, Captarencu C, Steiner GE, Brunner PM, Meier B, French LE, Stingl G. In Situ Mapping of Innate Lymphoid Cells in Human Skin: Evidence for Remarkable Differences between Normal and Inflamed Skin. J Invest Dermatol 2016;136:2396–2405. [DOI] [PubMed] [Google Scholar]
Associated Data
This section collects any data citations, data availability statements, or supplementary materials included in this article.
Supplementary Materials
Supplemental Figure 1. Manual cell count with FIJI software. (A) DAPI, (B) Foxp3, (C) RORγT, (D) IL-6, (E) Ki-67, (F) Granzyme B, (G) T-bet, and (H) CD4.
Supplemental Table 1. Performance assessment of StrataQuest quantitation.


