SUMMARY
We evaluated the spontaneous and immunotherapy-induced histological changes in the tumor microenvironment of a mouse melanoma regression model consisting of immunocompetent C57BL/6J mice implanted with syngeneic YUMMER1.7 melanoma cells. We focused on tumor regression phenotypes and spatial relationships of melanoma cells with B cells and neutrophils since this was not previously described. We found common themes to the host response to cancer irrespective of the mode of tumor regression. In nonregression tumors, melanoma cells were epithelioid shaped and tightly packed. In regression tumors, melanoma cells were spindle shaped and discohesive. B cells including plasmablasts and plasma cells were numerous and were increased with immunotherapy. Neutrophils were in direct contact with dead or dying melanoma cells. Immunotherapy increased neutrophil counts and induced neutrophil extracellular traps (NETs)-like formations and geographic necrosis. Beyond tumor regression, the increase in the B cell and neutrophil response could play a role in immunotherapy induced adverse reactions.
Keywords: melanoma, mouse models, B cells, neutrophils, Ly6B.2, histology, tumor regression, NETs
INTRODUCTION
We have recently described a novel syngeneic murine melanoma cell line, YUMMER1.7, that expresses genomic features seen in human melanoma and spontaneously regress in immunocompetent C57BL/6J mice (Wang et al., 2017). Using this model, assessment of the kinetics of infiltrating T cells and macrophages as well as mitotic rate and caspase 3 mediated apoptotic cell death showed that the host immune system has a prominent role in tumor eradication (Wang et al., 2017). In addition, the YUMMER1.7 cell line responds to immunotherapies including anti-CTLA-4 and anti-PD-1. A limitation to many murine models, including the YUMMER1.7 model, is that the penetrance is seldom 100%. There is considerable variability in the tumor volume at specific time points in the YUMMER1.7 model (Wang et al., 2017). We hypothesize that some of the variability is due to the immune response to the clonal heterogeneity of the cancer cells over time.
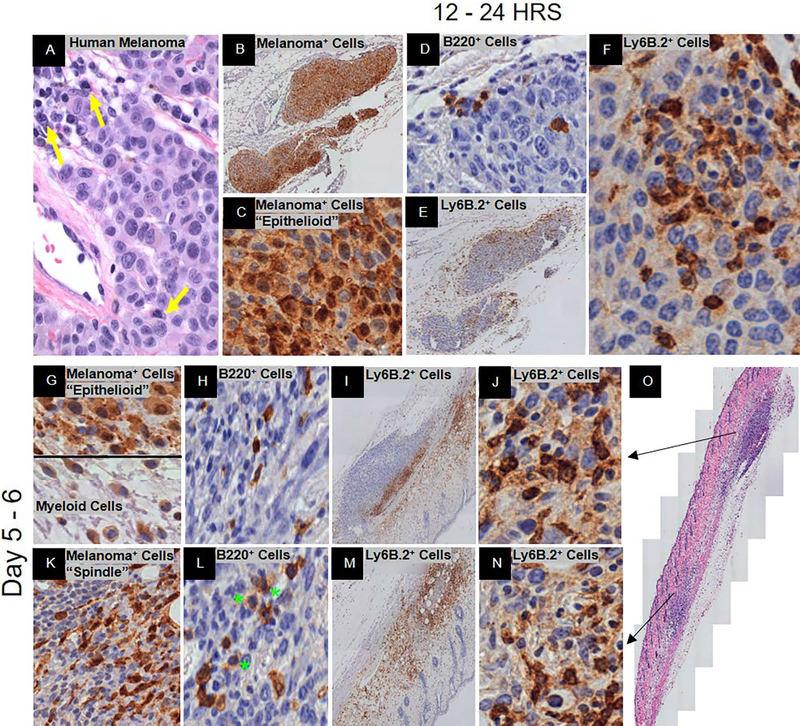
Beyond T cells and macrophages, many other immune cell populations are in the tumor microenvironment. For instance, B cells and neutrophils have been shown to be present and active during tumor growth and regression in humans (Figure 1A) (Chiaruttini et al., 2017; Li et al., 2011; Zurac et al., 2012). B cells mature into plasmablasts and plasma cells that secrete antibodies that bind to toxins, pathogens, and cancer cells. The antibodies tag these entities for destruction directly by complement mediated lysis or indirectly though cell-cell contact with cytotoxic cells. In murine pathology, B220, a 220kDa MW isoform of CD45, is the pan biomarker for B cells (Hardy & Hayakawa, 2001). It is expressed at high levels from the pre-B cell stage to the mature activated stage (Hardy & Hayakawa, 2001). It is expressed at low levels on plasmablasts and plasma cells (Bermejo et al., 2011).
Figure 1.
Spontaneous immunosurveillance. Representative histology is shown at low and/or high magnification. (A) H&E of human metastatic melanoma with plasma cell infiltration. Yellow arrows denote plasma cells. (B – O) C57BL/6J mice post-YUMMER1.7 implantation. At 12 – 24 hrs., (B, C) GFP+ melanoma cells (nucleus+cytoplasmic+), (D) B220+ B cells, and (E, F) Ly6B.2+ neutrophils. At 5–6 days, (G, K) GFP+ melanoma cells (nucleus+cytoplasmic+) and antigen presenting cells (nucleus−/lowcytoplasmic+), (H, L) B220+ B cells (green stars denote plasmablasts and/or plasma cells), (I, J, M, N) Ly6B.2+ neutrophils, and (O) H&E of biopsy. Black arrows depict the area of the biopsy specimen that the row represents.
Neutrophils functionally interact with B cells by not only binding antibody but also inducing antibody production (Cerutti, Puga, & Magri, 2013). Neutrophils are cytotoxic cells that are the first responders to breaches in the immune system (Amulic, Cazalet, Hayes, Metzler, & Zychlinsky, 2012). They survey the problem microenvironment, kill as many infected or cancer cells as possible, and secrete soluble products to recruit/stimulate other immune cells (e.g. T cells, B cells) to assist in resolving the problem (Amulic et al., 2012; Dissemond et al., 2003; Granot & Jablonska, 2015; Yan et al., 2014). In mice, the most common biomarker for neutrophils is Ly6G/C (clone Gr-1) which is also found on T cells, NK cells, monocytes, and dendritic cells (Lee, Wang, Parisini, Dascher, & Nigrovic, 2013). However, Ly6B.2, a 25kD protein with highest expression in C57BL/6J mice, is expressed predominately on neutrophils and is additionally upregulated only on a small subset of monocytes/activated tissue macrophages. Although their function is not known, these proteins are GPI-anchored on the cell membrane and can be secreted (Lee et al., 2013; Rosas, Thomas, Stacey, Gordon, & Taylor, 2010).
To understand the kinetics of the in vivo growth characteristics of and immune response to YUMMER1.7, we subcutaneously implanted these cells into the flanks of C57BL/6J mice and followed them over time. Three steps in this process were captured: immunosurveillance, adaptive immune response, and the regression interval. The first step, immunosurveillance via the innate immune response, has been suggested to be the process by which mutated somatic cells are eliminated or inactivated by the immune system before they become a cancerous lesion. However, cancer cells are thought to escape immunosurveillance by immunoediting (accumulating immune tolerant mutations) and by creating an immune suppressive microenvironment (Corthay, 2014). As a result, the adaptive immune response is initiated leading to an orchestrated antigen-specific cancer cell death. The resolution of this response culminates in regression. Regression is defined as a decrease in the size of a tumor, number of cancer cells, or extent of cancer in the host. The regression interval is the time period corresponding to a statistically significant reduction in tumor volumes on tumor growth curves. In our study, immunosurveillance is the time period from implantation up to day 6. The adaptive immune response is from day 7 to 19. The regression interval is from day 20 onwards post implantation. These time periods were chosen based on the tumor regression cycle that we have observed in-house with over 100 mice. In this report, we describe the histological phenotypes of tumor regression produced in our YUMMER1.7 model and introduce the kinetics of infiltrating B220+ B cells and Ly6B.2+ neutrophils with and without immunotherapy.
METHODS
Cell lines and tissue culture
The generation of the syngeneic YUMMER1.7 cell line was described previously (Wang et al., 2017). Briefly, the YUMM1.7 cell line was exposed to three rounds of UVB radiation (1500 J/m2) to create the YUMMER1.7 cell line. The YUMMER1.7-GFP cell line was generated using a P-YUK-GFP plasmid with PiggyBac Transposase Expression Vector, a gift from Tian Xu, Yale University Department of Genetics (Wang et al., 2017). All cell lines were maintained in DMEM/F12 media containing 10% fetal bovine serum, 1% penicillin-streptomycin, and 1% non-essential amino acids.
In vivo mouse model
The YUMMER1.7 spontaneous regression mouse model was described previously (Wang et al., 2017). Briefly, C57BL/6J mice (4 – 6 weeks old) were implanted subcutaneously in the rear flank with 100 μl of syngeneic YUMMER1.7 cells in PBS. Immunotherapy (anti-CTLA-4 (clone 9H10, Bio X Cell, West, Lebanon, NH, USA), anti-PD-1 (clone RMP1–14, Bio X Cell)), or corresponding isotype controls (Syrian hamster IgG2, Rat IgG2a, respectively) were injected 6 days post cell line implantation at 10 mg/kg three times per week for four weeks. All animal experiment protocols were followed according to the Yale Office of Animal Research Support Committee guidelines.
Histological analysis
Four to six tumors from every time point were fixed in 10% Neutral Buffered Formalin and embedded in paraffin. The blocks were sectioned at a thickness of 5 μm and stained with GFP (Rabbit Polyclonal, Abcam, Cambridge, UK), Ki-67 (clone SP6, Biocare Medical, Pacheco, CA, USA), B220 (clone RA3–6B2, BD Biosciences, San Jose, CA, USA), or Ly6B.2 (clone 7/4, Bio-Rad, Hercules, CA, USA). The stains were developed with anti-IgG HRP combined with DAB substrate chromogen (Agilent Dako, Santa Clara, CA, USA). The full biopsy section for each tumor was acquired at 20x magnification and the image was analyzed using the TissueFAXS quantitative imaging system (TissueGnostics, Vienna, Austria).
Statistical analysis
Unpaired two-tailed t tests and Kruskal-Wallis one-way ANOVA statistical analyses were conducted using GraphPad PRISM version 7.01 (GraphPad Software, La Jolla, CA, USA). All statistical significance was considered as P < 0.05.
RESULTS
Qualitative Analysis
Spontaneous Regression: Immunosurveillance
Twelve to 24 hrs. post-implantation of the regression-prone YUMMER1.7 cell line, the anti-GFP+ stained melanoma cells were morphologically epithelioid and tightly clustered (Figure 1B, C). Intra-tumor B220+ B cells appeared at 24 hrs. (Figure 1D). Intra-tumor Ly6B.2+ neutrophils appeared as early as 12 hrs. with significant infiltration both peri- and intra-tumor at 24 hrs. (Figure 1E). These cytotoxic cells had direct cell-cell contact with melanoma cells that were dead or dying and some cells with intact nuclei (Figure 1F). Since the Ly6B.2 protein can be secreted, some appear to have been transferred to the contacted cells as shown by weak cytoplasmic staining in areas of high activity (Figure 1F). There was edema and influx of Ly6B.2+ neutrophils within those areas (data not shown).
At day six, there were biospecimens with separate regions of nonregression and regression within the same biospecimen (Figure 1G - O). There was significant edema and hemorrhage which was common in our model (data not shown). In the areas of edema, there were numerous cells that contained GFP in their nucleus and/or cytoplasm (Figure 1G). The cells that contain GFP in their nucleus were YUMMER1.7 melanoma cells (Figure 1G). Based on morphology, those cells that possessed GFP exclusively in their cytoplasm were antigen presenting cells (macrophages, dendritic cells, neutrophils) (Figure 1G).
In the nonregressed region the tumor area was increased in size with the GFP+ melanoma cells still maintaining an epithelioid appearance (Figure 1G). The B220+ B cells were small and peri-tumoral only (Figure 1H). The Ly6B.2+ neutrophils were primarily peri-tumor with a few intra-tumor (Figure 1I). In the regressed region, the GFP+ melanoma cells had a spindle-like morphology and were scattered with signs of cell fragmentation (Figure 1K). The B220+ B cells in this region were large and spread throughout the intra-tumor area. Their size and morphology were consistent with plasmablasts and plasma cells (Figure 1L). Numerous Ly6B.2+ neutrophils were present both peri- and intra- tumor (Figure 1M). There was no difference in neutrophil cell–cell contact between nonregressed and regressed regions (Figure 1J, N). There was no geographic necrosis. It appears that the melanoma subclones in the nonregression region were primarily immune resistant and those in the regression region were primarily immune sensitive.
Spontaneous Regression: Adaptive Immune Response
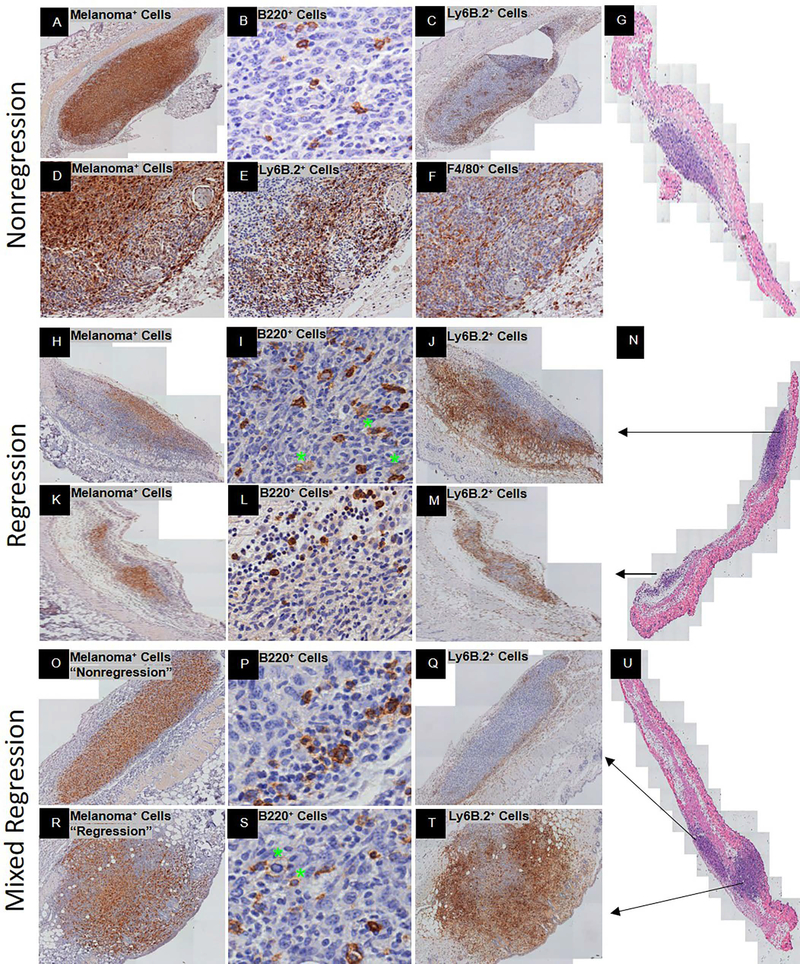
At days nine to eleven, there were three basic regression phenotypes: exclusive nonregression, exclusive regression, and mixed regression (Figure 2G, N, U). The exclusive nonregression phenotype contained tightly clustered epithelioid GFP+ melanoma cells that comprised more than 50% of the tumor bed (Figure 2A, D). The B220+ B cells were predominately small and scattered throughout the region (Figure 2B). The Ly6B.2+ neutrophils were discrete and in patchy clusters intra-tumor (Figure 2C). However, they predominately aggregated peri-tumor with intermediate to high expression of the Ly6B.2 protein (Figure 2C, E). In addition, the morphology of the intra-tumor and peri-tumor Ly6B.2+ neutrophils were inconsistent with the locations and morphology of F4/80+ macrophages (Figure 2D - F). There was mild to moderate peri-tumor edema, hemorrhage, but no signs of geographic necrosis (data not shown).
Figure 2.
Spontaneous adaptive immune response at Day 9–10 post-YUMMER1.7 implantation in C57BL/6J mice. Three regression phenotypes were identified: exclusive nonregression (A-G), exclusive regression (H-N), and mixed regression (O-U). Representative histology is shown at low and/or high magnification. Exclusive nonregression phenotype includes (A) GFP+ melanoma cells (nucleus+cytoplasmic+), (B) B220+ B cells, and (C) Ly6B.2+ neutrophils. (D-F) Low magnification of GFP+ melanoma cells (nucleus+cytoplasmic+) with corresponding peri-tumor Ly6B.2+ neutrophils and F4/80+ macrophages, respectively. (G) H&E of exclusive nonregression biopsy. Exclusive regression phenotype includes (H, K) GFP+ melanoma cells (nucleus+cytoplasmic+), (I, L) B220+ B cells, (J, M) Ly6B.2+ neutrophils, and (N) H&E of exclusive regression biopsy. Mixed regression consists of an area with nonregression (O-Q) and an area with regression (R-T). Mixed regression phenotype includes (O, R) GFP+ melanoma cells (nucleus+cytoplasmic+), (P, S) B220+ B cells (green stars denote plasmablasts and/or plasma cells), and (Q, T) Ly6B.2+ neutrophils. (U) H&E of mixed regression biopsy. Black arrows depict the area of the biopsy specimen that the row represents.
The exclusive regression phenotype contained epithelioid and spindle shaped GFP+ melanoma cells that comprised less than 50% of the tumor bed (Figure 2H, K). The melanoma cells were discohesive in areas where they were spindle shaped but formed tight clusters in areas where they were epithelioid shaped. High and low expressing B220+ B cells were in the areas surrounding the residual melanoma cells (Figure 2I, L). Densely packed Ly6B.2+ neutrophils with intermediate to high levels of protein were also surrounding the residual melanoma cells (Figure 2J, M). There was extensive peri-tumor edema with numerous infiltrating Ly6B.2+ neutrophils and no signs of geographic necrosis.
Mixed regression consisted of an area with nonregression and an area with regression (Figure 2U). In the nonregression and regression areas, the GFP+ melanoma cells were consistent with previous descriptions of the phenotypes (Figure 2O, R). In the nonregression area, the B220+ B cells were predominately peri-tumor and intermediate in size with a few scattered intra-tumor (Figure 2P). In the regression area, the B220+ B cells were intermediate to large size and spread throughout the tumor bed (Figure 2S). For both nonregression and regression areas, B220 expression was high on peri-tumor B cells and low on intra-tumor B cells. In the nonregression area, the Ly6B.2+ neutrophils were predominately located peri-tumor (Figure 2Q). The few that were scattered intra-tumor expressed intermediate to low levels of Ly6B.2 protein. In the regressed area, the Ly6B.2+ neutrophils were spread throughout the tumor bed (Figure 2T). The Ly6B.2 protein expression was high and most dense in areas containing spindle shaped melanoma cells (Figure 2R, T). There was mild edema peri-tumor but no geographic necrosis.
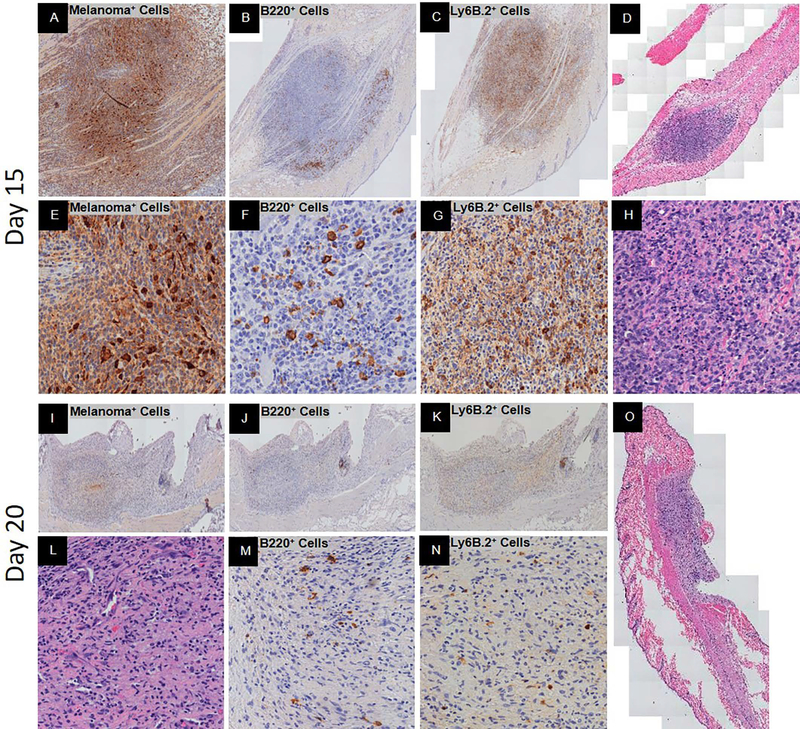
Days fifteen to sixteen, the tumor mass was sizable with less than five percent GFP+ melanoma cells which were primarily spindled shaped (Figure 3A, E, D). The B220+ B cells were intermediate to large size and spread throughout with a significant proportion undergoing fragmentation (Figure 3B, F). The Ly6B.2+ neutrophils were numerous and evenly spread throughout the intra-tumor area unlike their distribution at the earlier time points (Figure 3C, G). These cells expressed intermediate to high levels of the Ly6B.2 protein (Figure 3C, G). There was mild peri-tumor edema but very few infiltrating Ly6B.2+ neutrophils. There were signs of cell death but no geographic necrosis (Figure 3H).
Figure 3.
Peak spontaneous adaptive immune response and complete spontaneous regression post-YUMMER1.7 implantation in C57BL/6J mice. Representative histology at low and/or high magnification. At 15 days, (A, E) GFP+ melanoma cells (nucleus+cytoplasmic+), (B, F) B220+ B cells with signs of fragmentation, (C, G) Ly6B.2+ neutrophils, and (D, H) H&E of biopsy. At 20 days, (I, L) GFP+ melanoma cells (nucleus+cytoplasmic+), (J, M) B220+ B cells, (K, N) Ly6B.2+ neutrophils, and (O) H&E of biopsy.
Spontaneous Regression: Regression Interval
At days twenty to twenty-five, there was complete regression. A mass was visible but lacked GFP+ melanoma cells (Figure 3I, L, O). The mass was composed of immune cells and fibrocytes. The B220+ B cells were few and small to intermediate in size with signs of fragmentation (Figure 3J, M). Most of the infiltrating neutrophils were morphologically classic neutrophils that were interestingly Ly6B.2 low/negative (Figure 3K, L, N). There was no edema or signs of geographic necrosis (Figure 3O).
Immunotherapy-induced Regression
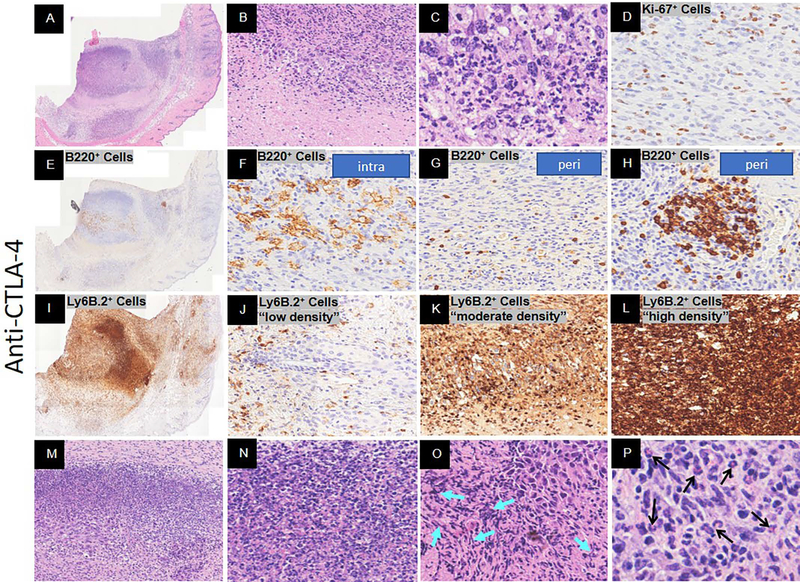
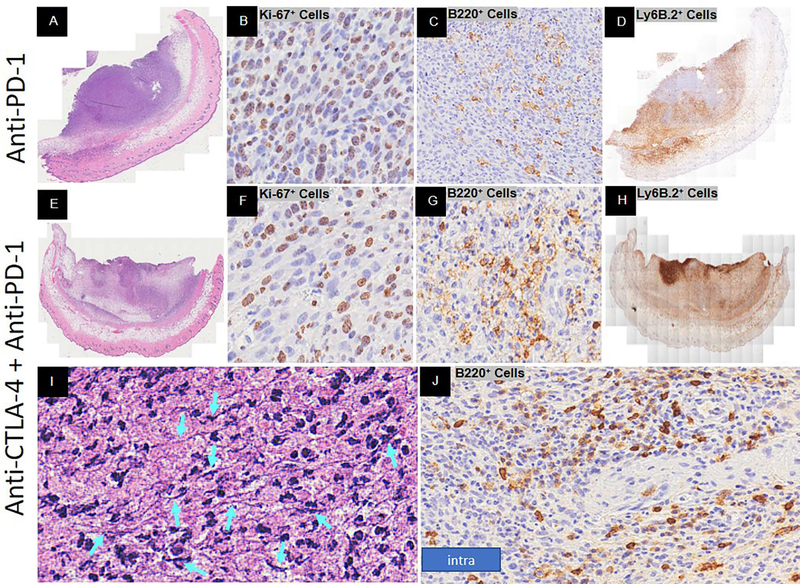
To compare the peak adaptive immune response of spontaneous and immunotherapy-induced regression (anti-CTLA-4, anti-PD-1, combination), we assessed the pathology of immunotherapy-induced regression at 16 days post YUMMER1.7 implantation. The isotype control treatment displayed a nonregression phenotype (data not shown). The anti-CTLA-4 treatment displayed a regression phenotype (Figure 4A). There were very few melanoma cells remaining and even fewer were Ki67+ proliferating cells (Figure 4B, C, D). The bulk of the tumor mass consisted of geographic necrosis and immune cells. The B220+ B cells were numerous and predominately intermediate to large size with signs of fragmentation when located intra-tumor (Figure 4E, F). The peri-tumor B220+ B cells were small with occasional clusters near a vessel (Figure 4G, H). There was a broad range of Ly6B.2+ protein concentrations and cell densities within the tumor mass (Figure 4I - L). Unlike spontaneous regression, neutrophil extracellular traps (NETs) – like formations were seen (Figure 4M - O). NETs are large extracellular web-like structures produced by the suicide of neutrophils. These structures are composed of cytosolic and granule proteins that were assembled on a scaffold of decondensed chromatin (Papayannopoulos, 2018; Shiogama et al., 2016; Wong et al., 2015). In our model NETs-like formations coincide with the high Ly6B.2+ protein dense regions (Figure 4L). These regions were rich in classic neutrophils and nuclear debris (Figure 4M, N) as well as extracellular DNA (Figure 4O). There was also extensive peri-tumor edema that contained numerous Ly6B.2+ neutrophils. In addition, there were eosinophils within the tumor bed (Figure 4P).
Figure 4.
Response to anti-CTLA-4 immunotherapy Day 16 post-YUMMER1.7 implantation in C57BL/6J mice. Representative histology at low and/or high magnification. (A-C) H&E of full biopsy, tumor regression with necrosis (low magnification), and melanocyte cell death, respectively. (D) Ki-67+ proliferating cells. (E-H) B220+ B cells at low magnification and high magnification (intra-tumor (plasmablasts and/or plasma cells), peri-tumor, and surrounding a vessel, respectively). (I-L) Ly6B.2+ neutrophils at low magnification and high magnification with low, moderate, and high density, respectively. (M-O) Neutrophil extracellular traps (NETs)-like formations (turquoise arrows denote DNA fiber networks). (P) Eosinophils (denoted by black arrows).
The anti-PD-1 treatment displayed a partial regression phenotype. Greater than 50% of the mass were small immune cells and there was moderate peri-tumor edema (Figure 5A). However, greater than 50% of the melanoma cells were Ki67+ proliferating cells (Figure 5B). The B220+ B cells were numerous with signs of fragmentation (Figure 5C). The Ly6B.2+ neutrophils were spread throughout with moderate to high Ly6B.2 protein expression (Figure 5D). In addition, the extracellular Ly6B.2+ protein expression was moderate in intensity but covered greater than 50% of the tumor mass. Small patches (< 5%) of geographic necrosis were observed.
Figure 5.
Response to anti-PD-1 or combination anti-CTLA-4 with anti-PD-1 immunotherapy Day 16 post-YUMMER1.7 implantation in C57BL/6J mice. Representative histology at low and/or high magnification. Anti-PD-1 (A-D) and combination (E-J) phenotypes includes (A, E) H&E of full biopsy, (B, F) Ki-67+ proliferating cells, (C, G) B220+ B cells, and (D, H) Ly6B.2+ neutrophils. (I) Neutrophil extracellular traps (NETs)-like formation DNA fiber networks (turquoise arrows). (J) Mixture of intra-tumor small and large size B220+ B cells around a vessel.
When anti-CTLA-4 and anti-PD-1 treatment was combined, the tumor mass was predominately immune cells and geographic necrosis (Figure 5E). There was extensive edema and very few melanoma cells (Figure 5E, F). Of those remaining melanoma cells, very few were Ki67+ proliferating cells (Figure 5F). There were numerous B220+ B cells throughout the tumor mass with a mixture of both small and large size cells within the same areas and in clusters around vessels unlike spontaneous regression (Figure 5G, J). The Ly6B.2+ neutrophils expressed high protein levels and were spread throughout the tumor mass with patches of dense areas (Figure 5H). Low to moderate levels of extracellular protein was present throughout the tumor mass. NETs-like formations expressing high levels of Ly6B.2+ protein were present in addition to DNA fiber networks (Figure 5I).
Quantitative Analysis
To determine the magnitude of the differences between the immune populations over time, we quantitated the targets using a quantitative imaging system. In spontaneous regression, the adaptive immune response period (Days 9 – 16) had the highest percentage of B220+ B cells and Ly6B.2+ neutrophils compared to the immunosurveillance period (Days 0 – 6) and the regression interval (Days ≥ 20) (Supplemental Figure 1A-D). Treatment with immunotherapy further enhanced the percentage of B cells and neutrophils (Supplemental Figure 1E, F).
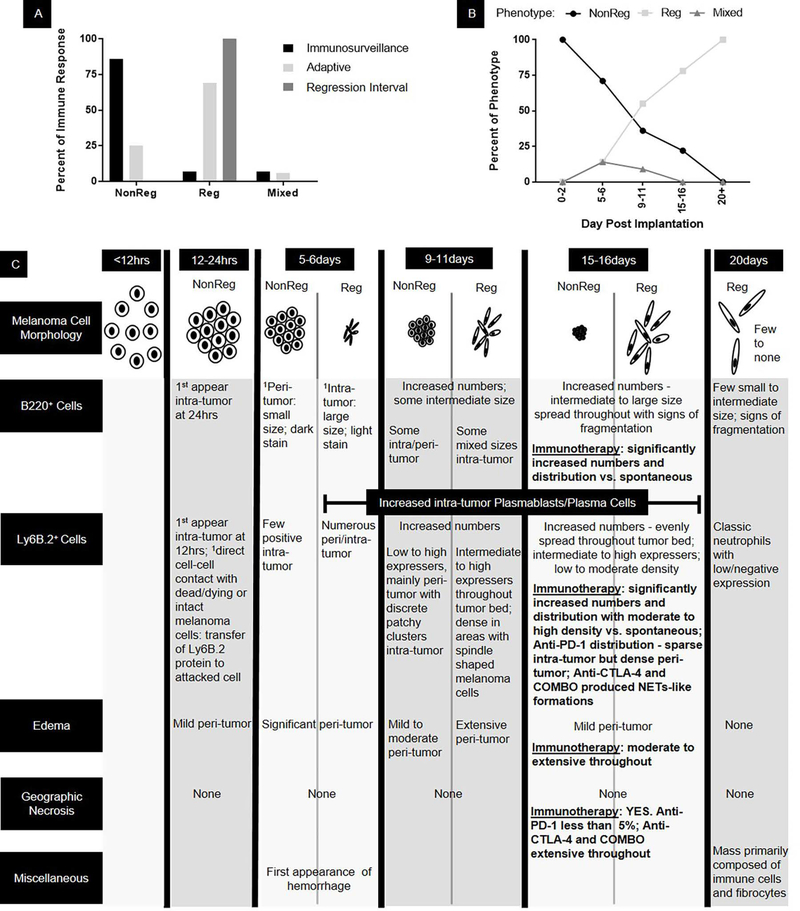
We also found that the highest percentage of nonregression phenotypes was in the immunosurveillance time period (Figure 6A, B). The highest percentages of regression phenotypes were in the adaptive immune response and regression interval time periods. The mixed regression phenotypes were only found in the immunosurveillance and adaptive immune response time periods (Figure 6A, B).
Figure 6.
Summary of the kinetics of regression phenotypes. NonReg = Nonregression, Reg = regression. 1Base characteristics that are carried through all subsequent time points.
DISCUSSION
The purpose of this report was to describe, in detail, histological findings from the YUMMER1.7 in vivo cutaneous metastatic melanoma regression model (Figure 6). At the global level, we focused on tumor regression phenotypes. At the cellular level, we focused on spatial relationships of melanoma cells with B cells and neutrophils since this has not been previously described. We found common themes to the host response to cancer irrespective of the mode of induced regression (i.e. spontaneous; immunotherapy-induced). However, we also found one major differentiator between spontaneous and immunotherapy-induced regression.
The first common theme was that there were three regression phenotypes: (1) nonregression, (2) regression, and (3) mixed regression (Figure 6). In human tumors, regression has been subdivided into two to three phases/stages based on the amount and/or distribution of cancer cells in the tumor mass amongst regression processes such as inflammatory infiltrates and fibrosis (Ribero et al., 2016). The lowest and highest human phases/stages are approximately equivalent to the nonregression and regression phenotypes, respectively. In nonregression tumors, the melanoma cells were epithelioid in shape and tightly packed. In the regression tumors, the melanoma cells were primarily spindle in shape and discohesive. In the mixed regression tumors, there were at least two discrete populations of melanoma cells, one nonregression and one regression, suggesting that the immune response is not always all or none. Identification of these three regression phenotypes provides clues as to the cause of variability in tumor growth within a time period and lack of 100% penetrance of the YUMMER1.7 regression model. These phenotypes suggest that there are in vivo subclones of YUMMER1.7 melanoma cells that are susceptible to the immune system during early stages of tumor growth and others at later stages. They also highlight specific time periods that are optimal for identifying subclones that may potentially become immune escapers. In addition, the existence of these distinct regression phenotypes provides information that could assist in interpretation of data generated from bulk tumor analysis, such as RNA sequencing. Isolating and characterizing subclones from the three regression phenotypes could help to identify new tumor antigens as well as distinct immune responses to them.
The second common theme was that there were two B220+ B cells populations: (1) small size and (2) intermediate to large size. In nonregression tumors/regions, B220+ B cells were primarily small and surrounded the periphery of the tumor. In regression tumors/regions, B220+ B cells were intermediate to large size with a morphology that was consistent with plasmablasts and plasma cells. The B cell numbers and distribution, including plasmablasts and plasma cells, increased over time in spontaneous regression and was enhanced with immunotherapy. In humans, increased numbers and distributions of B cells translates to longer disease-free survival in breast cancer patients and durable responses in metastatic melanoma patients treated with anti-CTLA-4 (Blenman et al., 2018; Seremet et al., 2016). The increased B cell production may also highlight a mechanism by which autoimmunity develops with immunotherapy (Kostine et al., 2017). In autoimmunity, plasmablasts and plasma cells secrete products (cytokine, chemokines, antibodies) that promote destruction of host cells by targeting self-antigens (Tiburzy, Kulkarni, Hauser, Abram, & Manz, 2014). In the context of tumor regression, it is plausible that exposed self-antigens may be broadly targeted, resulting in autoimmunity.
The third common theme was that the Ly6B.2+ neutrophils were in cell-cell contact with dead or dying cells consistent with the morphology of melanoma cells. The cytoplasm of the attacked melanoma cells displayed low to intermediate levels of Ly6B.2 protein. This suggests that Ly6B.2+ neutrophils may have a role in the death of melanoma cells. In the regression tumors/regions, there were dense Ly6B.2+ neutrophils and intermediate to high levels of protein expressed extracellularly. The Ly6B.2 low/negative classic neutrophils present after complete regression suggests that Ly6B.2 may be an activation or functional marker for neutrophils. In the presence of immunotherapy, we found for the first time, NETs-like formations (Papayannopoulos, 2018; Shiogama et al., 2016; Wong et al., 2015). In autoimmune dermatological diseases such as bullous pemphigoid and epidermolysis bullosa acquisita, antibodies are produced against hemidesmosomal proteins BP180/BP200/BP320 and collagen VII self-antigens, respectively (Kasperkiewicz & Zillikens, 2007; Rose et al., 2007). These autoantibodies are deposited along the dermal epidermal junction and incite an inflammatory response that is dominated by granulocytes such as eosinophils and neutrophils. This reaction causes separation of the epidermis from the dermis and formation of blisters (Kasperkiewicz & Zillikens, 2007; Rose et al., 2007). Interestingly, bullous pemphigoid is one of the immune-related adverse reactions associated with immunotherapy (Kaunitz et al., 2017).
The fourth common theme was that at the peak of the adaptive immune response, in the regression tumors, most of the tumor mass were immune cells as indicated by size and morphology. Immune cell fragmentation was common and signals the wrapping up of the immune response (Tixeira et al., 2017). Overall there were signs of cell death for both the immune cells and melanoma cells. Additionally, in the regression tumor at its complete regression stage, the cellular composition and architecture of the remaining mass was reminiscent of the granulation phase of tissue repair.
The most striking difference between the two modes of regression was the presence of geographic necrosis after immunotherapy treatment. Edema was also more pronounced with immunotherapy. Overall, spontaneous regression appears to be a milder but effective immune response to cancer cells than immunotherapy-induced regression (Figure 6). Capturing the mechanisms responsible for the milder response and applying the mechanisms to immunotherapy treatment may increase therapeutic responders and/or reduce or eliminate immune-related adverse reactions. B cells and neutrophils may have a key role in this process.
Supplementary Material
Supplemental Figure 1. Quantitative distribution of B220+ B cells and Ly6B.2+ neutrophils during spontaneous and immunotherapy-induced regression post-YUMMER1.7 implantation in C57BL/6J mice. Spontaneous regression segregated by (A, C) immune response and by (B, D) incremental date range. For (B, D) P-value represents the significance over time and black stars represent significance compared to Day 15-16. (E, F) Comparison of spontaneous and immunotherapy-induced regression Day 15-16 post-implantation. In all panels, N = 4 – 9 mice per immune response/date range and up to 3 tumors per mouse. Each data point = 1 tumor. Grey bars = median. *P<0.05, **P<0.01, ***P<0.001, ****P<0.0001.
SIGNIFICANCE.
As compared to the immunotherapy-induced regression, spontaneous regression appears to be a milder but effective immune response to cancer cells. Capturing the mechanisms responsible for the milder response and applying the mechanisms to immunotherapy treatment may increase drug responders and/or reduce or eliminate immune-related adverse reactions. B cells and neutrophils may have a key role in this process.
ACKNOWLEDGEMENTS
We would like to thank Tian Xu, Yale University Department of Genetics, for his generous gift of the P-YUK-GFP plasmid. This work was supported by National Cancer Institute, Grant/Award Number: P01 CA128814 and R01 CA196660; Melanoma Research Alliance Young Investigator Award; Melanoma Research Foundation; and the Hervey Family Foundation.
REFERENCES
- Amulic B, Cazalet C, Hayes GL, Metzler KD, & Zychlinsky A (2012). Neutrophil function: from mechanisms to disease. Annu Rev Immunol, 30, 459–489. doi: 10.1146/annurev-immunol-020711-074942 [DOI] [PubMed] [Google Scholar]
- Bermejo DA, Amezcua Vesely MC, Khan M, Acosta Rodriguez EV, Montes CL, Merino MC, … Gruppi A (2011). Trypanosoma cruzi infection induces a massive extrafollicular and follicular splenic B-cell response which is a high source of non-parasite-specific antibodies. Immunology, 132(1), 123–133. doi: 10.1111/j.1365-2567.2010.03347.x [DOI] [PMC free article] [PubMed] [Google Scholar]
- Blenman KR, He T-F, Frankel PH, Ruel NH, Schwartz EJ, Krag DN, … Yuan Y (2018). Sentinel lymph node B cells can predict disease-free survival in breast cancer patients. NPJ Breast Cancer, 4(1), 28. [DOI] [PMC free article] [PubMed] [Google Scholar]
- Cerutti A, Puga I, & Magri G (2013). The B cell helper side of neutrophils. J Leukoc Biol, 94(4), 677–682. doi: 10.1189/jlb.1112596 [DOI] [PMC free article] [PubMed] [Google Scholar]
- Chiaruttini G, Mele S, Opzoomer J, Crescioli S, Ilieva KM, Lacy KE, & Karagiannis SN (2017). B cells and the humoral response in melanoma: The overlooked players of the tumor microenvironment. OncoImmunology, 6(4), e1294296. doi: 10.1080/2162402X.2017.1294296 [DOI] [PMC free article] [PubMed] [Google Scholar]
- Corthay A (2014). Does the immune system naturally protect against cancer? Front Immunol, 5, 197. doi: 10.3389/fimmu.2014.00197 [DOI] [PMC free article] [PubMed] [Google Scholar]
- Dissemond J, Weimann TK, Schneider LA, Schneeberger A, Scharffetter-Kochanek K, Goos M, & Wagner SN (2003). Activated neutrophils exert antitumor activity against human melanoma cells: reactive oxygen species-induced mechanisms and their modulation by granulocyte-macrophage-colony-stimulating factor. J Invest Dermatol, 121(4), 936–938. doi: 10.1046/j.1523-1747.2003.12475.x [DOI] [PubMed] [Google Scholar]
- Granot Z, & Jablonska J (2015). Distinct Functions of Neutrophil in Cancer and Its Regulation. Mediators Inflamm, 2015, 701067. doi: 10.1155/2015/701067 [DOI] [PMC free article] [PubMed] [Google Scholar]
- Hardy RR, & Hayakawa K (2001). B cell development pathways. Annu Rev Immunol, 19, 595–621. doi: 10.1146/annurev.immunol.19.1.595 [DOI] [PubMed] [Google Scholar]
- Kasperkiewicz M, & Zillikens D (2007). The pathophysiology of bullous pemphigoid. Clin Rev Allergy Immunol, 33(1–2), 67–77. doi: 10.1007/s12016-007-0030-y [DOI] [PubMed] [Google Scholar]
- Kaunitz GJ, Loss M, Rizvi H, Ravi S, Cuda JD, Bleich KB, … Taube JM (2017). Cutaneous Eruptions in Patients Receiving Immune Checkpoint Blockade: Clinicopathologic Analysis of the Nonlichenoid Histologic Pattern. Am J Surg Pathol, 41(10), 1381–1389. doi: 10.1097/PAS.0000000000000900 [DOI] [PMC free article] [PubMed] [Google Scholar]
- Kostine M, Chiche L, Lazaro E, Halfon P, Charpin C, Arniaud D, … Stavris C (2017). Opportunistic autoimmunity secondary to cancer immunotherapy (OASI): An emerging challenge. Rev Med Interne, 38(8), 513–525. doi: 10.1016/j.revmed.2017.01.004 [DOI] [PubMed] [Google Scholar]
- Lee PY, Wang JX, Parisini E, Dascher CC, & Nigrovic PA (2013). Ly6 family proteins in neutrophil biology. J Leukoc Biol, 94(4), 585–594. doi: 10.1189/jlb.0113014 [DOI] [PubMed] [Google Scholar]
- Li Q, Lao X, Pan Q, Ning N, Yet J, Xu Y, … Chang AE (2011). Adoptive transfer of tumor reactive B cells confers host T-cell immunity and tumor regression. Clin Cancer Res, 17(15), 4987–4995. doi: 10.1158/1078-0432.CCR-11-0207 [DOI] [PMC free article] [PubMed] [Google Scholar]
- Papayannopoulos V (2018). Neutrophil extracellular traps in immunity and disease. Nat Rev Immunol, 18(2), 134–147. doi: 10.1038/nri.2017.105 [DOI] [PubMed] [Google Scholar]
- Ribero S, Moscarella E, Ferrara G, Piana S, Argenziano G, & Longo C (2016). Regression in cutaneous melanoma: a comprehensive review from diagnosis to prognosis. J Eur Acad Dermatol Venereol, 30(12), 2030–2037. doi: 10.1111/jdv.13815 [DOI] [PubMed] [Google Scholar]
- Rosas M, Thomas B, Stacey M, Gordon S, & Taylor PR (2010). The myeloid 7/4-antigen defines recently generated inflammatory macrophages and is synonymous with Ly-6B. J Leukoc Biol, 88(1), 169–180. doi: 10.1189/jlb.0809548 [DOI] [PMC free article] [PubMed] [Google Scholar]
- Rose C, Weyers W, Denisjuk N, Hillen U, Zillikens D, & Shimanovich I (2007). Histopathology of anti-p200 pemphigoid. Am J Dermatopathol, 29(2), 119–124. doi: 10.1097/DAD.0b013e31803326e6 [DOI] [PubMed] [Google Scholar]
- Seremet T, Koch A, Jansen Y, Schreuer M, Wilgenhof S, Del Marmol V, … Neyns B (2016). Molecular and epigenetic features of melanomas and tumor immune microenvironment linked to durable remission to ipilimumab-based immunotherapy in metastatic patients. J Transl Med, 14(1), 232. doi: 10.1186/s12967-016-0990-x [DOI] [PMC free article] [PubMed] [Google Scholar]
- Shiogama K, Onouchi T, Mizutani Y, Sakurai K, Inada K, & Tsutsumi Y (2016). Visualization of Neutrophil Extracellular Traps and Fibrin Meshwork in Human Fibrinopurulent Inflammatory Lesions: I. Light Microscopic Study. Acta Histochem Cytochem, 49(4), 109–116. doi: 10.1267/ahc.16015 [DOI] [PMC free article] [PubMed] [Google Scholar]
- Tiburzy B, Kulkarni U, Hauser AE, Abram M, & Manz RA (2014). Plasma cells in immunopathology: concepts and therapeutic strategies. Semin Immunopathol, 36(3), 277–288. doi: 10.1007/s00281-014-0426-8 [DOI] [PubMed] [Google Scholar]
- Tixeira R, Caruso S, Paone S, Baxter AA, Atkin-Smith GK, Hulett MD, & Poon IK (2017). Defining the morphologic features and products of cell disassembly during apoptosis. Apoptosis, 22(3), 475–477. doi: 10.1007/s10495-017-1345-7 [DOI] [PubMed] [Google Scholar]
- Wang J, Perry CJ, Meeth K, Thakral D, Damsky W, Micevic G, … Bosenberg M (2017). UV-induced somatic mutations elicit a functional T cell response in the YUMMER1.7 mouse melanoma model. Pigment Cell Melanoma Res, 30(4), 428–435. doi: 10.1111/pcmr.12591 [DOI] [PMC free article] [PubMed] [Google Scholar]
- Wong SL, Demers M, Martinod K, Gallant M, Wang Y, Goldfine AB, … Wagner DD (2015). Diabetes primes neutrophils to undergo NETosis, which impairs wound healing. Nat Med, 21(7), 815–819. doi: 10.1038/nm.3887 [DOI] [PMC free article] [PubMed] [Google Scholar]
- Yan J, Kloecker G, Fleming C, Bousamra M 2nd, Hansen R, Hu X, … Clark GJ (2014). Human polymorphonuclear neutrophils specifically recognize and kill cancerous cells. OncoImmunology, 3(7), e950163. doi: 10.4161/15384101.2014.950163 [DOI] [PMC free article] [PubMed] [Google Scholar]
- Zurac S, Negroiu G, Petrescu S, Andrei R, Tebeica T, Popp C, … Staniceanu F (2012). Spectrum of morphologic alterations of regression in cutaneous melanoma--potential for improving disease prognosis. Rom J Intern Med, 50(2), 145–153. [PubMed] [Google Scholar]
Associated Data
This section collects any data citations, data availability statements, or supplementary materials included in this article.
Supplementary Materials
Supplemental Figure 1. Quantitative distribution of B220+ B cells and Ly6B.2+ neutrophils during spontaneous and immunotherapy-induced regression post-YUMMER1.7 implantation in C57BL/6J mice. Spontaneous regression segregated by (A, C) immune response and by (B, D) incremental date range. For (B, D) P-value represents the significance over time and black stars represent significance compared to Day 15-16. (E, F) Comparison of spontaneous and immunotherapy-induced regression Day 15-16 post-implantation. In all panels, N = 4 – 9 mice per immune response/date range and up to 3 tumors per mouse. Each data point = 1 tumor. Grey bars = median. *P<0.05, **P<0.01, ***P<0.001, ****P<0.0001.


