

Abstract
Cancer tissues contain small populations of highly tumorigenic cells termed cancer stem cells (CSCs). Immortalized cell lines containing CSCs are valuable and powerful experimental tools for research into the characteristics of these stem cells. We previously reported that the hepatocellular carcinoma cell line Li‐7 includes abundant CD13+ CD166− CSCs; however, the number of these cells decreases after long‐term culture as a result of differentiation to non‐CSC populations. To ensure consistent and reproducible results in experiments using Li‐7 cells, it is important that the CSC population is maintained stably regardless of culture duration and passage. In the present study, we found that a commercially available culture medium for maintenance of embryonic stem cells and induced pluripotent stem cells, mTeSR1, effectively prevented spontaneous differentiation by CD13+ CD166− cells to CD13− CD166+ cells and therefore maintained the CSC population in Li‐7 cell cultures. CD13+ CD166− CSCs maintained using this culture medium retained high tumorigenicity after transplantation into mice; they also showed the ability to differentiate in vitro into non‐CSC populations in RPMI‐1640 with 10% FBS medium. We analyzed gene expression profiles of CSC and non‐CSC populations in Li‐7 cultures using an RNA sequencing method. Genes such as FGFR, NOTCH1, and JAG1, that are associated with tumorigenicity and stemness, were upregulated in the CSC population. Our results suggest that CSCs can be maintained in immortalized cancer cell lines cultured over an extended period using a medium developed for culture of embryonic/induced pluripotent stem cells.
Keywords: CD13, CD166, cell culture, mTeSR1, tumorigenicity
Abbreviations
- ALDH
aldehyde dehydrogenase
- CSC
cancer stem cell
- EpCAM
epithelial cell adhesion molecule
- ES
embryonic stem
- FGF
fibroblast growth factor
- FGFR
fibroblast growth factor receptor
- HCC
hepatocellular carcinoma
- iPS
induced pluripotent stem
- PE
phycoerythrin
1. INTRODUCTION
Despite recent advances in cancer therapies, many cancers still show a high rate of morbidity due to their rapid progression, acquisition of tolerance against chemotherapy or radiotherapy, distant metastasis, and recurrence. The development of the concept of CSCs over the past 2 decades has helped to explain the initiation of cancer and the heterogeneity of cells in cancer tissues.1, 2 Cancer stem cells are considered to be derived from physiological stem cells and thus have characteristics of self‐renewal and pluripotency. In general, CSCs are resistant to conventional chemotherapy and radiotherapy and cause progression, metastasis, and recurrence of cancer. To overcome these problems, therapies that target CSCs are needed.
Cancer stem cells can be identified by flow cytometric analysis using specific markers.3 For example, CD133, CD90, CD13, CD44, and EpCAM (also known as CD326) have been reported as cell surface markers for liver CSCs.4, 5, 6, 7 Other functional properties of CSCs, such as high expression of drug efflux‐related proteins,8 high ALDH enzymatic activity,9 low levels of intracellular reactive oxygen species,6 and spheroid‐forming tendency in 3‐D culture,10 have also been utilized to identify liver CSCs.
We previously reported that the human HCC cell line Li‐7 includes a small number of CD13+CD166− CSCs.11 A unique characteristic of the Li‐7 cell line is the heterogeneity in cell populations due to the retention of CSCs and differentiated non‐CSCs. However, we also observed that the Li‐7 cell line loses its tumorigenicity after long‐term culture, presumably due to the dominant expansion of non‐CSCs that differentiate from CSCs. A similar reduction in tumorigenicity of Li‐7 cells was reported by another laboratory.12 In order to carry out efficient and reproducible research into the mechanisms of tumorigenicity and to develop therapies targeting CSCs, the stable in vitro maintenance of CD13+CD166− CSCs in Li‐7 cell cultures is necessary.
It is difficult to maintain CSCs efficiently in vitro because they form a very small proportion of cells in primary cancer tissues, are prone to differentiation in culture, and require a specific microenvironment for stemness. Various attempts at maintaining CSCs in vitro have been reported. For example, a cell culture using a serum‐free medium succeeded in generating a highly tumorigenic colon CSC‐like cell line from primary human colon cancer tissues following serial transplantation into immunodeficient mice.13 The retroviral transduction of defined factors such as OCT3/4, SOX2, and KLF4 into cancer cells has also been reported as another route for inducing a CSC‐like cell line.14
The present study was initiated to identify long‐term culture conditions in which the population of CSCs in the Li‐7 cell line was maintained. We found that a commercially available culture medium developed for ES cells and iPS cells can effectively maintain CD13+CD166− CSCs in Li‐7 cell cultures.
2. MATERIALS AND METHODS
2.1. Cell culture
The human HCC cell line Li‐7 was provided by the RIKEN BioResource Research Center (Tsukuba, Japan) through the National Bio‐Resource Project of the Japanese Ministry of Education, Culture, Sports, Science, and Technology/Japan Agency for Medical Research and Development. Li‐7 cells were cultured in RPMI‐1640 (Gibco, Thermo Fisher Scientific, Waltham, MA, USA) supplemented with 10% FBS. To maintain the high tumorigenicity of this cell line, Li‐7 cells were passaged and cultured overnight in RPMI‐1640 supplemented with 10% FBS. Next day, almost all cells were attached to the culture dish; they were washed once with PBS and then cultured in mTeSR1 medium, which was developed for maintenance of ES/iPS cells (STEMCELL Technologies, Vancouver, BC, Canada), StemFit AK02N (Ajinomoto, Tokyo, Japan), Essential 8 (Gibco, Thermo Fisher Scientific), or Stem Partner (Kyokuto Pharmaceutical Industrial Co., Tokyo, Japan). Cells were incubated at 37°C with a 5% partial pressure of CO2 in a humidified atmosphere. Cells were passaged twice per week, usually at approximately 80% confluency. Many repetitions (more than 5 times) were carried out for the experiment in which the medium was changed from RPMI‐1640 + 10% FBS to mTeSR1.
2.2. Flow cytometric analysis and cell sorting
The following Abs were used in this study: allophycocyanin‐conjugated anti‐human CD13 (eBioscience, Thermo Fisher Scientific); PE‐conjugated anti‐human CD166, PE‐cyanine‐7‐conjugated anti‐human EpCAM and HLA‐ABC (BD Biosciences, Franklin Lakes, NJ, USA); and PE‐Vio770‐conjugated anti‐human CD166 and allophycocyanin‐conjugated anti‐human CD133/2 (Miltenyi Biotec, Bergisch Gladbach, Germany). The cells were harvested with trypsin and EDTA and then stained with fluorescent dye‐conjugated Abs in staining medium (PBS supplemented with 5% FBS) at 4°C for 20 minutes. The cells were washed once with staining medium and resuspended in staining medium with 7‐AAD (BD Biosciences) to exclude dead cells. Aggregated cells were excluded from analyses using an FSC‐W/FSC‐H plot. Isotype controls were used to determine negative cell populations. In relation to cell sorting, analyses after sorting were performed to confirm that the purity of sorted cells was more than 95%. FACSVerse and FACSAria SORP (both BD Biosciences) were used for analysis and cell sorting, respectively.
2.3. ALDEFLUOR assay
We used an ALDEFLUOR kit (STEMCELL Technologies) to detect intracellular ALDH enzymatic activity. The assay was carried out according to the manufacturer's instructions. The activated reagent is converted by intracellular ALDH into the fluorescent product BODIPY‐aminoacetate, which is detectable by flow cytometric analysis. As a negative control, cells were treated with 15 μmol/L diethylaminobenzaldehyde. Cells were incubated for 20 minutes at 37°C in the presence of the above reagents and were stained with fluorescent dye‐conjugated Abs and 7‐AAD in the ALDEFLUOR buffer (STEMCELL Technologies). FACSAria SORP (BD Biosciences) was used for analysis.
2.4. Spheroid formation assay
Cells sorted by flow cytometry were seeded at 4 × 10³ cells per well in a 96‐well NanoCulture plate‐MS (ORGANOGENIX, Kawasaki, Japan) with 100 μL NanoCulture medium‐R type supplemented with 10% FBS‐R (ORGANOGENIX). Half of the medium was replaced with fresh medium twice per week. The number of spheroids with a diameter greater than 100 μm was counted on day 14 using a microscope equipped with a digital camera DP25 (Olympus, Tokyo, Japan).
2.5. Animal experiments
Four‐week‐old female BALB/c nu/nu mice were purchased from CLEA Japan (Tokyo, Japan). A 200‐μL suspension of cells in RPMI‐1640 was injected s.c. The mice were killed when apparent s.c. tumors were observed. All animal experiments were approved by the Institutional Animal Care and Use Committee of RIKEN Tsukuba Branch.
2.6. Histological and flow cytometric analyses of tumors formed in mice
For histological analysis, extracted tumors were fixed in 4% paraformaldehyde and then paraffin embedded. Sections (3 μm) were cut and stained using H&E and analyzed under a microscope equipped with a DP25 digital camera (Olympus).
For the flow cytometric analysis, a tumor tissue sample approximately 8 mm square was cut into a minced state and then suspended in RPMI‐1640 supplemented with 1 mg/mL collagenase type I (Fujifilm Wako, Osaka, Japan); the suspension was incubated for 30 minutes at 37°C. The suspension was filtered through a 40‐μm cell strainer (BD Biosciences), and the cells were then stained with the Abs described above. Mouse cells were excluded from the analysis as they were human HLA‐ABC‐negative. FACSVerse (BD Biosciences) was used for analysis.
2.7. RNA sequencing
Total RNAs were extracted from cells sorted by flow cytometry. RNA sequencing was carried out by Hokkaido System Science (Sapporo, Japan) using an Illumina HiSeq 2500 platform (Illumina, San Diego, CA, USA) with a 100‐bp read length. Image output data from the sequencer were transformed into raw sequence data by base calling and stored in FastQ format. Data were mapped to the human genome using TopHat (http://ccb.jhu.edu/software/tophat/index.shtml) and quantified using Cufflinks (http://cole-trapnell-lab.github.io/cufflinks/).
2.8. Statistics
The data were first analyzed for homogeneity using an F test; subsequently, Welch's t tests were used to identify statistically significant differences. A value of P < 0.05 was considered significant.
3. RESULTS
3.1. Identification of a culture medium for maintaining the CSC population of Li‐7 cells
The HCC cell line Li‐7 from the RIKEN Cell Bank (Japan) contained a population of approximately 40% of CD13+CD166− CSCs at the beginning of the culture (Figure 1A).11 This population almost disappeared after continuous culture in RPMI‐1640 + 10% FBS (hereafter RPMI + FBS) for 1 month through several passages (Figure 1A,B).
Figure 1.
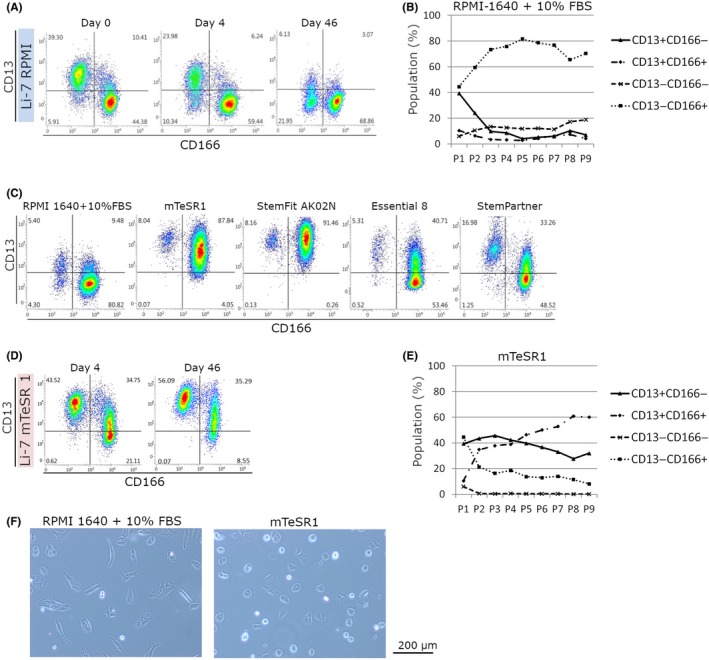
Characteristics of Li‐7 cells cultured in RPMI‐1640 or mTeSR1. A, Flow cytometric analysis of CD13 and CD166 cells in cultures using RPMI‐1640 + 10% FBS. Li‐7 cells were obtained from a cell repository and are shown as day 0. B, The percentages of CD13+ CD166−, CD13+ CD166+, CD13− CD166−, and CD13− CD166+ cells in cultures using RPMI‐1640 + 10% FBS at every passage. Results shown are representative of 3 independent experiments. C, Flow cytometric analysis of cells cultured in RPMI‐1640 + 10% FBS or 4 other media for embryonic stem cells/induced pluripotent stem cells (mTeSR1, StemFit AK02N, Essential 8, and StemPartner). Cells were cultured for 15 d and then subjected to analysis. D, Flow cytometric analysis of CD13 and CD166 cells in cultures using in mTeSR1, on days 4 and 46. E, The percentages of CD13+ CD166−, CD13+ CD166+, CD13− CD166−, and CD13− CD166+ cells in cultures using mTeSR1 at every passage. Results shown are representative of 3 independent experiments. F, Morphologies of cells in cultures using RPMI‐1640 + 10% FBS or mTeSR1. Magnification, ×100
In order to maintain the CD13+CD166− CSC population, we tested commercially available media that have been developed for human ES cells and iPS cells.15, 16, 17, 18 These media consist of basal medium and additional factors, such as basic FGF, insulin, and transferrin, and also contain other factors that are essential for cell survival and proliferation under serum‐free conditions. Our analyses indicated that some of these media could effectively increase the expression of CD13 (Figure 1C). We selected the mTeSR1 medium for further experiments as the constituent ingredients of this medium have been fully disclosed. Moreover, the improvement in cell viability was greater after replacing RPMI + FBS with mTeSR1 than with other media. After 4 days of culture in mTeSR1, a high proportion of CD13+CD166− cells was observed and this did not change even after continuous culture for more than 1 month (Figure 1D,E). The majority of cells cultured with RPMI + FBS were spindle‐shaped fibroblast‐like cells, whereas those cultured with mTeSR1 were round (Figure 1F).
3.2. Characterization of CD13+CD166− CSCs cultured in mTeSR1
We analyzed expression of the CSC markers EpCAM and CD133 that have been reported in HCC. CD13+ cells expressing EpCAM and CD133 increased after culture in mTeSR1 (Figure 2A), and the majority of cells expressing both EpCAM and CD133 were present in CD13+CD166− cell populations (Figure 2B). In addition, the stem cell surface markers SSEA‐4, TRA‐1‐60, and TRA‐1‐81 showed high expression in CD13+CD166− cells cultured in mTeSR1 (Figure 2C).
Figure 2.
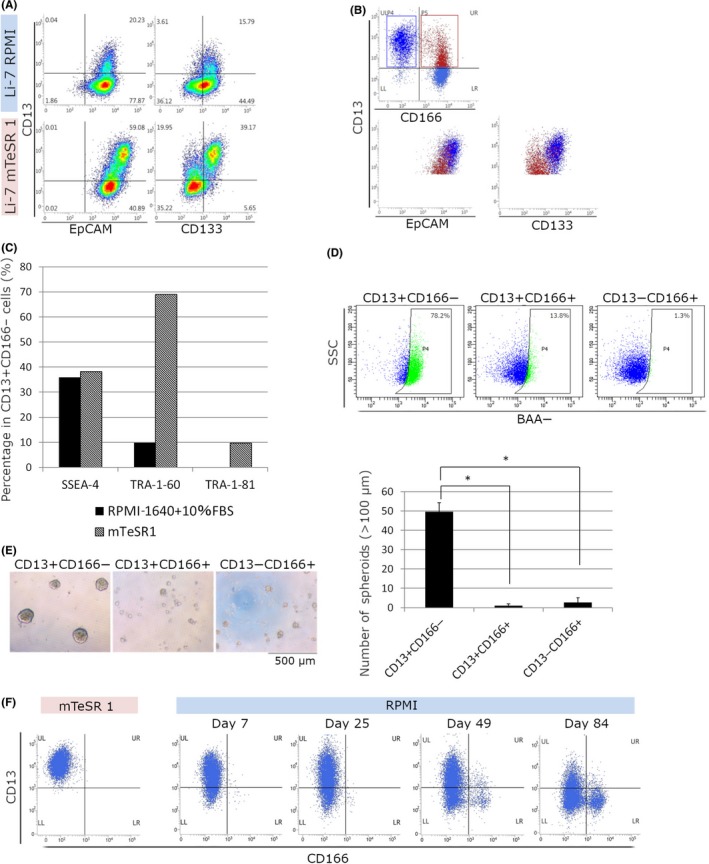
Characterization of CD13+ CD166− cells cultured in mTeSR1. A,B, Flow cytometric analysis of cells cultured in RPMI‐1640 + 10% FBS (Li‐7 RPMI) or mTeSR1 (Li‐7 mTeSR1) for 6 wk; the cells were stained using CD13, CD166, epithelial cell adhesion molecule (EpCAM), and CD133. B, Population analysis of cells cultured in mTeSR1. CD13+ CD166− cells are shown as dark blue dots and CD13+ CD166+ cells are shown as red dots. C, Flow cytometric analysis with SSEA‐4, TRA‐1‐60, and TRA‐1‐81. The percentages of SSEA‐4‐, TRA‐1‐60‐, and TRA‐1‐81‐positive cells in CD13+ CD166− cells cultured in mTeSR1 or RPMI‐1640 + 10% FBS for 15 wk are shown. D, Flow cytometric analysis of intracellular aldehyde dehydrogenase enzymatic activity of CD13+ CD166−, CD13+ CD166+, and CD13− CD166+ cell fractions in cultures using mTeSR1. Results shown are representative of 2 independent experiments. E, Spheroid formation assay. CD13+ CD166−, CD13+ CD166+, and CD13− CD166+ cell fractions were sorted in cultures using mTeSR1. Magnification, ×40. Values are mean ± SD of 3 wells. Results shown are representative of 2 independent experiments. F, Phenotypic changes in Li‐7 cells after transfer to RPMI‐1640 + 10% FBS. CD13+ CD166− cells were sorted from cultures using mTeSR1. Cells cultured in mTeSR1 2 months after sorting (left, mTeSR1) and cells transfer to RPMI‐1640 + 10% FBS (right, RPMI) for 84 d are shown. *P <0.05. BAA‐, BODIPY‐aminoacetate; SSC, side scatter
Next, ALDH enzymatic activity was assessed using the ALDEFLUOR assay together with flow cytometric analysis using CD13 and CD166. CD13+CD166− cells cultured in mTeSR1 showed the highest ALDH activity (Figure 2D). An analysis of spheroid formation ability, an indicator of tumorigenicity, showed that CD13+CD166− cells formed more spheroids than other cell fractions (Figure 2E).
We then investigated the differentiation of CD13+CD166− cells cultured in mTeSR1 using CD13+CD166− cells sorted by flow cytometry. The cells retained the same phenotype for 2 months (Figure 2F). These CD13+CD166− cells were then cultured in RPMI + FBS. As expected, the numbers of CD13− cells and CD166+ cells gradually increased and CD13+ CD166− cells markedly decreased after 84 days of culture in RPMI + FBS (Figure 2F). This result indicates that CD13+CD166− cells cultured for an extended period in mTeSR1 still possessed the potential to differentiate into mature cells (non‐CSC).
The in vivo tumorigenicity of cultured cells was examined by transplantation into immunodeficient mice. For Li‐7 cells cultured in RPMI + FBS, transplantation of ≥2 × 10⁶ cells resulted in tumor formation after 8 weeks (Table 1). In contrast, transplantation of 2 × 10⁵ Li‐7 cells cultured in mTeSR1 resulted in tumor formation as early as 2 weeks. Analysis of transplantation of 4 cell populations sorted by flow cytometry (1 × 10⁶ cells of each fraction), CD166− or CD166+ cells cultured in RPMI + FBS (Figure 1A, day 46), and CD13+CD166− or CD166+ cells cultured in mTeSR1 (Figure 1D, day 46), showed that only the CD13+CD166− cell population cultured in mTeSR1 could form s.c. tumors (Table 1).
Table 1.
Tumor formation assay in immunodeficient mice
| Culture condition | Injected cells | (Number) | 2w | 4w | 6w | 8w | 12w |
|---|---|---|---|---|---|---|---|
| RPMI‐1640 + 10% FBS | Bulk | (1 × 10⁶) | 0/4 | 0/4 | 0/4 | 0/4 | – |
| (2 × 10⁶) | 0/4 | 0/4 | 0/4 | 1/4 | – | ||
| (5 × 10⁶) | 0/4 | 0/4 | 0/4 | 1/4 | − | ||
| CD166− | (1 × 10⁶) | 0/2 | 0/2 | 0/2 | 0/2 | 0/2 | |
| CD166+ | (1 × 10⁶) | 0/2 | 0/2 | 0/2 | 0/2 | 0/2 | |
| mTeSR1 | Bulk | (2 × 10⁵) | 2/4 | 4/4 | − | − | − |
| (5 × 10⁵) | 4/4 | − | − | − | − | ||
| CD13+CD166− | (1 × 10⁶) | 0/2 | 1/2 | 2/2 | − | − | |
| CD166+ | (1 × 10⁶) | 0/1 | 0/1 | 0/1 | 0/1 | 0/1 |
Bulk Li‐7 cells and cells sorted by flow cytometry from cultures using RPMI‐1640 + 10% FBS or mTeSR1 were transplanted s.c. Tumor formation was assessed at 2, 4, 6, 8, and 12 weeks after transplantation. Results are presented as the number of mice with tumors/total number of transplanted mice. ‐, sacrificed.
3.3. Histological and flow cytometric analyses of tumors derived from cells cultured in mTeSR1
Li‐7 cells (5 × 10⁶) cultured in RPMI + FBS or mTeSR1 (Figure 1A, day 46 and Figure 1D, day 46, respectively) were transplanted s.c. into immunodeficient mice. Tumor tissues formed in the mice after transplantation were harvested, fixed in formalin, paraffin‐embedded, and thin sections were stained with H&E (Figure 3A). The tumors derived from cells cultured in either RPMI + FBS or mTeSR1 were similar and consisted of a mixture of tissue with a solid and pseudoglandular appearance.
Figure 3.
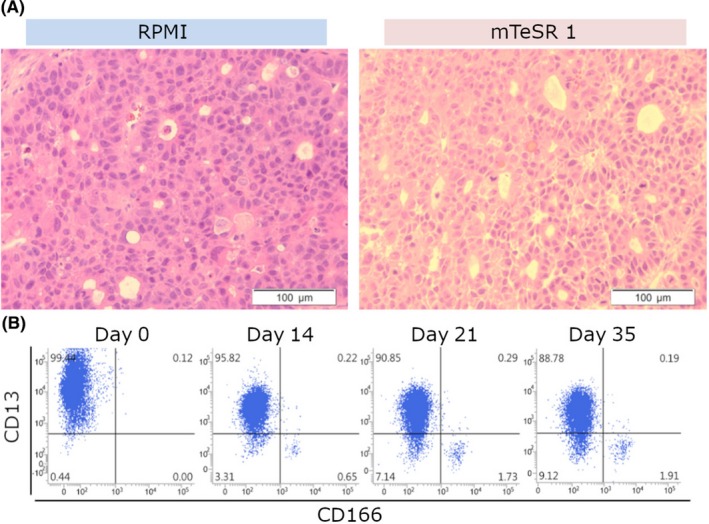
Characterization of tumors formed in immunodeficient mice. A, The histology of tumors formed in mice after transplantation of cells cultured in RPMI‐1640 + 10% FBS (RPMI) or mTeSR1. Tumor sections were stained with H&E. Magnification, ×200. B, Flow cytometric analysis using CD13 and CD166. Tumor cells derived from cells cultured in mTeSR1 were then cultured in RPMI‐1640 + 10% FBS for 35 d. Results shown are representative of 3 independent experiments
Tumor cells derived from cells cultured in mTeSR1 were then cultured in RPMI + FBS (Figure 3B). The number of CD166+ cells gradually increased, as found for the culture shown in Figure 2F, indicating that the tumor cells formed in mice had the potential to differentiate to mature cells (non‐CSC) in the in vitro culture system.
3.4. RNA sequence analysis
To identify the genes associated with the tumorigenicity of Li‐7 cells, we undertook RNA sequence analyses in 4 cell fractions: CD13+CD166− cells cultured in mTeSR1 for 9 weeks; and CD13+CD166−, CD13−CD166−, and CD13−CD166+ cells cultured in RPMI + FBS for 3 weeks. Figure 4A,B shows the number of upregulated and downregulated genes in the CD13+CD166− cell fraction cultured in mTeSR1 compared to the other 3 fractions (CD13+CD166−, CD13−CD166−, and CD13−CD166+ cells cultured in RPMI + FBS). CD13+CD166− cells cultured in mTeSR1 had 24 upregulated genes and 25 downregulated genes compared to the other fractions. Among these genes, we focused on FGFRs because this signaling pathway is known to be important for maintenance of ES/iPS cells. FGFR2, FGFR3, and FGFR4 and their downstream genes (EGR1, FOS, FOSB, JUN, and ETV4) were upregulated in the CD13+ fraction; these genes showed smaller changes in expression in the CD13− fraction (Figure 4C). In addition, NOTCH1, JAG1, and BMP2, which are related to normal stem cell signaling, were also upregulated in CD13+CD166− cells cultured in mTeSR1 (Figure 4D).
Figure 4.
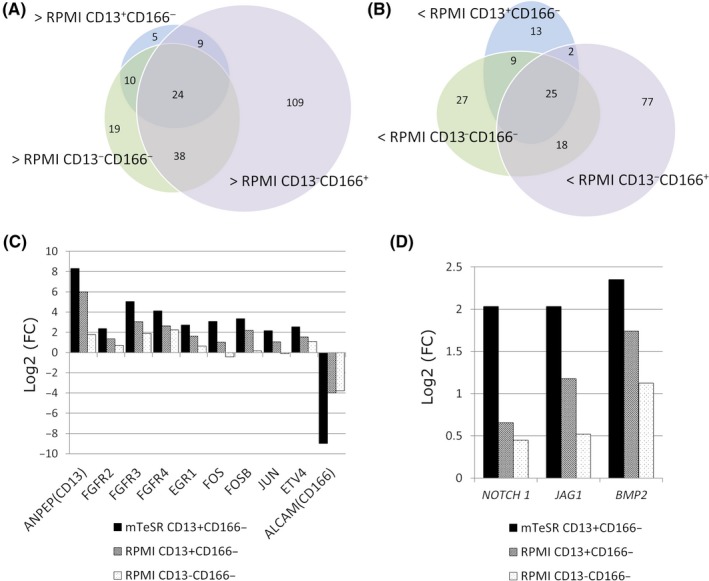
RNA sequence analysis. A,B, The number of genes upregulated (A) and downregulated (B) in CD13+ CD166− cells cultured in mTeSR1 compared to CD13+ CD166−, CD13− CD166−, or CD13− CD166+ cells cultured in RPMI‐1640 + 10% FBS. C, Expression levels of genes encoding fibroblast growth factor receptors (FGFRs) and their downstream transcriptional factors. Expression levels are compared with the CD13− CD166+ cells showing the lowest tumorigenicity of cells cultured in RPMI‐1640 + 10% FBS. Results from ANPEP(CD13) and ALCAM(CD166) are also shown as positive and negative controls, respectively. D, Results of RNA sequence analysis for NOTCH1,JAG1, and BMP2. Expression levels are compared with CD13− CD166+ cells showing lowest tumorigenicity of cells cultured in RPMI‐1640 + 10% FBS. FC, fold change
4. DISCUSSION
The decrease in the numbers of CSCs during in vitro culture is a problem for research utilizing the Li‐7 cell line. In the present study, we found that commercially available serum‐free media devised to maintain ES/iPS cells were able to maintain CD13+CD166− CSCs in the Li‐7 cell line. As the constituent ingredients of mTeSR1 have been disclosed and because cell viability was greater in mTeSR1 than in other media, we selected it for analyses of the maintenance of CSCs in Li‐7. CD13+CD166− cells cultured in mTeSR1 showed a similar level of tumorigenicity after transplantation into mice as cells cultured in RPMI + FBS; they also showed similar ALDH activity, spheroid formation, and differentiation into CD13−CD166+ cells. In addition, xenografted tumors from both cell cultures induced tumors with similar histopathological appearances. These results indicated that culture in mTeSR1 medium did not alter the major phenotypes of the original CSCs of the Li‐7 cell line. To the best of our knowledge, this is the first report to show that switching from a serum‐based medium to a serum‐free medium for the culture of ES/iPS cells can efficiently maintain CSCs in a cancer cell line.
How does mTeSR1 maintain CSCs? Of note, the addition of 1% FBS to mTeSR1 resulted in the failure to maintain CSCs, suggesting that FBS includes factor(s) that promote differentiation to non‐CSCs (Figure S1). However, the absence of FBS in cultures using RPMI did not significantly improve the maintenance of CSCs (Figure S2). Taken together, removal of FBS from the culture medium (serum‐free condition) appears to be a pivotal factor but to be insufficient for maintenance of CSCs.
The fact that the optimal conditions for maintaining CSCs were at least partly similar to those for ES/iPS cells raises the question of whether the gene phenotypes of Li‐7 CSCs are similar to those of ES/iPS cells. The CSC population of Li‐7 cells cultured in mTeSR1 showed high expression of pluripotent stem cell markers such as SSEA‐4, TRA‐1‐60, and TRA‐1‐8119, 20 and of the signaling genes found in normal stem cells such as NOTCH1, JAG1, and BMP2.21, 22, 23 In addition, genes related to the FGF signaling pathway were upregulated in the CSC population cultured in mTeSR1. It is well known that the FGF signaling pathway is essential for maintaining human ES/iPS cells, and the culture media for ES/iPS cells (including mTeSR1) contain basic FGF.24 The FGF signaling pathway might be important for the maintenance of CSCs. However, the addition of basic FGF to cell cultures using RPMI did not significantly increase the numbers of CD13+ cells (Figure S2), strongly indicating that other factors must be involved. The mechanism for maintenance of ES/iPS cells might have aspects in common, at least in part, with that for CSCs. Based on these results, we speculate that use of culture media designed for ES/iPS cells could be a desirable approach to maintaining CSCs, not only for HCC but also for other types of cancer cells.
Li‐7 is a valuable HCC cell line as it contains a CSC population that can be exploited for a range of experimental investigations. We previously reported that culture of Li‐7 cells in conventional culture medium (RPMI + FBS) resulted in the loss of the CSC population accompanied by changes in cell phenotypes and loss of tumorigenicity.11 These results were confirmed here. Human cancer cell lines containing CSCs are very rare, and it is unclear how Li‐7 was generated as a cell line containing CSCs. The Li‐7 cell line was initially maintained as a tumor tissue by serial transplantation into immunodeficient mice, and finally derived as an in vitro cultured cell line from tumor cells formed in a mouse.25 We speculate that CSCs might have been retained during the maintenance as a tumor tissue; the derived in vitro cultured cell line was deposited in a cell repository after short‐term culture. If deposition had occurred after long‐term culture, it is likely that the CSC population of Li‐7 would have disappeared. Although there are many types of human cancer cell lines in cell repositories around the world, the majority of these lines were subjected to long‐term culture in vitro before deposition. If CSCs are prone to differentiate into mature cells (non‐CSCs) in conventional serum‐based culture media, it is likely that cancer cell lines containing CSCs will be very rare.
In future work, we shall continue to explore different culture conditions to identify the optimal method for maintenance of CSCs and shall also analyze the functions of genes identified here in the RNA sequence analysis in order to determine the mechanisms of tumorigenicity and to identify an effective regulatory strategy against CSCs.
CONFLICT OF INTEREST
The authors have no conflict of interest.
Supporting information
ACKNOWLEDGMENTS
This work was supported by a grant from the Ministry of Education, Culture, Sports, Science, and Technology and also by a grant‐in‐aid of Japan Society for the Promotion of Science (KAKENHI, Grant No. 15K19312 to N.H.). We would like to thank Dr. S. Suzuki for his technical assistance regarding RNA sequence analysis, and all members of the Cell Engineering Division of RIKEN BioResource Research Center, especially Dr. M. Noguchi, Mr. J. Inoue, and Y. Seyama for their secretarial and technical assistance.
Sato Y, Yamada T, Hiroyama T, et al. A robust culture method for maintaining tumorigenic cancer stem cells in the hepatocellular carcinoma cell line Li‐7. Cancer Sci. 2019;110:1644‐1652. 10.1111/cas.13978
Funding information
Ministry of Education, Culture, Sports, Science, and Technology of Japan
REFERENCES
- 1. Bonnet D, Dick J. Human acute myeloid leukemia is organized as a hierarchy that originates from a primitive hematopoietic cell. Nat Med. 1997;3:730‐737. [DOI] [PubMed] [Google Scholar]
- 2. Singh AK, Arya RK, Maheshwari S, et al. Tumor heterogeneity and cancer stem cell paradigm: updates in concept, controversies and clinical relevance. Int J Cancer. 2015;136:1991‐2000. [DOI] [PubMed] [Google Scholar]
- 3. Park CY, Tseng D, Weissman IL. Cancer stem cell‐directed therapies: recent data from the laboratory and clinic. Mol Ther. 2009;17:219‐230. [DOI] [PMC free article] [PubMed] [Google Scholar]
- 4. Ma S, Chan KW, Hu L, et al. Identification and characterization of tumorigenic liver cancer stem/progenitor cells. Gastroenterology. 2007;132:2542‐2556. [DOI] [PubMed] [Google Scholar]
- 5. Yang ZF, Ho DW, Ng MN, et al. Significance of CD90 + cancer stem cells in human liver cancer. Cancer Cell. 2008;13:153‐166. [DOI] [PubMed] [Google Scholar]
- 6. Haraguchi N, Ishii H, Mimori K, et al. CD13 is a therapeutic target in human liver cancer stem cells. J Clin Invest. 2010;120:3326‐3339. [DOI] [PMC free article] [PubMed] [Google Scholar]
- 7. Yamashita T, Ji J, Budhu A, et al. EpCAM‐positive hepatocellular carcinoma cells are tumor‐initiating cells with stem/progenitor cell features. Gastroenterology. 2009;136:1012‐1024. [DOI] [PMC free article] [PubMed] [Google Scholar]
- 8. Haraguchi N, Utsunomiya T, Inoue H, et al. Characterization of a side population of cancer cells from human gastrointestinal system. Stem Cells. 2006;24:506‐513. [DOI] [PubMed] [Google Scholar]
- 9. Ma S, Chan KW, Lee TK, et al. Aldehyde dehydrogenase discriminates the CD133 liver cancer stem cell populations. Mol Can Res. 2008;6:1146‐1153. [DOI] [PubMed] [Google Scholar]
- 10. Cao L, Zhou Y, Zhai B, et al. Sphere‐forming cell subpopulations with cancer stem cell properties in human hepatoma cell lines. BMC Gastroenterol. 2011;11:71. [DOI] [PMC free article] [PubMed] [Google Scholar]
- 11. Yamada T, Abei M, Danjoh I, et al. Identification of a unique hepatocellular carcinoma line, Li‐7, with CD13(+) cancer stem cells hierarchy and population change upon its differentiation during culture and effects of sorafenib. BMC Cancer. 2015;15:260. [DOI] [PMC free article] [PubMed] [Google Scholar]
- 12. Fujita K, Iwama H, Sakamoto T, et al. Galectin‐9 suppresses the growth of hepatocellular carcinoma via apoptosis in vitro and in vivo. Int J Oncol. 2015;46:2419‐2430. [DOI] [PubMed] [Google Scholar]
- 13. Kobayashi S, Yamada‐Okabe H, Suzuki M, et al. LGR5‐positive colon cancer stem cells interconvert with drug‐resistant LGR5‐negative cells and are capable of tumor reconstitution. Stem Cells. 2012;30:2631‐2644. [DOI] [PubMed] [Google Scholar]
- 14. Oshima N, Yamada Y, Nagayama S, et al. Induction of cancer stem cell properties in colon cancer cells by defined factors. PLoS One. 2014;9:e101735. [DOI] [PMC free article] [PubMed] [Google Scholar]
- 15. Ludwig TE, Bergendahl V, Levenstein ME, Yu J, Probasco MD, Thomson JA. Feeder‐independent culture of human embryonic stem cells. Nat Methods. 2006;3:637‐646. [DOI] [PubMed] [Google Scholar]
- 16. Nakagawa M, Taniguchi Y, Senda S, et al. A novel efficient feeder‐free culture system for the derivation of human induced pluripotent stem cells. Sci Rep. 2014;4:3594. [DOI] [PMC free article] [PubMed] [Google Scholar]
- 17. Chen G, Gulbranson DR, Hou Z, et al. Chemically defined conditions for human iPSC derivation and culture. Nat Methods. 2011;8:424‐429. [DOI] [PMC free article] [PubMed] [Google Scholar]
- 18. Takenaka C, Miyajima H, Yoda Y, et al. Controlled growth and the maintenance of human pluripotent stem cells by cultivation with defined medium on extracellular matrix‐coated micropatterned dishes. PLoS One. 2015;10:e0129855. [DOI] [PMC free article] [PubMed] [Google Scholar]
- 19. Draper JS, Pigott C, Thomson JA, Andrews PW. Surface antigens of human embryonic stem cells: changes upon differentiation in culture. J Anat. 2002;200:249‐258. [DOI] [PMC free article] [PubMed] [Google Scholar]
- 20. Adewumi O, Aflatoonian B, Ahrlund‐Richter L, et al. Characterization of human embryonic stem cell lines by the International Stem Cell Initiative. Nat Biotechnol. 2007;25:803‐816. [DOI] [PubMed] [Google Scholar]
- 21. Wang R, Sun Q, Wang P, et al. Notch and Wnt/beta‐catenin signaling pathway play important roles in activating liver cancer stem cells. Oncotarget. 2016;7:5754‐5768. [DOI] [PMC free article] [PubMed] [Google Scholar]
- 22. Kawaguchi K, Honda M, Yamashita T, et al. Jagged1 DNA copy number variation is associated with poor outcome in liver cancer. Am J Pathol. 2016;186:2055‐2067. [DOI] [PubMed] [Google Scholar]
- 23. Choi YJ, Ingram PN, Yang K, et al. Identifying an ovarian cancer cell hierarchy regulated by bone morphogenetic protein 2. Proc Natl Acad Sci USA. 2015;112:E6882‐E6888. [DOI] [PMC free article] [PubMed] [Google Scholar]
- 24. International StemCellInitiativeC, Akopian V, Andrews PW, et al. Comparison of defined culture systems for feeder cell free propagation of human embryonic stem cells. In Vitro Cell Dev Biol Anim. 2010;46:247‐258. [DOI] [PMC free article] [PubMed] [Google Scholar]
- 25. Hirohashi S, Shimosato Y, Kameya T, et al. Production of alpha‐fetoprotein and normal serum proteins by xenotransplanted human hepatomas in relation to their growth and morphology. Can Res. 1979;39:1819‐1828. [PubMed] [Google Scholar]
Associated Data
This section collects any data citations, data availability statements, or supplementary materials included in this article.
Supplementary Materials