Abstract
The expression of immune checkpoint proteins such as programmed cell death protein 1 (PD‐1) and its ligand (PD‐L1) has been shown to correlate with patient prognosis in many malignant cancers. The expression of PD‐L1 is controlled by c‐Myc; however, further upstream regulation of PD‐L1 expression is largely unknown. We have previously shown that atypical protein kinase C lambda/iota (aPKCλ) phosphorylates the Forkhead box protein O1 (FoxO1) transcription factor at Ser218 to suppress its DNA‐binding ability, thereby regulating c‐Myc expression and controlling physiologic and pathologic endothelial proliferation. The presence of phosphorylation of FoxO1 at Ser218 (pSer218 FoxO1) in cutaneous angiosarcoma (CAS) strongly correlates with poor patient prognosis. Here, we reported that patients with PD‐L1+ cells in CAS lesions showed significantly worse prognosis compared to those that were PD‐L1−. Expression of PD‐L1 correlated with that of aPKCλ or the presence of pSer218FoxO1. Moreover, suppression of aPKCλ expression or inhibition of its activity in HUVECs or AS‐M, an established human angiosarcoma cell line, resulted in decreased PD‐L1 expression. Our results suggest that combined treatment with immune checkpoint inhibitors and aPKCλ inhibitors could be a novel treatment strategy for CAS patients.
Keywords: aPKC, c‐Myc, cutaneous angiosarcoma, FoxO1, PD‐L1
1. INTRODUCTION
Immune checkpoints are regulators of immune system activation, preventing autoimmunity and protecting tissues from immunologic collateral damage.1 The binding of programmed cell death‐1 (PD‐1) on T lymphocytes and its ligands PD‐L1 and PD‐L2 on antigen‐presenting cells results in reduced proliferation and suppressed activity of T cells to establish self‐tolerance, thereby playing an inhibitory role in the normal immune response.2 In malignant cancer, they are often hijacked by transformed cells to avoid the antitumor response by the immune system.3 The existence of PD‐1+ or PD‐L1+ cells in tumor tissues has been reported to correlate to the poor prognosis of patients.4, 5 Furthermore, immune checkpoint inhibitors, such as Abs against PD‐1 or PD‐L1, have been increasingly considered as new targets for cancer immunotherapies. Indeed, an anti‐PD‐1 Ab, nivolumab, is already approved for the treatment of some cancers, such as melanoma, non‐small‐cell lung carcinoma, or renal cell carcinoma.6 Although the treatment of cancer patients with immune checkpoint blockers is a highly promising therapeutic approach yielding remarkable antitumor responses with limited side‐effects, only a proportion of patients respond to this treatment.7 Further understanding of the regulation of PD‐L1 expression will be important to improve immune checkpoint treatment. Recent work has shown that proto‐oncogene c‐Myc regulates PD‐L1 expression in human tumor cells.8
Cutaneous angiosarcoma (CAS) originates from endothelial cells in the vasculature and is a relatively rare, accounting for approximately 2% of soft‐tissue sarcoma, but quite malignant tumor.9 It arises mainly from the scalp of the elderly and frequently results in distant metastasis, especially lung metastasis, at an early stage. Standard treatments for angiosarcoma include surgical resection, chemotherapy, and radiation therapy. Despite the improvement of these treatments in the last few decades, the mean 5‐year survival rate of patients is approximately 33.5%,10 suggesting the importance of developing new therapeutic strategies. We have recently reported that the polarity protein atypical protein kinase C lambda/iota (aPKCλ) controls physiologic and pathologic endothelial proliferation through phosphorylation of the transcription factor Forkhead box O1 (FoxO1). Phosphorylation of the FoxO1 DNA‐binding domain results in inhibiting its DNA binding ability, modulating microRNA (miR)34‐c expression to control c‐Myc expression.11 Moreover, the presence of FoxO1 phosphorylation by aPKCλ shows a strong association with angiosarcoma patient prognosis.11 The miR‐34 family has been reported to directly interact with the promoter region of PD‐L1 and regulate the expression of PD‐L1 in an inhibitory manner in several human cancer cells.12 In line with these observations, we hypothesized that aPKCλ regulates PD‐L1 expression through the aPKCλ/FoxO1 signaling axis. We examined PD‐L1 expression in CAS patient samples by immunostaining and found that PD‐L1 expression was correlated with poor prognosis in CAS patients. Expression of PD‐L1 associated with the expression level of aPKCλ and phosphorylation of FoxO1 at Ser218. Moreover, suppression of aPKCλ resulted in reduced PD‐L1 expression in cultured endothelial cells. Our results suggest a molecular mechanism controlling PD‐L1 expression in CAS and the potential of the blockage of this pathway as a new therapeutic approach for CAS.
2. MATERIALS AND METHODS
2.1. Patients
Twenty‐nine patients who were diagnosed with CAS at the Dermatology department of Okayama University (Okayama, Japan) and Hokkaido University Hospital (Hokkaido, Japan) were examined retrospectively. Clinical information including patient age, sex, tumor site, stage, treatment, and survival was extracted from the medical records of these 2 hospitals. All samples were obtained at the time of biopsy for diagnosis after the proper informed consent. These studies were carried out in accordance with the Declaration of Helsinki.
2.2. Histological analysis
As previously reported, all patients were initially diagnosed with angiosarcoma by pathologists at Okayama University hospital or Hokkaido University hospital.11 Formaldehyde‐fixed paraffin‐embedded angiosarcoma tissue samples were deparaffinized, and antigen retrieval was carried out by boiling the slides in EDTA buffer (pH 8.0) for 15 minutes, blocked with 5% BSA/5% FBS/0.1% Tween‐20 for 30 minutes, and treated with rabbit anti‐human PD‐L1 Ab (1:100 dilution; Cell Signaling Technology, Danvers, MA, USA), mouse anti‐human PD‐1 Ab (1:100 dilution; Cell Signaling Technology), and goat anti‐human vascular endothelial (VE) ‐cadherin Ab (1:100 dilution; R&D Systems, Minneapolis, MN, USA) at 4°C overnight. Slides were then incubated with biotin‐conjugated donkey anti‐rabbit IgG (1:500 dilution; Jackson Immunoresearch, West Grove, PA, USA), Alexa Fluor 488 donkey anti‐goat IgG (1:500 dilution; Invitrogen, Carlsbad, CA, USA), Alexa Fluor 555 donkey anti‐mouse IgG, and Hoechst 33342 (1:500 dilution; Thermo Fisher Scientific, Waltham, MA, USA) at room temperature for 2 hours, followed by Alexa Fluor 647 streptavidin (1:500 dilution; Invitrogen). All slides were assessed using confocal laser scanning microscopy (SP8; Leica, Wetzlar, Germany). All images were analyzed by ImageJ (NIH, Bethesda, MD, USA). In addition to the, at least, partial presence of EC markers, transformed cells at the lesion were identified with abnormal nuclear features, which were visualized by DAPI staining. As previously reported, over 5% of membranous expression of PD‐L1 at the tumor site was defined as positive.13 Staining intensity and localization were evaluated by 2 investigators independently. Samples stained with only secondary Abs were used as a negative controls.
2.3. Cell culture
We used pooled HUVECs that were purchased from Pelobiotech (Planegg, Germany) and an angiosarcoma cell line AS‐M kindly provided by Dr. Ronald E. Unger from Johannes Gutenberg University (Mainz, Germany) for in vitro assays. The HUVECs were cultured in Endothelial Cell Growth Medium 2 (PromoCell, Heidelberg, Germany), and ASMs were cultured in Endothelial Cell Growth Medium MV (PromoCell) with 1% penicillin/streptomycin (Thermo Fisher Scientific).
2.4. Gene knockdown
SMART‐pool ON‐TARGET plus PRKCI were transfected with Oligofectamine (Invitrogen) in HUVECs and ASMs to achieve PRKCI knockdown. Scrambled siRNA was used for control. Total RNA of the cells was extracted 48 hours after transfection, and protein was extracted 72 hours after transfection.
2.5. Sodium aurothiomalate hydrate treatment
Cells were treated with 100 μmol/L sodium aurothiomalate hydrate (ATM, Sigma, St. Louis, MO, USA), then total RNA or protein was extracted 48 hours or 72 hours after transfection, respectively. Cells without ATM treatment were used for control.
2.6. Reverse transcription–quantitative PCR
For the analysis of mRNA relative expression levels, total RNA was extracted with Quick RNA‐Mini kit (Zymo Research, Irvine, CA, USA) and reverse‐transcribed into cDNA with Superscript VILO cDNA synthesis kit (Invitrogen). Semiquantitative PCR was undertaken using SYBR Green and the following gene primers: beta2‐microglobulin (beta2MG), CD274, and PRKCI. The sequences of the primers are as follows: beta2MG forward (F), 5′‐CACCCCCACTGAAAAAGATGAG‐3′ and reverse (R), 5′‐CCTCCATGATGCTGCTTACATG‐3′; CD274 F, 5′‐TCAATGCCCCATACAACAAA‐3′ and R, 5′‐TGCTTGTCCAGATGACTTCG‐3′; and PRKCI F, 5′‐CGGCCAGGAGATACAACCAG‐3′ and R, 5′‐AAGAGCCCACCAGTCAACAC‐3′.
All assays were carried out using the StepOnePlus Real‐Time PCR System (Applied Biosystems, Foster City, CA, USA) and analyzed by the comparative Ct method using the expression of beta2MG as an endogenous control.
2.7. Western blot analysis
Cells were lysed with 1× SDS sample buffer, sonicated with a Bioruptor (Diagenode, Denville, NJ, USA) for the reduction of viscosity, and the protein concentration was determined using a BCA protein assay kit (Pierce, Waltham, MA, USA). Then 2% β‐mercaptoethanol was added and boiled at 95°C for 10 minutes. Western blot analysis was carried out according to standard laboratory practices. Membranes were probed with anti‐PD‐L1 (Cell Signaling Technology), anti‐aPKCλ (BD Life Sciences, Franklin Lakes, NJ, USA), and anti‐α‐tubulin (Cell Signaling Technology) and then incubated with HRP‐conjugated secondary Abs. The secondary Abs were visualized with Amersham ECL Prime Western Blotting Detection Reagent (GE Healthcare Life Sciences, Chicago, IL, USA) and analyzed using the ImageQuant LAS‐4000 Imaging System (GE Healthcare Life Sciences). Quantification of the bands was undertaken with ImageJ (NIH).
2.8. Immunohistolabelling of culture cells
Cells seeded on gelatin‐coated cover slips were fixed with 4% paraformaldehyde phosphate buffer for 10 minutes, permeabilized with 0.5% Tween‐20/PBS for 15 minutes, and blocked with 3% BSA/0.1% Tween‐20/PBS for 30 minutes. Then cells were treated with rabbit anti‐human PD‐L1 Ab (1:100 dilution; Cell Signaling Technology), mouse anti‐aPKCλ Ab (1:100 dilution; BD Life Sciences), and goat anti‐human VE‐cadherin Ab (1:100 dilution; R&D Systems) at 4°C overnight. Slides were incubated with Alexa Fluor 488 donkey anti‐rabbit IgG (1:1000 dilution; Invitrogen), Alexa Fluor 555 donkey anti‐mouse IgG (1:1000 dilution; Invitrogen), Alexa Fluor 647 anti‐goat IgG (1:1000 dilution; Invitrogen), and Hoechst 33342 (1:1000 dilution; Thermo Fisher Scientific) at room temperature for 2 hours All slides were assessed using confocal laser scanning microscopy (SP8; Leica). All images were analyzed using ImageJ (NIH).
2.9. Statistical analysis
Continuous variables were reported as mean ± SEM and were compared using Student's t test. P values < .05 were considered statistically significant. Patient survival rates were shown by Kaplan‐Meier curves and compared by the log‐rank test. All statistical analyses were undertaken using JMP Pro 13.0 (SAS, Cary, NC, USA) and Prism 5 software (GraphPad Software, La Jolla, CA, USA).
3. RESULTS
3.1. Expression of PD‐L1 correlates with poor prognosis of CAS patients
We have previously shown that the presence of pSer218 FoxO1 and high expression of aPKCλ in transformed cells in CAS are strongly correlated with poor patient prognosis.11 Among these previously analyzed samples, those from 29 patients at the time of biopsy for initial diagnosis were used for further analysis due to sample availability. Patient characteristics are summarized in Table 1. The average age of the patients was 76.1 years, and 62.1% of the patients (n = 18) were men. The primary tumor sites were parietal in most patients (n = 25, 86.2%), and the clinical stage of the most patients was stage I (n = 21, 72.4%). Almost all patients were subsequently treated with chemotherapy and radiation therapy (Table 1).
Table 1.
Characteristics of 29 patients with cutaneous angiosarcoma
| All patients (n = 29) | PD‐L1 positive (n = 22) | PD‐L1 negative (n = 7) | P value | |
|---|---|---|---|---|
| Age, y; mean ± SEM | 76 ± 12.7 | 77.8 ± 2.7 | 70.4 ± 4.7 | .39 |
| Sex | ||||
| Male | 18 (62.1) | 15 (68.2) | 3 (42.9) | .37 |
| Female | 11 (37.9) | 7 (31.8) | 4 (57.1) | |
| Primary tumor site | ||||
| Parietal | 25 (86.2) | 19 (86.4) | 6 (85.7) | 1.00 |
| Nonparietal | 4 (13.8) | 3 (13.6) | 1 (14.3) | |
| Stage | ||||
| I | 21 (72.4) | 16 (72.7) | 5 (71.4) | 1.00 |
| II | 5 (17.2) | 3 (13.6) | 2 (28.6) | .57 |
| III | 3 (10.3) | 3 (13.6) | 0 (0) | .56 |
| Therapy | ||||
| Chemotherapy | 24 (82.8) | 18 (81.8) | 6 (85.7) | 1.00 |
| Radiation therapy | 27 (93.1) | 20 (90.9) | 7 (100.0) | 1.00 |
| PD‐L1 positive (n = 22) | P value | ||
|---|---|---|---|
| PD‐1 positive (n = 10) | PD‐1 negative (n = 12) | ||
| Age, y; mean ± SEM | 80.1 ± 7.9 | 75.9 ± 9.2 | .27 |
| Sex | |||
| Male | 8 (80.0) | 7 (58.3) | .38 |
| Female | 2 (20.0) | 5 (41.7) | |
| Primary tumor site | |||
| Parietal | 10 (100.0) | 9 (75.0) | .22 |
| Nonparietal | 0 (0.0) | 3 (25.0) | |
| Stage | |||
| I | 8 (80.0) | 8 (66.7) | .65 |
| II | 1 (10.0) | 2 (16.7) | 1.00 |
| III | 1 (10.0) | 2 (16.7) | 1.00 |
| Therapy | |||
| Chemotherapy | 7 (70.0) | 11 (91.7) | .29 |
| Radiation therapy | 10 (100.0) | 10 (83.3) | .48 |
Data shown as n (%) unless otherwise indicated.
All samples were analyzed by immunostaining using Abs against PD‐L1 and PD‐1. To identify transformed cells, co‐immunostaining with an Ab against VE‐cadherin was carried out. The signal corresponding to anti‐PD‐L1 Ab was confirmed in 22 samples (75.9%), but we did not observe PD‐L1 expression in 7 samples (24.1%) (Figure 1A). Immunoreactive signal against PD‐1 was confirmed in 12 samples (41.4%) (Figure 1B).
Figure 1.
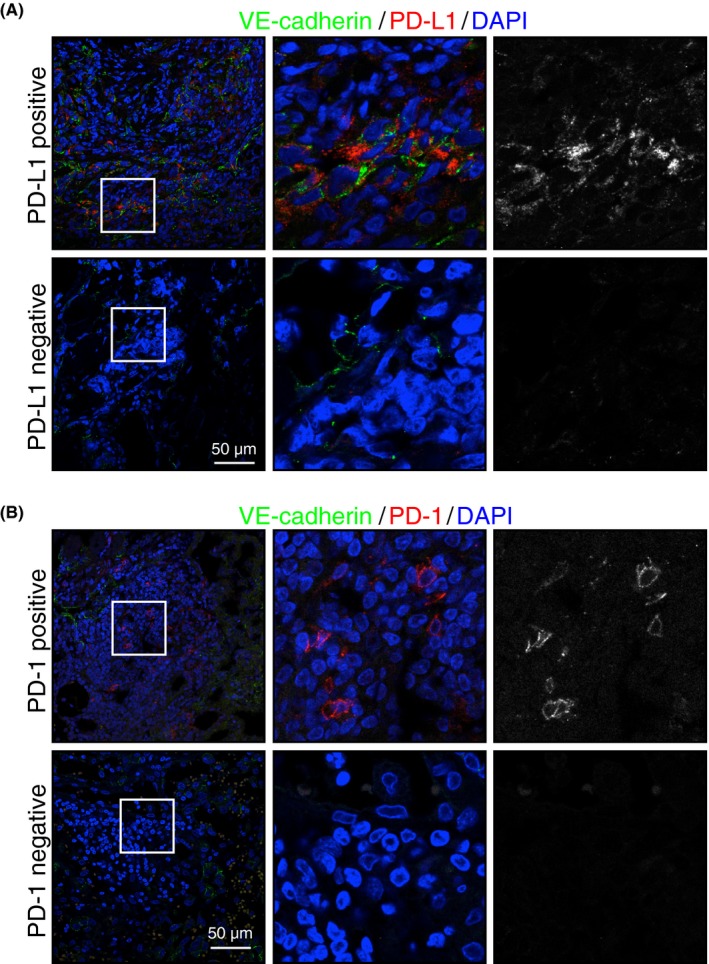
Expression of programmed cell death 1 (PD‐1) and its ligand (PD‐L1) in cutaneous angiosarcoma tissue. A,B, Representative confocal images of PD‐L1+ and PD‐L1− (red or white) (A) and PD‐1+/PD‐1− (red or white) (B) tumors. Transformed endothelial cells were stained with an antivascular endothelial (VE)‐cadherin Ab (green). Nuclei were stained with Hoechst (blue). Scale bar = 50 μm. Middle and right panels are higher magnification images of areas indicated on left panels
The patient characteristics, such as age, sex, primary tumor sites, clinical stage, or treatment, did not show any significant differences in PD‐L1+/ PD‐L1− groups nor PD‐1+/PD‐1− groups in PD‐L1− patients (Table 1). Patient survival time was analyzed by Kaplan‐Meier analysis and revealed the reduced survival time of patients with PD‐L1+ tumors (log‐rank, P = .044; Figure 2A); however, we could not confirm any effect of the expression of PD‐1 on patient survival (log‐rank, P = 1.00; Figure 2B). Nor did we observe any difference in survival time between PD‐1+ and PD‐1− groups among PD‐L1+ patients (Figure S1).
Figure 2.
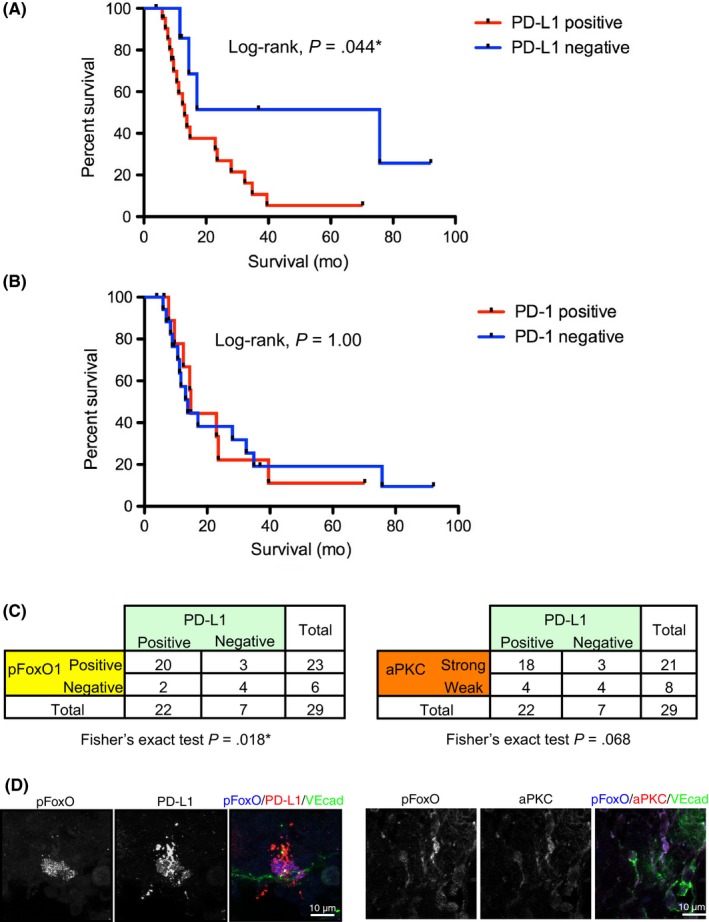
Correlation of programmed cell death ligand 1 (PD‐L1) expression with poor prognosis of patients, the presence of pSer218 Forkhead box protein O1 (FoxO1), and atypical protein kinase C lambda/iota (aPKCλ) expression. A, Kaplan‐Meier curve of patients with PD‐L1+/PD‐L1− tumors revealed the poor prognosis of patients with PD‐L1+ tumors (log‐rank, *P < .05). B, Kaplan‐Meier curve of the patients with PD‐1+/PD‐1− tumors failed to show any significant difference between these 2 groups (log‐rank, P = 1.00). C, PD‐L1 expression strongly correlated with pSer218 FoxO1 expression on cutaneous angiosarcoma tissue, analyzed by Fisher's exact test using 2 × 2 contingency table (P = .018*). PD‐L1 expression related to strong aPKCλ expression with marginal statistical difference analyzed by Fisher's exact test (P = 0.068). D, Representative confocal images of PD‐L1 (red)/pFoxO (blue) or aPKC (red)/pFoxO (blue) with vascular endothelial‐cadherin (VEcad; green)
Given the fact that presence of FoxO1 phosphorylation by aPKCλ shows strong association with angiosarcoma patient prognosis,11 the correlation of PD‐L1 expression and the presence of pSer218 FoxO1 were analyzed by Fisher's exact test using a 2 × 2 contingency table (Figure 2C). The existence of PD‐L1 in CAS tissue was strongly correlated with the existence of pSer218 FoxO1 (P = .018). The existence of PD‐L1 was also correlated with the existence of aPKCλ, although there was only marginal statistical association (P = .068; Figure 2C). This is likely due to the limited number of samples in this study. In those patient tissues, immunoreactive signal against pSer218 FoxO1 or aPKC was confirmed in the VE‐cadherin+ and PD‐L1+ cells (Figure 2D). These results could suggest a functional link between the aPKCλ/pSer218 FoxO1 signaling axis and PD‐L1 expression.
3.2. PRKCI gene knockdown suppressed mRNA and protein levels of PD‐L1 in HUVECs and AS‐M cells
c‐Myc, which is regulated by the aPKCλ/pSer218 FoxO1 signaling axis, controls PD‐L1 expression.8 To gain further insight into the relationship between aPKCλ and PD‐L1, we used 2 different EC types, nontransformed HUVECs and AS‐M cells, an established human angiosarcoma cell line.14 The expression of aPKCλ was knocked down (KD) by transfection of siRNA against PRKCI, the gene encoding aPKCλ in HUVECs. Under these conditions, the level of CD274 mRNA, the gene encoding PD‐L1, as well as protein level of PD‐L1 was significantly decreased (Figure 3A,B). Moreover, mRNA of CD274 and protein level of PD‐L1 expression were reduced in PRKCI KD AS‐M cells (Figure 3C,D). Under the condition, pSer218 FoxO was significantly reduced (Figure 3D). In addition, a decreased level of PD‐L1 expression in PRKCI KD HUVECs was also confirmed by immunostaining with Abs against both aPKCλ and PD‐L1. The mean fluorescence intensity of PD‐L1 in each HUVEC was proportional to that of aPKCλ (R 2 = 0.766), and the mean fluorescence intensity of PD‐L1 in PRKCI KD HUVECs was significantly lower than that in control HUVECs (Figure 4A). Similarly, transfection of siRNA against PRKCI into AS‐M significantly reduced PD‐L1 expression and the PD‐L1 expression level was proportional to aPKCλ expression level in each AS‐M cell (R 2 = 0.428; Figure 4B).
Figure 3.
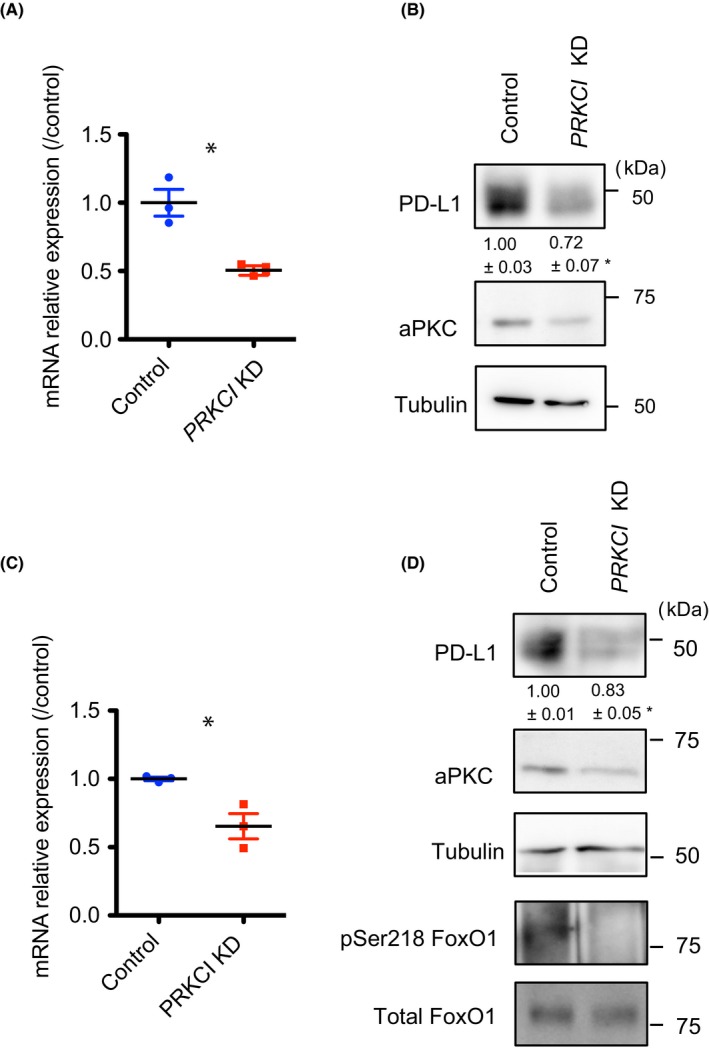
Suppression of programmed cell death ligand 1 (PD‐L1) expression by atypical protein kinase C lambda/iota (aPKCλ) knockdown (KD) in physiologic and pathologic endothelial cells (ECs) in vitro with RT‐PCR and western blotting. A,B, PRKCI KD HUVECs showed markedly reduced PD‐L1 expression compared to control ECs. Reduced transcription of CD274 was analyzed by real‐time RT‐PCR (n = 3) (A), and decreased PD‐L1 protein expression was shown by western blot analysis (B) (n = 3). C,D, PRKCI KD AS‐M cells showed markedly reduced PD‐L1 expression compared to control ECs. Reduced transcription of CD274 was analyzed by real‐time RT‐PCR (n = 3) (C), and decreased PD‐L1 protein expression was shown by western blot analysis (n = 3) (D). Relative amount of PD‐L1 in PRKCI KD ECs compared to control EC is shown. Data represent mean ± SEM by 2‐tailed unpaired t test. *P < .05. FoxO1, Forkhead box protein O1
Figure 4.
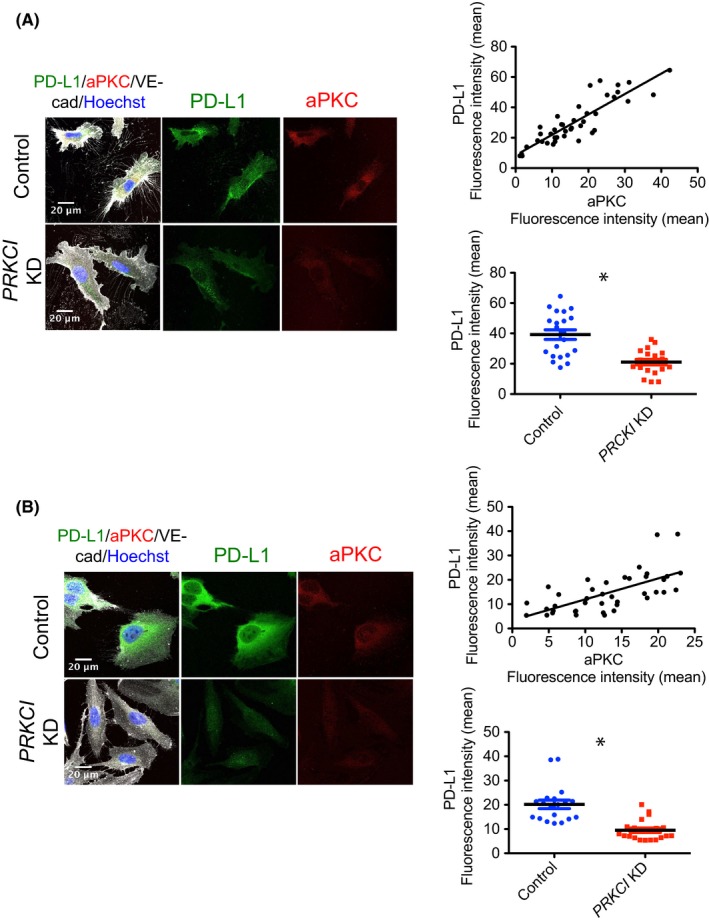
Suppression of programmed cell death ligand 1 (PD‐L1) expression by atypical protein kinase C lambda/iota (aPKCλ) knockdown (KD) in physiologic and pathologic endothelial cells in vitro confirmed with immunostaining. A,B, PRKCI KD and control HUVECs (A) and AS‐M cells (B) were immunostained with Ab against PD‐L1 (green), aPKCλ (red), vascular endothelial‐cadherin (VE‐cad; gray), and Hoechst (blue). Fluorescence intensity of the green and red channels in each cell was measured and analyzed (n ≥ 20 each group). The scatter diagram of the mean fluorescence intensity of these 2 colors revealed the significantly proportional relationship between PD‐L1 and aPKCλ in HUVECs and AS‐M cells, and the decreased expression of PD‐L1 in PRKCI KD HUVECs was confirmed by comparing the mean fluorescence intensity of PD‐L1 in PRKCI KD and control HUVECs or AS‐M cells. Scale bar = 20 μm. Data represent mean ± SEM by 2‐tailed unpaired t test. *P < .05
3.3. Treatment with ATM suppresses PD‐L1 expression
Sodium aurothiomalate is a gold compound that was used for its anti‐inflammatory action in the treatment of rheumatoid arthritis. It has recently been rediscovered as an inhibitor of aPKCλ. Activated Rho family small GTPase Cdc42 binds to partitioning defective protein 6 (PAR‐6) to promote the complex formation of PAR‐6 with aPKCλ, resulting in aPKCλ activation.15 Sodium aurothiomalate suppresses the binding of PAR‐6 with aPKCλ, thereby inhibiting aPKCλ activation.16 Additionally, ATM suppresses non‐small‐cell lung cancer growth in vitro and in animal models.17 Moreover, clinical investigations targeting aPKCλ in lung cancer are ongoing.18 We have previously shown that treatment of another angiosarcoma patient‐derived EC line with ATM resulted in decreased c‐Myc expression and suppressed cell proliferation.11 For further investigation of the role of aPKCλ in PD‐L1 expression in ECs, we next carried out ATM treatment with HUVECs and AS‐M cells. The CD274 mRNA levels and PD‐L1 expression of ECs in the presence of ATM were decreased significantly compared to that of control cells (Figure 5). We also overexpressed aPKC into HUVECs to examine the effect on PD‐L1 expression. Although aPKC KD or pharmacological aPKC inhibition effectively suppressed PD‐L1 expression, aPKC overexpression induced only marginal increase in PD‐L1 expression (Figure S2). These observations suggest that aPKC activity is necessary for PD‐L1 expression, which would correlate with poor prognosis for angiosarcoma patients (Figure 1), but not sufficient to induce PD‐L1 expression. Taken together, our results suggest that pharmacological inhibition of aPKCλ reduces not only transformed cell proliferation in CAS but also could improve immune responses of patients for better prognosis through modulating PD‐L1 expression.
Figure 5.
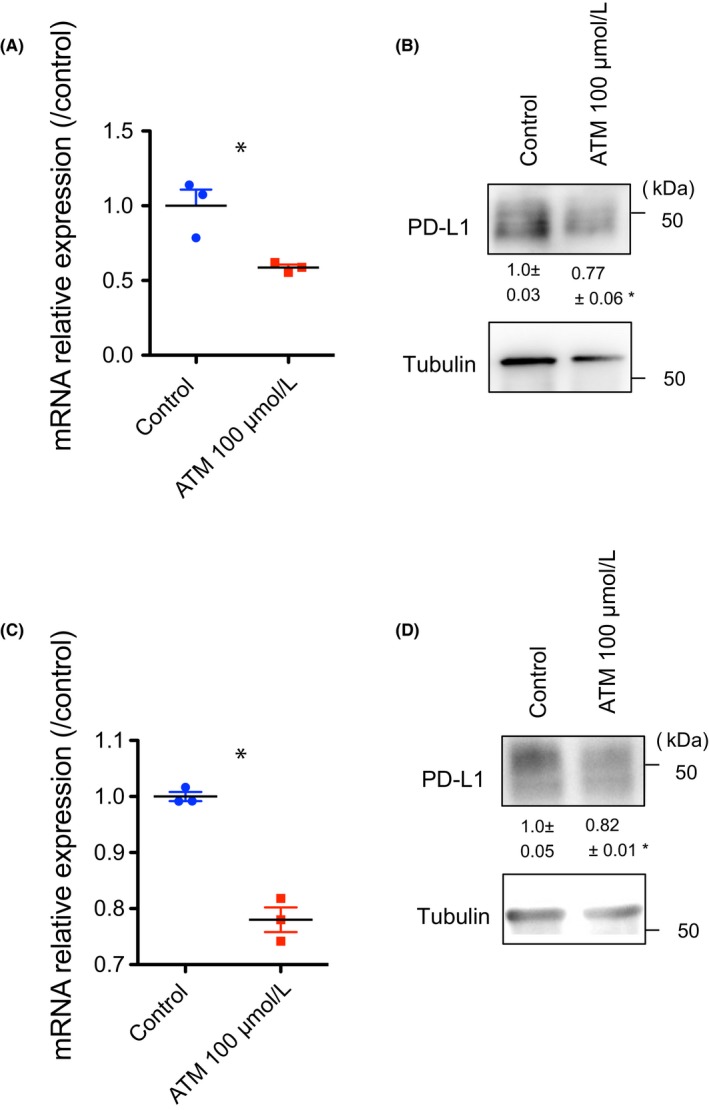
Pharmacological inhibition of atypical protein kinase C lambda/iota (aPKCλ) suppresses programmed cell death ligand 1 (PD‐L1) expression in HUVECs and AS‐Ms. A, mRNA relative expression of CD274 reduced after treatment with 100 μmol/L sodium aurothiomalate hydrate (ATM) in HUVECs, analyzed by real‐time RT‐PCR (n = 3). B, Decreased protein levels of PD‐L1 in HUVECs were also identified by western blot analysis (n = 3). C, Treatment with 100 μmol/L ATM caused decreased mRNA relative expression levels of CD274 in AS‐M cells (n = 3). D, PD‐L1 expression analyzed by western blotting also became significantly lower after 100 μmol/L ATM treatment (n = 3). Data represent mean ± SEM by 2‐tailed unpaired t test. *P < .05
4. DISCUSSION
Programmed cell death ligand 1 is highly expressed in several cancers. In the tumor microenvironment, PD‐L1 and its receptor PD‐1 play an important role in transformed cell survival by avoiding tumor neutralizing immune surveillance and thereby tumor progression.3 Tumor cells generally express PD‐L1, whereas a variety of immune cells express PD‐1.2 Although immunotherapy using Abs targeting PD‐1/PD‐L1 is a novel and exciting approach for the field of cancer, the benefit of immunotherapy is limited to specific types of cancers. This might be due to the heterogeneous expression of PD‐1 and PD‐L1 in the tumor microenvironment19 or it might be due to post‐translational modification.20 The expression of PD‐L1 correlates with the poor prognosis of patients with few exceptions, such as Merkel cell carcinoma.21 The major cause of Merkel cell carcinoma is Merkel cell polyomavirus infection. As cytokines, such as γ‐interferon (IFNγ), are released in the early immune response and known to induce the upregulation of PD‐L1,22 the high expression of PD‐L1 on Merkel cell carcinoma might be reflective of an active immune reaction against the viral infection and thereby result in the correlation with improved prognosis in patients with PD‐L1+ tumors. Previous work has reported that PD‐L1 expression on tumor cells could suppress CD8+ T‐cell cytotoxicity23; therefore, it is reasonable that PD‐L1 expression at tumor sites in many types of cancer correlates with poor patient prognosis. Consistently, we found that PD‐L1 expression in CAS was associated with reduced patient survival time, but we did not observe any association between PD‐1 expression and patient survival time. Two previous studies have examined PD‐L1 expression in CAS. Consistent with our results, Shimizu et al reported that the expression of PD‐L1 was associated with worsening patient prognosis.24 On the contrary, Honda et al reported that PD‐L1 expression and high infiltration of PD‐1+ cells correlated with improved prognosis of the patients.25 Further analysis is therefore warranted.
Although the molecular mechanisms controlling PD‐1 expression in T cells have been well studied, the mechanism controlling PD‐L1 expression is not still fully understood. It is known that cytokines are very important to upregulate PD‐L1 expression. Several of the common γ‐chain cytokines such as interleukin (IL)‐2, IL‐7, IL‐15, IL‐4, and granulocyte‐macrophage colony‐stimulating factor upregulate PD‐L1 expression.22, 26 Granulocyte‐macrophage colony‐stimulating factor and IL‐4 are also strong regulators of PD‐L2.27 In IFNγ signaling, interferon regulatory factor‐1 can bind to the PD‐L1 promoter and directly regulate PD‐L1 expression. Additionally, hypoxia‐inducible factor‐1 (HIF‐1α) can bind to a hypoxia response element in the PD‐L1 promoter not only on tumor cells, but also in myeloid‐derived suppressor cells, macrophages, and dendritic cells within the tumor environment and lead to enhanced PD‐L1 expression. In the tumor microenvironment, mutation of EGFR or loss of PTEN and NRAS, which leads to overactivation of the PI3K/Akt pathway, or downregulation of miR‐200 or miR‐513, also enhances PD‐L1 expression.26 The PIK3/Akt pathway signaling is a known activator of aPKCλ,28 concurrently leading to FoxO1 inactivation by its cytoplasmic localization.29 Hypoxia‐inducible factor‐1α is also reported to activate aPKCς, which is another aPKC family member.30 Recently, Casey et al reported that c‐Myc, a proto‐oncogene, regulates PD‐L1 expression directly in some tumor cells, such as T‐cell acute lymphoblastic leukemia, melanoma, and non‐small‐cell lung carcinoma cell lines.8 Moreover, Cortez et al reported that miR‐34 downregulates PD‐L1 expression by binding to the 3′‐UTR of PD‐L1 mRNA.12 Our previous work revealed that aPKCλ phosphorylates FoxO1 DNA‐binding domain (Ser218), controlling c‐Myc expression through miR‐34c abundance, and thereby regulating cell proliferation (Figure 6).11 Additionally, we have shown PD‐L1 expression is regulated downstream of this pathway (Figure 6). Taken together, these observations suggest the potential that pharmacologic inhibition of aPKCλ could suppress cancer cell proliferation and also modulate immune responses in CAS patients.
Figure 6.
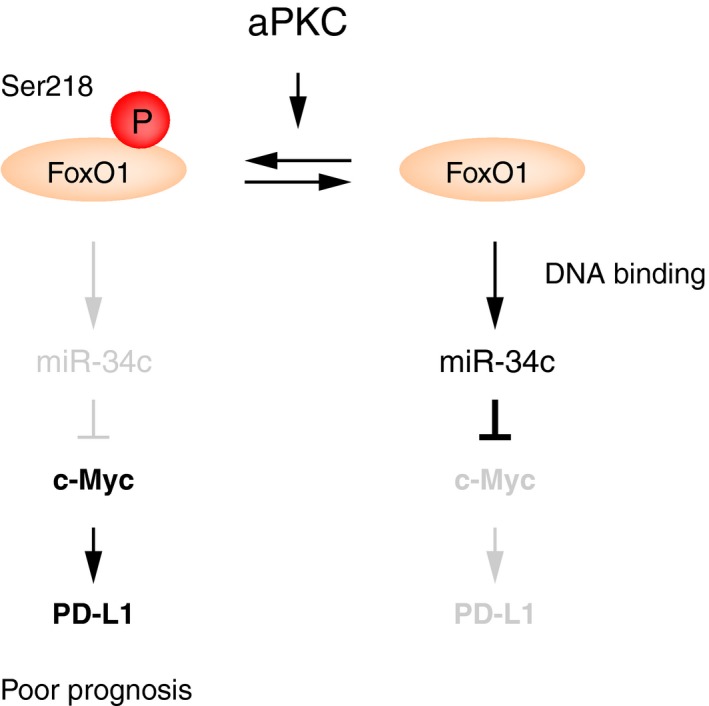
Schematic figure. Atypical protein kinase C (aPKC) phosphorylates DNA‐binding domain of Forkhead box protein O1 (FoxO1) to suppress its DNA‐binding ability. As a result, c‐Myc expression is increased by modulating microRNA (miR)‐34c abundance.11 In addition to controlling cell proliferation, this aPKC/pSer218 FoxO1 signaling axis regulates programmed cell death ligand 1 (PD‐L1) expression. Inhibition of aPKC would be promising treatment for malignant tumors such as angiosarcoma
CONFLICT OF INTEREST
The authors declare no competing financial interests.
Supporting information
ACKNOWLEDGMENTS
We thank Dr. Ronald Unger for reagents. Funding for this project was provided by the Excellence Cluster Cardio‐Pulmonary System, the German Research Foundation, Deutsche Forschungsgemeinschaft (NA 1195/1‐1). Dr. Meghan Riddell is supported by the Alexander von Humboldt Foundation.
Kawamura A, Kawamura T, Riddell M, et al. Regulation of programmed cell death ligand 1 expression by atypical protein kinase C lambda/iota in cutaneous angiosarcoma. Cancer Sci. 2019;110:1780–1789. 10.1111/cas.13981
REFERENCES
- 1. Okazaki T, Chikuma S, Iwai Y, Fagarasan S, Honjo T. A rheostat for immune responses: the unique properties of PD‐1 and their advantages for clinical application. Nat Immunol. 2013;14(12):1212‐1218. [DOI] [PubMed] [Google Scholar]
- 2. Sharpe AH, Wherry EJ, Ahmed R, Freeman GJ. The function of programmed cell death 1 and its ligands in regulating autoimmunity and infection. Nat Immunol. 2007;8(3):239‐245. [DOI] [PubMed] [Google Scholar]
- 3. Dong H, Strome SE, Salomao DR, et al. Tumor‐associated B7‐H1 promotes T‐cell apoptosis: a potential mechanism of immune evasion. Nat Med. 2002;8(8):793‐800. [DOI] [PubMed] [Google Scholar]
- 4. Gadiot J, Hooijkaas AI, Kaiser AD, van Tinteren H, van Boven H, Blank C. Overall survival and PD‐L1 expression in metastasized malignant melanoma. Cancer. 2011;117(10):2192‐2201. [DOI] [PubMed] [Google Scholar]
- 5. Thompson RH, Kuntz SM, Leibovich BC, et al. Tumor B7‐H1 is associated with poor prognosis in renal cell carcinoma patients with long‐term follow‐up. Can Res. 2006;66(7):3381‐3385. [DOI] [PubMed] [Google Scholar]
- 6. Xu‐Monette ZY, Zhang M, Li J, Young KH. PD‐1/PD‐L1 blockade: have we found the key to unleash the antitumor immune response? Front Immunol. 2017;8:1597. [DOI] [PMC free article] [PubMed] [Google Scholar]
- 7. Robert C, Long GV, Brady B, et al. Nivolumab in previously untreated melanoma without BRAF mutation. N Engl J Med. 2015;372(4):320‐330. [DOI] [PubMed] [Google Scholar]
- 8. Casey SC, Tong L, Li Y, et al. MYC regulates the antitumor immune response through CD47 and PD‐L1. Science. 2016;352(6282):227‐231. [DOI] [PMC free article] [PubMed] [Google Scholar]
- 9. Shin JY, Roh SG, Lee NH, Yang KM. Predisposing factors for poor prognosis of angiosarcoma of the scalp and face: systematic review and meta‐analysis. Head Neck. 2017;39(2):380‐386. [DOI] [PubMed] [Google Scholar]
- 10. Bernstein JM, Irish JC, Brown DH, et al. Survival outcomes for cutaneous angiosarcoma of the scalp versus face. Head Neck. 2017;39(6):1205‐1211. [DOI] [PubMed] [Google Scholar]
- 11. Riddell M, Nakayama A, Hikita T, et al. aPKC controls endothelial growth by modulating c‐Myc via FoxO1 DNA‐binding ability. Nat Commun. 2018;9(1):5357. [DOI] [PMC free article] [PubMed] [Google Scholar]
- 12. Cortez MA, Ivan C, Valdecanas D, et al. PDL1 Regulation by p53 via miR‐34. J Natl Cancer Inst 2016;108(1):djv303. [DOI] [PMC free article] [PubMed] [Google Scholar]
- 13. Taube JM, Anders RA, Young GD, et al. Colocalization of inflammatory response with B7‐h1 expression in human melanocytic lesions supports an adaptive resistance mechanism of immune escape. Sci Transl Med 2012;4(127):127ra37. [DOI] [PMC free article] [PubMed] [Google Scholar]
- 14. Krump‐Konvalinkova V, Bittinger F, Olert J, Brauninger W, Brunner J, Kirkpatrick CJ. Establishment and characterization of an angiosarcoma‐derived cell line, AS‐M. Endothelium. 2003;10(6):319‐328. [DOI] [PubMed] [Google Scholar]
- 15. Yamanaka T, Horikoshi Y, Suzuki A, et al. PAR‐6 regulates aPKC activity in a novel way and mediates cell‐cell contact‐induced formation of the epithelial junctional complex. Genes Cells. 2001;6(8):721‐731. [DOI] [PubMed] [Google Scholar]
- 16. Stallings‐Mann M, Jamieson L, Regala RP, Weems C, Murray NR, Fields AP. A novel small‐molecule inhibitor of protein kinase Ciota blocks transformed growth of non‐small‐cell lung cancer cells. Can Res. 2006;66(3):1767‐1774. [DOI] [PubMed] [Google Scholar]
- 17. Regala RP, Thompson EA, Fields AP. Atypical protein kinase C iota expression and aurothiomalate sensitivity in human lung cancer cells. Cancer Res. 2008;68(14):5888‐5895. [DOI] [PMC free article] [PubMed] [Google Scholar]
- 18. Mansfield AS, Fields AP, Jatoi A, et al. Phase I dose escalation study of the PKCiota inhibitor aurothiomalate for advanced non‐small‐cell lung cancer, ovarian cancer, and pancreatic cancer. Anticancer Drugs. 2013;24(10):1079‐1083. [DOI] [PMC free article] [PubMed] [Google Scholar]
- 19. Falk AT, Yazbeck N, Guibert N, et al. Effect of mutant variants of the KRAS gene on PD‐L1 expression and on the immune microenvironment and association with clinical outcome in lung adenocarcinoma patients. Lung Cancer. 2018;121:70‐75. [DOI] [PubMed] [Google Scholar]
- 20. Li CW, Lim SO, Xia W, et al. Glycosylation and stabilization of programmed death ligand‐1 suppresses T‐cell activity. Nat Commun. 2016;7:12632. [DOI] [PMC free article] [PubMed] [Google Scholar]
- 21. Lipson EJ, Vincent JG, Loyo M, et al. PD‐L1 expression in the Merkel cell carcinoma microenvironment: association with inflammation, Merkel cell polyomavirus and overall survival. Cancer Immunol Res. 2013;1(1):54‐63. [DOI] [PMC free article] [PubMed] [Google Scholar]
- 22. Yamazaki T, Akiba H, Iwai H, et al. Expression of programmed death 1 ligands by murine T cells and APC. J Immunol. 2002;169(10):5538‐5545. [DOI] [PubMed] [Google Scholar]
- 23. Juneja VR, McGuire KA, Manguso RT, et al. PD‐L1 on tumor cells is sufficient for immune evasion in immunogenic tumors and inhibits CD8 T cell cytotoxicity. J Exp Med. 2017;214(4):895‐904. [DOI] [PMC free article] [PubMed] [Google Scholar]
- 24. Shimizu A, Kaira K, Okubo Y, et al. Positive PD‐L1 expression predicts worse outcome in cutaneous angiosarcoma. J Glob Oncol. 2017;3(4):360‐369. [DOI] [PMC free article] [PubMed] [Google Scholar]
- 25. Honda Y, Otsuka A, Ono S, et al. Infiltration of PD‐1‐positive cells in combination with tumor site PD‐L1 expression is a positive prognostic factor in cutaneous angiosarcoma. Oncoimmunology. 2017;6(1):e1253657. [DOI] [PMC free article] [PubMed] [Google Scholar]
- 26. Chinai JM, Janakiram M, Chen F, Chen W, Kaplan M, Zang X. New immunotherapies targeting the PD‐1 pathway. Trends Pharmacol Sci. 2015;36(9):587‐595. [DOI] [PMC free article] [PubMed] [Google Scholar]
- 27. Latchman Y, Wood CR, Chernova T, et al. PD‐L2 is a second ligand for PD‐1 and inhibits T cell activation. Nat Immunol. 2001;2(3):261‐268. [DOI] [PubMed] [Google Scholar]
- 28. Khan AH, Pessin JE. Insulin regulation of glucose uptake: a complex interplay of intracellular signalling pathways. Diabetologia. 2002;45(11):1475‐1483. [DOI] [PubMed] [Google Scholar]
- 29. Eijkelenboom A, Burgering BM. FOXOs: signalling integrators for homeostasis maintenance. Nat Rev Mol Cell Biol. 2013;14(2):83‐97. [DOI] [PubMed] [Google Scholar]
- 30. Datta K, Li J, Bhattacharya R, Gasparian L, Wang E, Mukhopadhyay D. Protein kinase C zeta transactivates hypoxia‐inducible factor alpha by promoting its association with p300 in renal cancer. Cancer Res. 2004;64(2):456‐462. [DOI] [PubMed] [Google Scholar]
Associated Data
This section collects any data citations, data availability statements, or supplementary materials included in this article.
Supplementary Materials


