

Abstract
After fertilization of the transcriptionally silent oocyte, expression from both parental chromosomes is launched through zygotic genome activation (ZGA), occurring in the mouse at the 2‐cell (2C) stage. Among the first elements to be transcribed are the Dux gene, the product of which induces a wide array of ZGA genes, and a subset of evolutionary recent LINE‐1 retrotransposons that regulate chromatin accessibility in the early embryo. The maternally inherited factors that activate Dux and LINE‐1 transcription have so far remained unknown. Mouse embryonic stem cells (mESCs) recapitulate some aspects of ZGA in culture, owing to their ability to cycle through a 2C‐like stage when Dux, its target genes, and LINE‐1 integrants are expressed. Here, we identify the paralog proteins DPPA2 and DPPA4 as necessary for the activation of Dux and LINE‐1 expression in mESCs. Since their encoding RNAs are maternally transmitted to the zygote, it is likely that these factors are important upstream mediators of murine ZGA.
Keywords: DPPA2, DPPA4, DUX, LINE‐1, zygotic genome activation
Subject Categories: Chromatin, Epigenetics, Genomics & Functional Genomics; Development & Differentiation
Introduction
Mammalian embryonic development begins with the fertilization of a transcriptionally silent oocyte by the spermatozoa, resulting in the formation of a totipotent zygote. Transcription from the two parental genomes ensues through a phenomenon known as zygotic or embryonic genome activation (ZGA or EGA). Murine ZGA occurs at the 2‐cell stage, and members of the DUX family of transcription factors were recently identified as important inducers of early embryonic genes in mouse, human, and likely all placental mammals 1, 2, 3. However, murine and human DUX are expressed only after fertilization of the oocytes. Moreover, a subset of LINE‐1 retrotransposons is transiently activated during this period, a DUX‐independent phenomenon important for regulating chromatin accessibility in the murine pre‐implantation embryo 4. Maternally inherited factors are thus likely responsible for inducing the transcription of both Dux and LINE‐1 in the nascent embryo.
Dppa2 (developmental pluripotency‐associated 2) and Dppa4 (developmental pluripotency‐associated 4) are paralog genes conserved in mammals and found as unique Dppa2 orthologs in amphibians, reptiles, and marsupials 5. All Dppa2 and Dppa4 ortholog genes have a conserved SAP (SAF‐A/B, Acinus, and PIAS) motif, important for DNA binding, and a C‐terminal domain of unknown function 6. These genes were first described for their expression profile restricted to pluripotent cells and the germline 7, 8. It was subsequently demonstrated that DPPA2 and DPPA4 activate transcription of genes important for germ cell development in mouse embryonic stem cells (mESCs) and are both essential for murine embryogenesis 9, 10. Embryonic development is impaired when DPPA4 is depleted from murine oocytes, suggesting that the maternally inherited fraction of the protein plays an important role in the early pre‐implantation period 9. How DPPA2 and DPPA4 activate transcription of target genes is unclear, but both proteins associate with transcriptionally active chromatin in mESCs 11, 12, and promoters of DPPA2‐stimulated genes acquire repressive epigenetic marks upon loss of this factor in mESCs 10. This suggests that DPPA2 and DPPA4 act as epigenetic modifiers.
A subpopulation of mESCs known as 2C‐like cells cycles through a state where Dux and target genes are transiently expressed 1, 13. Here, we demonstrate that DPPA2 and DPPA4 act as inducers of Dux and LINE‐1 transcription in mESCs to promote the establishment of a 2C‐like state. As transcripts encoding DPPA2 and to a lesser extent DPPA4 are present in the zygote, it is likely that these factors are important upstream mediators of murine ZGA.
Results and Discussion
DPPA2 and DPPA4 are expressed prior to ZGA
The downregulation of genes expressed in murine 2C embryos when Dppa4 is deleted in mESCs 9 suggested that its product might regulate ZGA. We thus examined the expression of this gene and its paralog Dppa2 in pre‐implantation embryos. We found Dppa2 transcript levels to be high from oocytes to blastocysts, and their Dppa4 counterparts to raise only at ZGA (Figs 1A and EV1A) 14, 15. Therefore, both DPPA2 and DPPA4 are present when Dux, a strong inducer of ZGA, starts being transcribed.
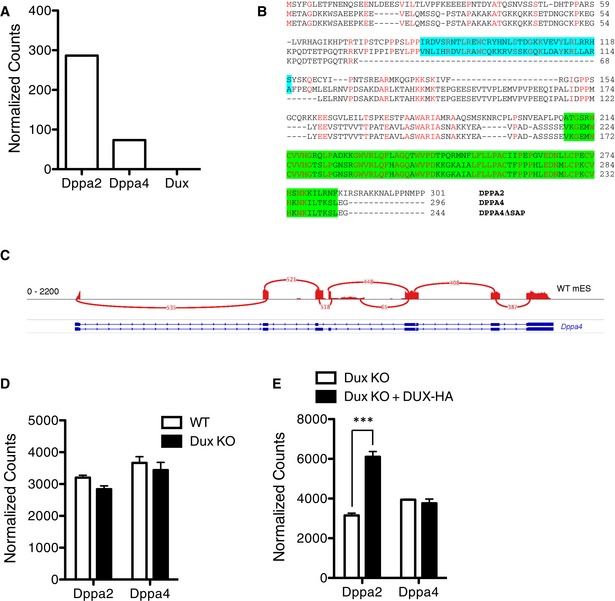
Figure 1. DPPA2 and DPPA4 are expressed throughout pre‐implantation embryo development.

- Comparative expression during murine pre‐implantation embryo development of Dppa2 (red), Dppa4 (blue), Dux (black), and Zscan4c (ZGA marker, green). Each dot represents the average value of single‐cell RNA‐seq from 15
- Schematic representation of DPPA2, DPPA4 full‐length, and DPPA4 truncated proteins. The conserved domains are shown: SAP (light green), C‐terminal (dark green).
- Sashimi plot representing coverage on the Dppa4 gene of an RNA sequencing analysis of murine zygotes, early 2C, mid‐2C, and late 2C (A). Arcs depict splicing events, and numbers, their relative frequency (i.e., reads across junctions).
Figure EV1. DUX is not necessary for DPPA2 and DPPA4 expression.
-
AComparative expression of Dppa2, Dppa4, and Dux in murine oocytes from 14.
-
BProtein alignment of murine DPPA2, DPPA4, and DPPA4 lacking the SAP domain. SAP domain is represented in cyan and C‐terminal domain in green.
-
CSashimi plot representing the coverage on the Dppa4 gene of an RNA sequencing analysis of mESCs.
-
D, EComparative expression of Dppa2 and Dppa4 in WT and Dux KO mESCs (D), and in Dux KO mESCs with or without ectopic expression of DUX (E). Bars represent the average and error bars the SD; n = 3. ***P ≤ 0.001, unpaired t‐test.
Dppa4 encodes for two protein isoforms, one full‐length and one lacking the SAP domain (DPPA4ΔSAP) (Figs 1B and EV1B) 9. The SAP domain promotes nuclear localization, suggesting that the truncated DPPA4 variant is less prone to associate with chromatin 9. Interestingly, we detected only low levels of full‐length Dppa4 transcripts in zygotes and 2C embryos, likely the remnants of maternal transcripts, while their truncated counterparts were highly expressed in middle and late 2C, that is, upon ZGA (Fig 1C). This indicates that maternally inherited and ZGA‐produced DPPA4 isoforms are different, and may have distinct functions. In mESCs, we detected only full‐length Dppa4 transcripts (Fig EV1C), and their levels were comparable in wild‐type (WT) cells, and Dux KO cells with or without ectopic expression of DUX, indicating that Dppa4 expression is not regulated by DUX (Fig EV1D and E). On the other hand, Dppa2 transcription is comparable in WT and Dux KO cells, but ectopic expression of DUX in cells depleted of the endogenous transcripts displays a significant increase of Dppa2 expression, suggesting that DUX can promote but is not essential for Dppa2 transcription.
DPPA2 and DPPA4 induce expression of DUX and other ZGA genes in 2C‐like mESCs
By analyzing a publicly available RNA sequencing (RNA‐seq) dataset from mESCs sorted for expression of a 2C‐specific reporter system (MERVL‐GFP, Zscan4‐Tomato) 16, we found higher level of Dppa2 but not Dppa4 transcripts in this subpopulation (Figs 2A and EV2A). To ask whether DPPA2 and DPPA4 are necessary for transition through this 2C‐like state, we transduced mESCs carrying the MERVL‐GFP reporter, the expression of which we previously demonstrated to be DUX‐dependent 1, with lentiviral vectors expressing shRNAs directed against Dppa2 or Dppa4 (Fig 2B and C). We found that expression of Dux, its downstream target Zscan4, and the MERVL‐GFP reporter was lost upon DPPA2 or DPPA4 depletion. To confirm these results, we deleted Dppa2 or Dppa4 from mESCs by CRISPR/Cas9‐mediated genome editing. Transcriptome analyses revealed a complete loss of transcripts from Dux and most of its previously defined downstream target genes (Figs 2D and E, and EV2B). Expression of some of these genes (Zscan4 and Tdpoz4) was rescued when Dux was ectopically expressed in Dppa2 or Dppa4 KO mESCs (Fig 2F), suggesting that DPPA2 and DPPA4 act upstream of DUX in the establishment of a 2C‐like state in mESCs. We also identified another subset of 1,155 genes downregulated in both Dppa2 and Dppa4 KO mESCs that were not controlled by DUX, including Mael, Tdrd1, and Prex2 (Figs 2G and EV2C and D). These genes were more expressed in 2C‐like cells than in the rest of mESC population (Fig 2H). Nevertheless, only few of these genes were transcribed specifically at ZGA (Fig EV2E and F), pointing to differences in the transcriptomes of 2C embryos and 2C‐like ES cells 9, 10. Notably, genes controlled by DPPA2 and DPPA4 are not located in the proximity of MERVL regulatory sequences (MT2_mm), in contrast to DUX‐controlled ZGA‐specific genes (Fig EV2G).
Figure 2. DPPA2 and DPPA4 regulate expression of Dux and other genes in mESCs.

-
AAverage expression of Dppa2 and Dppa4 in a single‐cell RNA‐seq analysis of mESCs sorted for expression of both Tomato and GFP reporters driven by MERVL and Zscan4 promoters, respectively, and the double‐negative population.
-
B, CFraction of GFP+ cells (B) or Dppa2, Dppa4, Dux, and Zscan4 gene expression (C) in mESCs carrying a MERVL‐GFP reporter and depleted of Dppa2 or Dppa4 using shRNAs specific to the transcripts or a control. Expression was normalized to Actb. Bars represent the average and error bars the SD; n = 3. **P ≤ 0.01, ***P ≤ 0.001, unpaired t‐test.
-
D, ERNA‐seq analysis of WT and Dppa2 (D) or Dppa4 (E) KO mESC clones. The dot plot displays the average gene expression of three independent clones from each cell type; n = 3.
-
FComparative expression by qPCR of Dux, two downstream targets of DUX (Zscan4 and Tdpoz4), and two DUX‐independent targets of DPPA2 and DPPA4 (Mael and Tdrd1) in mESCs depleted of endogenous DPPA2 and DPPA4 and overexpressing ectopically DUX or GFP as a control. Expression was normalized to Actb. Bars represent the average and error bars the SD; n = 3.
-
GVenn diagram representing the overlap of genes downregulated in Dppa2 and Dppa4 KO compared to WT cells.
-
HComparative expression of DUX‐dependent (n = 300) and DPPA2‐ and DPPA4‐dependent (n = 1,288) genes and the rest of the genes in mESCs sorted for expression of both Tomato and GFP reporters driven by MERVL and Zscan4 promoters, respectively, and the double‐negative population. Box limits, twenty‐fifth and seventy‐fifth percentiles; lines in the boxes, median. The upper whisker extends from the hinge to the largest value, no further than 1.5× the interquartile range (IQR) from the hinge. The lower whisker extends from the hinge to the smallest value, at most 1.5× the IQR of the hinge (paired t‐test).
Figure EV2. DPPA2 and DPPA4 regulate expression of DUX‐dependent and ‐independent genes.

-
AqPCR of Dux, Dppa2, and Dppa4 in mESCs sorted for their expression of GFP under control of a MERVL promoter. Bars represent the average and error bars the SD; n = 3
-
BComparative expression of DUX‐regulated genes (n = 300) or the rest of the expressed genes in Dppa2 KO, Dppa4 KO, and WT mESCs. Box limits, twenty‐fifth and seventy‐fifth percentiles; lines in the boxes, median. The upper whisker extends from the hinge to the largest value, no further than 1.5× the interquartile range (IQR) from the hinge. The lower whisker extends from the hinge to the smallest value, at most 1.5× the IQR of the hinge (paired t‐test).
-
C, DPlots of gene set enrichment analysis (GSEA) of downregulated genes in Dppa2 KO with genes deregulated in Dppa4 KO (C) and vice versa (D) (fold change [FC], > 5; P < 0.05). NES, normalized enrichment score; fdr, false discovery rate.
-
EVenn diagram showing overlap between DUX‐regulated, DPPA2‐/DPPA4‐regulated, 2C‐like, and ZGA‐specific genes.
-
FDynamics of expression of DPPA2/4‐dependent and DUX‐dependent genes during pre‐implantation embryo development. Gray lines represent the Z‐score of all genes belonging to a cluster, and black lines represent their median values. Percentage values depict the proportion of the two subsets of genes that belong to a specific cluster.
-
GDistance of promoters belonging to specific subgroups of genes from the MERVL regulatory region, MT2_mm.
We overexpressed hemagglutinin (HA)‐tagged forms of DPPA2 (DPPA2‐HA) or DPPA4 (DPPA4‐HA) in the corresponding KO mESCs and found a small increase in the expression of Dux, its downstream targets such as Zscan4 and Tdpoz4, and Mael and Tdrd1 (Fig 3A). When we overproduced DPPA2‐HA and DPPA4‐HA (DPPA2/4) simultaneously in cells depleted for both factors, the expression of Dux, Zscan4, and Tdpoz4 was completely rescued, suggesting that the two factors must be present in equimolar amounts to transactivate Dux, consistent with their acting as heterodimers. However, overexpressing Dppa2/4 in addition to Dux in mESCs carrying a MERVL‐GFP reporter did not activate further DUX targets (Fig EV3A and B). Moreover, overexpressing Dppa2/4 in Dux KO mESCs did not rescue the expression of DUX targets, confirming that DPPA2/4 act upstream of DUX (Fig EV3C and D).
Figure 3. DPPA2 and DPPA4 associate with the promoter of their target genes in mESCs.

- Comparative expression by qPCR of Dux, two downstream targets of DUX (Zscan4 and Tdpoz4), and three targets of DPPA2 and DPPA4 independent of DUX (Mael and Tdrd1) in mESCs depleted of endogenous DPPA2 and DPPA4 and overexpressing ectopically DPPA2, DPPA4, or GFP as a control. Expression was normalized to Actb. Bars represent the average and error bars the SD; n = 3. *P ≤ 0.05, **P ≤ 0.01, ***P ≤ 0.001, unpaired t‐test.
- Average coverage normalized for sequencing depth of the ChIP‐seq signal of DPPA2, DPPA4, or DPPA4 truncated of the SAP domain overexpressed in mESCs in a window of 500 bp around the Dux gene (n = 2). Total input (TI) is shown in gray. Peaks over the Dux gene were called in DPPA2, DPPA4, and DPPA4ΔSAP ChIP‐seq.
- Heatmap showing the distribution of DUX, DPPA2, DPPA4, and DPPA4ΔSAP coverage in a ± 5‐kb window around the TSS of DUX‐dependent, DPPA2‐ and DPPA4‐dependent, and random genes in mESCs.
- Boxplot/Jitterplot representing the percentage of GC nucleotide contents in the peaks from DPPA2 (9,497), DPPA4 (8,239), and DUX (8,874) ChIP, and in a random shuffle of peaks. Box limits, twenty‐fifth and seventy‐fifth percentiles; lines in the boxes, median. The upper whisker extends from the hinge to the largest value, no further than 1.5× the interquartile range (IQR) from the hinge. The lower whisker extends from the hinge to the smallest value, at most 1.5× the IQR of the hinge (paired t‐test).
Figure EV3. DPPA2 and DPPA4 directly regulate expression of target genes.

-
A, BFraction of GFP+ cells (A) or Dux, Zscan4, Tdpoz4, Mael, and Tdrd1 gene expression (B) in mESCs carrying a MERVL‐GFP reporter and overexpressing DUX alone, DPPA2 and DPPA4, or the three transgenes together. Expression was normalized to Actb. Bars represent the average and error bars the SD; n = 3.
-
C, DFraction of GFP+ cells (C) or Zscan4, Tdpoz4, Mael, and Tdrd1 gene expression (D) in Dux KO mESCs carrying a MERVL‐GFP reporter and overexpressing DUX or DPPA2 and DPPA4. Expression was normalized to Actb. Bars represent the average and error bars the SD; n = 3.
-
EHeatmap representing the enrichment of DUX, DPPA2, DPPA4, and DPPA4ΔSAP binding at TSS of DPPA2/4‐dependent or DUX‐dependent genes or a random set of 1,000 genes (analysis in Fig 3C).
-
FComparative expression of genes bound by DPPA2 and DPPA4 at the promoter (1,155) or a random set of genes in Dppa2 KO, Dppa4 KO, and WT mESCs. Box limits, twenty‐fifth and seventy‐fifth percentiles; lines in the boxes, median. The upper whisker extends from the hinge to the largest value, no further than 1.5× the interquartile range (IQR) from the hinge. The lower whisker extends from the hinge to the smallest value, at most 1.5× the IQR of the hinge (paired t‐test).
-
GComparative expression of DUX‐dependent (n = 300) and DPPA2‐/DPPA4‐dependent (n = 1,288) genes and the rest of the genes in WT or Dppa4 KO mESCs expressing ectopically DPPA4 or DPPA4ΔSAP. Box limits, twenty‐fifth and seventy‐fifth percentiles; lines in the boxes, median. The upper whisker extends from the hinge to the largest value, no further than 1.5× the interquartile range (IQR) from the hinge. The lower whisker extends from the hinge to the smallest value, at most 1.5× the IQR of the hinge (paired t‐test).
-
HFold enrichment of DPPA2 and DPPA4 ChIP–qPCR in Dppa2 or Dppa4 KO mESCs at the promoter of Zscan4c (negative control), Dux, and two direct targets of DPPA4 (Mael and Tdrd1), compared to Tubb promoter. Bars represent the average and error bars the SD; n = 3. *P ≤ 0.05, ***P ≤ 0.001, unpaired t‐test.
DPPA2 and DPPA4 bind the promoters of Dux and other target genes
Chromatin immunoprecipitation studies revealed that both DPPA2 and DPPA4 associate with the 5′ region of genes downregulated in their absence including Dux and that these factors were in contrast not enriched at DUX‐recruiting promoters (Figs 3B and C, and EV3E and F). This strongly suggests that DPPA2 and DPPA4 are direct activators of Dux and secondarily induce genes such as Zscan4 and other DUX‐driven targets. Interestingly, a DPPA4 mutant deleted for the SAP domain was still able to bind the 5′ end of Dux, albeit less strongly than the full‐length protein, and also associated with a sizeable fraction of DPPA4‐controlled genes, the expression of which it could partly rescue by complementation of Dppa4 KO mESCs (Fig EV3G). Therefore, the SAP domain is absolutely not essential for the genomic recruitment or for the transactivating function of DPPA4. Finally, DPPA2 and DPPA4 were less enriched at the promoter of Dux, Mael, and Tdrd1 in mESCs deleted for the reciprocal paralog, compared with control cells (Fig EV3H). This indicates that DPPA2 and DPPA4 are best recruited jointly at target genes, consistent with the recent demonstration of their heterodimerization potential 17. We attempted to delineate more precisely the sequence motifs recognized by DPPA2 and DPPA4 and could only determine that the two proteins favor GC‐rich regions such as found at the 5′ end of Dux or CpG islands (Figs 3D and EV4A–C).
Figure EV4. DPPA2 and DPPA4 bind GC‐rich regions.

- Percentage of GC in a window of ± 1,000 bp around the Dux gene, using a 200‐bp sliding window.
- UCSC screenshots representing the genomic location of the promoters of three genes: Mael, Ddx4, and Dazl. Each screenshot represents from top to bottom: DPPA2, DPPA4, and DPPA4ΔSAP ChIP‐seq, total input, CpG island track, and RefSeq gene annotation.
- Fraction of DPPA2, DPPA4, DPPA4ΔSAP, and DUX ChIP‐seq peaks and a random set of sequences of similar size enriched at CpG island.
DPPA2 and DPPA4 regulate the expression of young LINE‐1s in mESCs
Upon comparing the transposcriptomes (sum of transposable elements‐derived transcripts) of WT and Dppa2‐ and Dppa4‐deleted mESCs, we found that levels of MERVL‐int, L1Md_T, and L1Md_A RNAs dramatically dropped in cells depleted for these factors (Figs 4A and B, and EV5A). Transcription of L1Md_T, but not of L1Md_A or MERVL, was partly rescued when DPPA4 loss was complemented by ectopically expressing its full‐length or truncated forms in the KO cell lines (Fig EV5B). We further determined that, similar to MERVL, L1Md_T and L1Md_A were more expressed in the 2C‐like subpopulation of mESCs (Fig 4C).
Figure 4. DPPA2 and DPPA4 directly regulate expression of young LINE‐1 families in mESCs.

-
A, BTotal expression of transposable element subfamilies in (A) Dppa2 KO or (B) Dppa4 KO compared to WT mESC clones.
-
CRNA‐seq analysis of MERVL‐int (n = 860), L1Md_A (n = 315), and L1Md_T (n = 2,300) in mESCs sorted for expression of both Tomato and GFP reporters driven by MERVL and Zscan4 promoters, respectively, and the double‐negative population. Box limits, twenty‐fifth and seventy‐fifth percentiles; lines in the boxes, median. The upper whisker extends from the hinge to the largest value, no further than 1.5× the interquartile range (IQR) from the hinge. The lower whisker extends from the hinge to the smallest value, at most 1.5× the IQR of the hinge (paired t‐test).
-
DHeatmap displaying the enrichment of DUX, DPPA2, DPPA4, and DPPA4ΔSAP binding at different transposable element families. Every subfamily enriched (P < 0.05) in at least one DPPA2, DPPA4, or DPPA4ΔSAP replicate is shown.
-
EMSAplot of DPPA2, DPPA4, and DPPA4ΔSAP ChIP‐seq in mESCs showing enrichment over L1Md_A, L1Md_T, and MERVL‐int sequences. Gaps are in gray and sequences in white with overlap of color‐coded ChIP–seq signals. Upper plot shows average coverage of the signal over the aligned TEs.
Figure EV5. Young LINE‐1 families are regulated by DPPA2 and DPPA4.

-
AComparative expression of single TE integrants belonging to MERVL‐int (n = 246), L1Md_A (n = 350), and L1Md_T (n = 207) families in Dppa2 KO, Dppa4 KO, or WT mESC clones.
-
BComparative expression of single TE integrants belonging to MERVL‐int (n = 1,300), L1Md_A (n = 2,268), and L1Md_T (n = 1,346) families in WT or Dppa4 KO mESCs expressing ectopically DPPA4 or DPPA4ΔSAP.
-
CComparative expression of MERVL‐int (n = 604), L1Md_A (n = 205), and L1Md_T (n = 126) in WT and Dux KO mESCs.
-
DComparative expression of MERVL‐int (n = 14), L1Md_A (n = 44), and L1Md_T (n = 79) in Dux KO mESCs depleted of DPPA2 or DPPA4 or a control. Box limits, twenty‐fifth and seventy‐fifth percentiles; lines in the boxes, median. The upper whisker extends from the hinge to the largest value, no further than 1.5× the interquartile range (IQR) from the hinge. The lower whisker extends from the hinge to the smallest value, at most 1.5× the IQR of the hinge (paired t‐test).
MERVL is an endogenous retrovirus previously identified as a direct target of DUX, but L1Md_T and L1Md_A are two evolutionarily recent subfamilies of murine LINE‐1 elements, the expression of which was not found to be DUX‐dependent 3, 18. In Dux KO mESCs, expression of MERVL was completely lost but that of L1Md_T and L1Md_A only slightly reduced (Fig EV5C). In contrast, L1Md_T and L1Md_A transcript levels markedly dropped when DPPA2 and DPPA4 were depleted from Dux KO mESCs by RNA interference (Fig EV5D). Furthermore, chromatin immunoprecipitation analyses found HA‐tagged forms of DPPA2 and DPPA4 enriched at the 5′ end of L1Md_T and L1Md_A, but not MERVL‐int (Fig 4D and E). Interestingly, the 5′ untranslated region of LINE‐1 responsible for recruiting DPPA2 and DPPA4 has a high GC‐content 19. Of note, deleting the SAP domain of DPPA4 reduced its recruitment at L1Md_A but not L1Md_T integrants (Fig 4D and E).
Conclusions
This work identifies DPPA2 and DPPA4 as activators of Dux and LINE‐1 retrotransposons induced during murine ZGA and in 2C‐like mESCs. The presence of DPPA2 and DPPA4 transcripts at fertilization and the partial requirement of maternal DPPA4 further suggest that the two proteins promote expression of Dux and LINE‐1 in murine early embryos 9. We found high levels of Dppa2 throughout pre‐implantation development, while two different isoforms of Dppa4 were detected: low levels of the full‐length form in oocytes and zygotes, and a form lacking the SAP domain expressed from ZGA to blastocyst. While the SAP domain of DPPA4 was found to foster its nuclear localization 9, we observed that DPPA4ΔSAP was still able to bind the promoters and activate expression of some of the gene and transposon targets of the full‐length protein, albeit with reduced efficiency. Still, presence of distinct DPPA4 isoforms in the zygote and after cleavage suggests that they fulfill different functions in the totipotent cell and at later stages of pre‐implantation development. In Xenopus, gastrulation requires the Dppa2/4 C‐terminal domain, whereas the SAP domain is needed for later stages of embryonic development, reminiscent of the differential expression pattern of its murine ortholog 5.
DPPA2 and DPPA4 control both Dux and LINE‐1 transcription in mESCs. Interestingly, it was recently demonstrated that LINE‐1 transcripts are necessary for TRIM28/Nucleolin‐mediated repression of Dux in mESCs and in pre‐implantation embryos 20. Our results suggest that DPPA2 and DPPA4 influence a negative feedback loop involving Dux and its transcriptional repressors, which might explain how Dux is expressed as a brief pulse in pre‐implantation embryos and in cycling 2C‐like mESCs.
How DPPA2 and DPPA4 activate their targets remains to be formally determined. A high enrichment in heterochromatin marks, including DNA methylation and histone 3 lysine 9 dimethylation (H3K9me2), is found at promoters of genes regulated by DPPA4 in mESCs depleted for this factor 9. Moreover, we found DPPA2 and DPPA4 strongly associated with CpG islands, genomic features localized in regulatory regions and often modulated epigenetically by DNA methylation. Finally, general loss of the repressive chromatin mark histone 3 lysine 9 trimethylation (H3K9me3) was detected in mouse embryonic fibroblasts (MEFs) reprogrammed to induced pluripotent stem cells (iPSCs) when DPPA2 and DPPA4 were ectopically overexpressed 17. All this suggests that DPPA2 and DPPA4 may bind and remodel the chromatin at the promoter of target genes to create an active environment and prevent the recruitment of repressor complexes.
Materials and Methods
Cell lines and tissue culture
J1 mESCs (ATCC) were cultured in feeder‐free conditions on 0.1% gelatin‐coated tissue culture plates in Dulbecco's modified Eagle's medium (Sigma) containing 15% fetal bovine serum (FBS, HyClone; Fisher Scientific) and supplemented with GlutaMAX (GIBCO), nonessential amino acids (Sigma), 2‐mercaptoethanol (GIBCO), and 1,000 U/ml leukemia inhibitory factor (LIF; Millipore). WT and DUX KO E14 mESCs containing the MERVL regulatory sequence driving expression of a 3XturboGFP‐PEST 21 were cultured on 0.1% gelatin‐coated tissue culture plates in 2i medium 1. 293T cells were maintained in DMEM supplemented with 10% FCS. All cells were regularly checked for the absence of mycoplasma contamination.
Plasmids and lentiviral vectors
Three single‐guide RNAs (sgRNAs) targeting sequences flanking Dppa2 and Dppa4 (Fig 1A) were cloned into px459 (version 2) using a standard protocol 1. Table EV1 shows the primers used to clone the sgRNAs. The pLKO.1‐puromycin shRNA vectors for Dppa2 and Dppa4 knockdown were ordered from Sigma (TRCN0000174599, TRCN0000175923, TRCN0000329372, TRCN0000329374) 1. Dppa2 and Dppa4 cDNAs were both cloned from the genome of J1 mESCs and ordered as codon optimized for expression in mouse cells, and Dppa4 ΔSAP was cloned from the genome of B62F1 blastocysts in a pDONR221 without STOP codon. The ORFs were then shuttled in a pTRE‐3HA, which produces proteins with three C‐terminal HA tags. The cDNAs, including Dux, followed by HA tags were finally cloned into a pWPTs‐GFP HIV1‐based transfer vector in place of the GFP reporter using the In‐Fusion® HD Cloning Kit (Clontech) and the primers shown in Table EV1. pMD2‐G encodes the vesicular stomatitis virus G protein (VSV‐G). The minimal HIV‐1 packaging plasmid 8.9NdSB carrying a double mutation in the capsid protein (P90A/A92E) was used to achieve higher transduction of the lowly permissive mESCs 22.
Production of lentiviral vectors and transduction and transfection of mammalian cells
Lentiviral vectors were produced by transfection of 293T cells using polyethylenimine (PEI) (Sigma, Inc.) 22. To generate stable KDs, mESCs were transduced with empty pLKO.1 vector or vectors containing the shRNA targeting Dppa2 or Dppa4 transcripts. Cells were selected with 0.4 μg/ml puromycin starting 1 day after transduction. To express HA‐tagged DPPA2 or DPPA4, mESCs were transduced with the pWPTs‐DPPA2 or pWPTs‐DPPA4 lentiviral vectors (for ChIP‐seq and RNA‐seq analyses of Figs 2, 3, 4) or transfected with the codon‐optimized versions using Lipofectamine 3000 (Thermo Fisher Scientific; for qPCR analysis in Figs 3A and EV3A–D).
Creation of KO mESC lines
J1 mESCs were co‐transfected with px459 plasmids encoding for Cas9, the appropriate sgRNAs, and puromycin resistance cassette by nucleofection (Amaxa™ P3 Primary Cell 4D‐Nucleofector™ X Kit). Twenty‐four hours later, the cells were selected for 48 h with 0.4 μg/ml puromycin, single‐cell‐cloned by serial dilution, and expanded, and their DNA was extracted to detect the presence of WT and/or KO alleles. Three WT, three homozygous Dppa2 KO, three homozygous Dppa4 KO, and three homozygous Dppa2 and Dppa4 KO clones were selected and used in this study.
Fluorescence‐activated cell sorting (FACS)
FACS analysis was performed with a BD FACScan system. mESCs containing the MERVL‐GFP reporter were subjected to FACS sorting with AriaII (BD Biosciences).
Standard PCR, RT–PCR, and RNA sequencing
For the genotyping of Dppa2 and Dppa4 WT and KO alleles, genomic DNA was extracted with DNeasy Blood & Tissue Kits (QIAGEN) and the specific PCR products were amplified using PCR Master Mix 2X (Thermo Scientific) combined with the appropriate primers (design in Fig 1A; primer sequences in Table EV1).
Total RNA from cell lines was isolated using the High Pure RNA Isolation Kit (Roche). cDNA was prepared with SuperScript II reverse transcriptase (Invitrogen). Primers listed in Table EV1 were used for SYBR Green qPCR (Applied Biosystems). Library preparation and 75‐base pair paired‐end RNA‐seq were performed using standard Illumina procedures for the NextSeq 500 platform. RNA‐seq data generated in this study are available on GEO (GSE126621).
GC‐content analysis
GC‐content of DPPA2, DPPA4, and DUX peaks was done first by converting bed files to fasta with bedtools suite and then by using a home‐made perl script to count DNA bases. For measurement of GC‐content in DUX gene, a 200‐bp sliding window was used.
ChIP and ChIP sequencing
ChIP and library preparation were performed as described previously 1. DPPA2‐HA and DPPA4‐HA ChIP was done using the anti‐HA.11 (Covance) antibody. Sequencing was performed with Illumina NextSeq 500 in 75‐bp paired‐end reads run. ChIP‐seq data generated in this study are available on GEO (GSE126621).
RNA‐seq datasets processing
RNA‐seq of Dppa2/4 KO versus WT and Dux KO versus WT mESCs 1 was mapped to mm9 genome using hisat2 aligner 23 for stranded and paired‐end reads with options ‐k 5 –rna‐strandness RF –seed 42 ‐p 7. Counts on genes and TEs were generated using featureCounts 24 with options ‐p ‐s 2 ‐T 4 ‐t exon ‐g gene_id ‐Q 10, using a gtf file containing both genes and TEs to avoid ambiguity when assigning reads. For repetitive sequences, an in‐house curated version of the mm9 open‐3.2.8 version of RepeatMasker database was used (fragmented LTR and internal segments belonging to a single integrant were merged) 25. Single‐cell RNA‐seq of 2C‐like cells (E‐MTAB‐5058) datasets was downloaded from GEO 16. The processing of the single‐cell RNA‐seq datasets followed a previously published pipeline. Single‐cell RNA‐seq mouse early embryo development data were reanalyzed from 1.
RNA‐seq analysis
Normalization for sequencing depth and differential gene expression analysis was performed using Voom as it has been implemented in the limma package of Bioconductor, with total number of reads on genes as size factor 1. TEs overlapping exons or having < 1 read per sample in average were removed from the analysis. To compute total number of reads per TE family/subfamily, counts on all integrants were summed up using multi‐mapping read counts with fractions (featureCounts with options ‐M –fraction ‐p ‐s 2 ‐T 4 ‐t exon ‐g gene_id ‐Q 0) to compensate for potential bias in repetitive elements. Gene expression clustering in murine pre‐implantation embryos was performed as previously described 1.
ChIP‐seq data processing
ChIP‐seq dataset of DUX overexpressed in mESCs (GSE85632) was downloaded from GEO 2. Reads were mapped to the mouse genome assembly mm9 using Bowtie2 using the sensitive‐local mode. MACS2 (the exact parameters are as follows: macs2 callpeak ‐t $chipbam ‐c $tibam ‐f BAM ‐g $org ‐n $name ‐B ‐q 0.01 –format BAMPE) was used to call peaks 1. To compute the percentage of bound TE integrants in each family, we used bedtools suite.
Methodology for statistics
Enrichment of TE subfamilies was done using hypergeometric tests, comparing the number of peaks having at least 50% overlap with TEs to the expected number. Enrichment of peaks around TSS also used a hypergeometric test to compare the occurrence of peaks in a subset of TSS to the expected. When the expression data were compared between two conditions, a paired Student's t‐test was used. To correct for different sample sizes, we used 1,000 subsampling permutations using the smallest sample size to get the median P‐value. For comparing enrichment between Dppa2 and Dppa4 downregulated genes, a gene set enrichment analysis was used with phenoTest library from Bioconductor with default options.
Coverage plots
Raw ChIP‐seq data were mapped on an index containing only the Dux gene using the same parameters as described in the methods when mapping on the genome. ChIP‐seq signals on the locus were extracted from the bigWigs and normalized for sequencing depth (reads per hundred millions when mapped on genome) using the pyBigWig python library. Replicate signals were averaged and then smoothed using a running average of window 250 bp prior to plotting.
MSAplot
Fasta sequences for the TE families of interest were extracted from the mm9 genome assembly and aligned using the mafft aligner with the following parameters: –auto –reorder. Regions in the alignment consisting of more than 95% of gaps were trimmed out. For each integrant in the family, the ChIP‐seq signal was extracted from the bam, scaled to the interval [0, 1], and plotted on top of the alignment using python. Finally, the average of the signals was plotted on top of the MSAplot.
Author contributions
ADI and DT conceived the project, designed the experiments, analyzed the data, and wrote the manuscript; ADI carried out the experiments; and AC and JD performed the bioinformatics and statistical analyses.
Conflict of interest
The authors declare that they have no conflict of interest.
Supporting information
Expanded View Figures PDF
Table EV1
Review Process File
Acknowledgements
We thank Sonia Verp, Sandra Offner, and the Gene Expression and Flow Cytometry Core Facilities (EPFL) for technical assistance. This work was financed through grants from the Swiss National Science Foundation, the Gebert‐Rüf Foundation, FP7 MC‐ITN INGENIUM (290123), and the European Research Council (ERC 694658) to D.T.
EMBO Reports (2019) 20: e47382
References
- 1. De Iaco A, Planet E, Coluccio A, Verp S, Duc J, Trono D (2017) DUX‐family transcription factors regulate zygotic genome activation in placental mammals. Nat Genet 49: 941–945 [DOI] [PMC free article] [PubMed] [Google Scholar]
- 2. Hendrickson PG, Dorais JA, Grow EJ, Whiddon JL, Lim JW, Wike CL, Weaver BD, Pflueger C, Emery BR, Wilcox AL et al (2017) Conserved roles of mouse DUX and human DUX4 in activating cleavage‐stage genes and MERVL/HERVL retrotransposons. Nat Genet 49: 925–934 [DOI] [PMC free article] [PubMed] [Google Scholar]
- 3. Whiddon JL, Langford AT, Wong CJ, Zhong JW, Tapscott SJ (2017) Conservation and innovation in the DUX4‐family gene network. Nat Genet 49: 935–940 [DOI] [PMC free article] [PubMed] [Google Scholar]
- 4. Jachowicz JW, Bing X, Pontabry J, Boskovic A, Rando OJ, Torres‐Padilla ME (2017) LINE‐1 activation after fertilization regulates global chromatin accessibility in the early mouse embryo. Nat Genet 49: 1502–1510 [DOI] [PubMed] [Google Scholar]
- 5. Siegel D, Schuff M, Oswald F, Cao Y, Knochel W (2009) Functional dissection of XDppa2/4 structural domains in Xenopus development. Mech Dev 126: 974–989 [DOI] [PubMed] [Google Scholar]
- 6. Aravind L, Koonin EV (2000) SAP ‐ a putative DNA‐binding motif involved in chromosomal organization. Trends Biochem Sci 25: 112–114 [DOI] [PubMed] [Google Scholar]
- 7. Maldonado‐Saldivia J, van den Bergen J, Krouskos M, Gilchrist M, Lee C, Li R, Sinclair AH, Surani MA, Western PS (2007) Dppa2 and Dppa4 are closely linked SAP motif genes restricted to pluripotent cells and the germ line. Stem Cells 25: 19–28 [DOI] [PubMed] [Google Scholar]
- 8. Bortvin A, Eggan K, Skaletsky H, Akutsu H, Berry DL, Yanagimachi R, Page DC, Jaenisch R (2003) Incomplete reactivation of Oct4‐related genes in mouse embryos cloned from somatic nuclei. Development 130: 1673–1680 [DOI] [PubMed] [Google Scholar]
- 9. Madan B, Madan V, Weber O, Tropel P, Blum C, Kieffer E, Viville S, Fehling HJ (2009) The pluripotency‐associated gene Dppa4 is dispensable for embryonic stem cell identity and germ cell development but essential for embryogenesis. Mol Cell Biol 29: 3186–3203 [DOI] [PMC free article] [PubMed] [Google Scholar]
- 10. Nakamura T, Nakagawa M, Ichisaka T, Shiota A, Yamanaka S (2011) Essential roles of ECAT15‐2/Dppa2 in functional lung development. Mol Cell Biol 31: 4366–4378 [DOI] [PMC free article] [PubMed] [Google Scholar]
- 11. Engelen E, Brandsma JH, Moen MJ, Signorile L, Dekkers DH, Demmers J, Kockx CE, Ozgur Z, van IJcken WF, van den Berg DL et al (2015) Proteins that bind regulatory regions identified by histone modification chromatin immunoprecipitations and mass spectrometry. Nat Commun 6: 7155. [DOI] [PMC free article] [PubMed] [Google Scholar]
- 12. Masaki H, Nishida T, Kitajima S, Asahina K, Teraoka H (2007) Developmental pluripotency‐associated 4 (DPPA4) localized in active chromatin inhibits mouse embryonic stem cell differentiation into a primitive ectoderm lineage. J Biol Chem 282: 33034–33042 [DOI] [PubMed] [Google Scholar]
- 13. Macfarlan TS, Gifford WD, Driscoll S, Lettieri K, Rowe HM, Bonanomi D, Firth A, Singer O, Trono D, Pfaff SL (2012) Embryonic stem cell potency fluctuates with endogenous retrovirus activity. Nature 487: 57–63 [DOI] [PMC free article] [PubMed] [Google Scholar]
- 14. Kobayashi H, Sakurai T, Imai M, Takahashi N, Fukuda A, Yayoi O, Sato S, Nakabayashi K, Hata K, Sotomaru Y et al (2012) Contribution of intragenic DNA methylation in mouse gametic DNA methylomes to establish oocyte‐specific heritable marks. PLoS Genet 8: e1002440 [DOI] [PMC free article] [PubMed] [Google Scholar]
- 15. Deng Q, Ramskold D, Reinius B, Sandberg R (2014) Single‐cell RNA‐seq reveals dynamic, random monoallelic gene expression in mammalian cells. Science 343: 193–196 [DOI] [PubMed] [Google Scholar]
- 16. Eckersley‐Maslin MA, Svensson V, Krueger C, Stubbs TM, Giehr P, Krueger F, Miragaia RJ, Kyriakopoulos C, Berrens RV, Milagre I et al (2016) MERVL/Zscan4 network activation results in transient genome‐wide DNA demethylation of mESCs. Cell Rep 17: 179–192 [DOI] [PMC free article] [PubMed] [Google Scholar]
- 17. Hernandez C, Wang Z, Ramazanov B, Tang Y, Mehta S, Dambrot C, Lee YW, Tessema K, Kumar I, Astudillo M et al (2018) Dppa2/4 facilitate epigenetic remodeling during reprogramming to pluripotency. Cell Stem Cell 23: 396–411.e8 [DOI] [PMC free article] [PubMed] [Google Scholar]
- 18. Sookdeo A, Hepp CM, McClure MA, Boissinot S (2013) Revisiting the evolution of mouse LINE‐1 in the genomic era. Mobile DNA 4: 3 [DOI] [PMC free article] [PubMed] [Google Scholar]
- 19. Dai Q, Shen Y, Wang Y, Wang X, Francisco JC, Luo Z, Lin C (2017) Striking a balance: regulation of transposable elements by Zfp281 and Mll2 in mouse embryonic stem cells. Nucleic Acids Res 45: 12301–12310 [DOI] [PMC free article] [PubMed] [Google Scholar]
- 20. Percharde M, Lin CJ, Yin Y, Guan J, Peixoto GA, Bulut‐Karslioglu A, Biechele S, Huang B, Shen X, Ramalho‐Santos M (2018) A LINE1‐Nucleolin partnership regulates early development and ESC identity. Cell 174:391–405.e19 [DOI] [PMC free article] [PubMed] [Google Scholar]
- 21. Ishiuchi T, Enriquez‐Gasca R, Mizutani E, Boskovic A, Ziegler‐Birling C, Rodriguez‐Terrones D, Wakayama T, Vaquerizas JM, Torres‐Padilla ME (2015) Early embryonic‐like cells are induced by downregulating replication‐dependent chromatin assembly. Nat Struct Mol Biol 22: 662–671 [DOI] [PubMed] [Google Scholar]
- 22. De Iaco A, Santoni F, Vannier A, Guipponi M, Antonarakis S, Luban J (2013) TNPO3 protects HIV‐1 replication from CPSF6‐mediated capsid stabilization in the host cell cytoplasm. Retrovirology 10: 20 [DOI] [PMC free article] [PubMed] [Google Scholar]
- 23. Kim D, Langmead B, Salzberg SL (2015) HISAT: a fast spliced aligner with low memory requirements. Nat Methods 12: 357–360 [DOI] [PMC free article] [PubMed] [Google Scholar]
- 24. Liao Y, Smyth GK, Shi W (2014) featureCounts: an efficient general purpose program for assigning sequence reads to genomic features. Bioinformatics 30: 923–930 [DOI] [PubMed] [Google Scholar]
- 25. Ecco G, Cassano M, Kauzlaric A, Duc J, Coluccio A, Offner S, Imbeault M, Rowe HM, Turelli P, Trono D (2016) Transposable elements and their KRAB‐ZFP controllers regulate gene expression in adult tissues. Dev Cell 36: 611–623 [DOI] [PMC free article] [PubMed] [Google Scholar]
Associated Data
This section collects any data citations, data availability statements, or supplementary materials included in this article.
Supplementary Materials
Expanded View Figures PDF
Table EV1
Review Process File