

Abstract
Many archaea swim by means of archaella. While the archaellum is similar in function to its bacterial counterpart, its structure, composition, and evolution are fundamentally different. Archaella are related to archaeal and bacterial type IV pili. Despite recent advances, our understanding of molecular processes governing archaellum assembly and stability is still incomplete. Here, we determine the structures of Methanococcus archaella by X‐ray crystallography and cryo‐EM. The crystal structure of Methanocaldococcus jannaschii FlaB1 is the first and only crystal structure of any archaellin to date at a resolution of 1.5 Å, which is put into biological context by a cryo‐EM reconstruction from Methanococcus maripaludis archaella at 4 Å resolution created with helical single‐particle analysis. Our results indicate that the archaellum is predominantly composed of FlaB1. We identify N‐linked glycosylation by cryo‐EM and mass spectrometry. The crystal structure reveals a highly conserved metal‐binding site, which is validated by mass spectrometry and electron energy‐loss spectroscopy. We show in vitro that the metal‐binding site, which appears to be a widespread property of archaellin, is required for filament integrity.
Keywords: archaea, cryo‐EM, electron energy‐loss spectroscopy, helical reconstruction, Methanococcus
Subject Categories: Microbiology, Virology & Host Pathogen Interaction; Structural Biology
Introduction
Motility is widespread throughout the prokaryotic world. The most common motility organelle in bacteria is a rotating flagellar filament ~ 20 nm in diameter, while in archaea it is the much thinner filament (typically 10–14 nm in diameter) now known as the archaellum (formerly archaeal flagellum 1). Although bacterial flagella and archaella share similar functions, their structures, compositions, and modes of assembly are fundamentally different. Archaella are composed of a limited number of Fla proteins, most of which are encoded in a single operon. None of these proteins shows homology to any bacterial flagellar proteins, but several are homologs of proteins pertaining to type IV pili 2, 3. Archaea often thrive in extreme environments, where their external structures, including archaella, may be exposed to wide ranges of temperature, pH, and salt concentration. The enhanced resistance of archaeal filaments to extreme environmental conditions makes them attractive objects from both fundamental and biotechnological points of view. Archaellins are the main protein components of the archaellum and represent the structural analogs of bacterial flagellins. In euryarchaeotes, archaella are characterized by the presence of multiple (≥ 5) archaellin proteins. Such multiplicity is assumed to be important for assembly of functional archaella, since deletion of individual archaellin genes often leads to non‐archaellated cells 4, 5, 6. Archaellin amino acid sequences are unrelated to those of bacterial flagellins, but they have homology to type IV pilins at their N‐termini 7. Like type IV pilins, archaellins are synthesized as preproteins with type IV pilin‐like (class III) signal peptides that are cleaved by a specific membrane‐located signal peptidase (FlaK/PibD), homologous to prepilin peptidase in type IV pili systems 5, 8, 9. Cleavage of the signal peptide is essential for incorporation of archaellins into the archaellum 8. Despite significant conservation of the N‐termini of archaellins and type IV pilins that form the cores of the corresponding structures, their packing is different 10, 11, 12. In contrast to bacterial analogs, archaellin structures are not well studied. Until recently, the best available pioneering structures of archaella, from the extreme halophile Halobacterium salinarum and the thermoacidophile Sulfolobus shibatae, were determined at resolutions too low to resolve subunit domains, but they did reveal the absence of an internal channel found in bacterial flagella and thus supported a model of assembly from their base 13, 14, 15, 16. Recently, two cryo‐EM reconstructions of archaellar filaments 11, 17, as well as an archaella‐like adhesion structure in Ignicoccus hospitalis 12, have clarified the general structure of archaellin and its biological assembly. These were the first cryo‐EM‐based structures of an archaellum at a level of resolution to trace secondary structure elements with confidence. They revealed the fundamentally different structure of archaeal filaments compared to bacterial flagella and type IV pili. Daum et al 17 further described the structure of the archaellum motor complex of Pyrococcus furiosus (PDB code 5O4U) by cryo‐electron tomography. To understand archaellar structure at the atomic level, we have used a hybrid approach by combining X‐ray crystallography and cryo‐EM. We solved the crystal structure of an N‐terminal truncation construct of archaellin FlaB1 from the hyperthermophilic methanogen, Methanocaldococcus jannaschii, at a resolution of 1.5 Å. Our data reveal a highly conserved metal‐binding site, a feature not previously described for archaellins. Simultaneously, we determined the structure of the archaellar filament from the mesophile Methanococcus maripaludis, using cryo‐EM at 4 Å resolution to provide the biological context.
Results and Discussion
Crystal structure of the globular domain of Methanocaldococcus jannaschii FlaB1 archaellin
Archaellins possess highly conserved and mostly hydrophobic N‐terminal sequences. Their N‐terminal regions form α‐helices, which are important for filament formation. To prevent aggregation and improve protein solubility, we prepared a truncated version of archaellin FlaB1 of M. jannaschii, containing residues 39–205 of the mature protein with a C‐terminal His6 tag. FlaB1Δ1–38 crystallized in the P212121 space group with two molecules in its asymmetric unit. The structure was solved by multiple isomorphous replacement and refined to 1.5 Å resolution (Table EV1). Each molecule in the asymmetric unit comprises residues 47–205. No electron density was observed for residues 39–46 at the N‐terminus. This region is predicted to form an α‐helix, which was later confirmed in the biological assembly by our cryo‐EM map. In contrast, in bacterial pilins, the C‐terminal half of the hydrophobic α‐helix is embedded in the β‐sheet of its globular domain 18, 19, 20. The globular domain consists of several β‐strands that fold into a β‐barrel (Fig 1A). Within this structure, a region in one of the β‐hairpins had a strong anomalous signal. Structural analysis with ConSurf 21 showed that these residues are highly conserved (Fig 1B and C). No metal ions were present in the crystallization solution. The geometry of the binding site suggested that the binding metal in M. jannaschii FlaB1Δ1–38 is likely Ca (2F o−F c map in Figs 1D and EV1). Refinement of the crystal structure with Ca ions at full occupancy resulted in B factors for Ca ions of 10.1 Å2 in chain A and 17.5 Å2 in chain B, which are close to environmental B factors of coordinating atoms of 9.9 and 16.8 Å2, respectively. The metal ion is coordinated by the side chains of residues D139, D141, S143, N150, and D153, and one water molecule (Figs 1D and EV1). Systematic sequence comparison shows that this metal‐binding site exists in a wide range of Euryarcheota (Figs EV2A and 2B). A database search performed with DALI 22 revealed that the closest structural homolog of M. jannaschii FlaB1 is archaellin FlaB0 from P. furiosus (PDB code 5O4U; Z‐score = 22; RMSD = 1.6; Fig EV2C). Although FlaB0 possesses all conserved metal‐binding residues, metal binding was not incorporated in their cryo‐EM‐based model 17.
Figure 1. Archaellin fold and metal‐binding site.
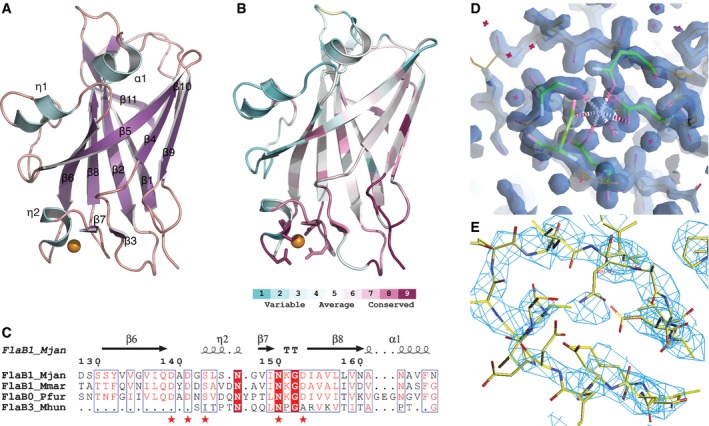
- Crystal structure of archaellin FlaB1Δ1–38 of Methanocaldococcus jannaschii. Ribbon representation colored by secondary structure (purple: β‐strands, cyan: α‐helical fold).
- Same view of the folded polypeptide chain colored by conservation index among 100 archaellin homologs (purple: highly conserved, turquoise: variable sequence). Metal‐binding site shows side‐chain conformations.
- Aligned sequences from FlaB proteins (Methanocaldococcus jannaschii, Methanococcus maripaludis, Pyrococcus furiosus, Methanospirillum hungatei) containing the highly conserved metal‐binding site (marked by red stars). Full alignment in Fig EV5.
- 2F o−F c electron density map around the metal‐binding site of M. jannaschii FlaB1Δ1–38 solved by X‐ray crystallography to 1.5 Å resolution (iso‐electron density representation at 1.0σ). Metal‐coordinating amino acid side chains are highlighted in green. Metal atom density at center. Stereo view in Fig EV1.
- Reconstructed cryo‐EM electron potential map at 4.0 Å resolution (iso‐potential surface contoured at 3.5σ above average, map low‐pass filtered at 3.7 Å) of Me. maripaludis FlaB1 region displayed in the same orientation and at similar scale as (D). The single coordinated metal atom is clearly resolved in the cryo‐EM map.
Figure EV1. The metal‐binding site of Methanocaldococcus jannaschii FlaB1.
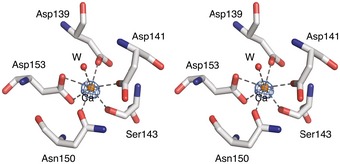
Stereo representation of the residues surrounding the metal ion in the crystal structure of M. jannaschii FlaB1. The anomalous difference density in the X‐ray crystallography map is shown as a blue mesh at a contour level of 5σ. W = water molecule. The coordination geometry and refinement statistics suggest that the bound metal in this sample is calcium. The protein was purified in vitro after recombinant expression in Escherichia coli. It is possible that a different divalent cation would be bound under native conditions.
Figure EV2. Sequence and structure alignments.
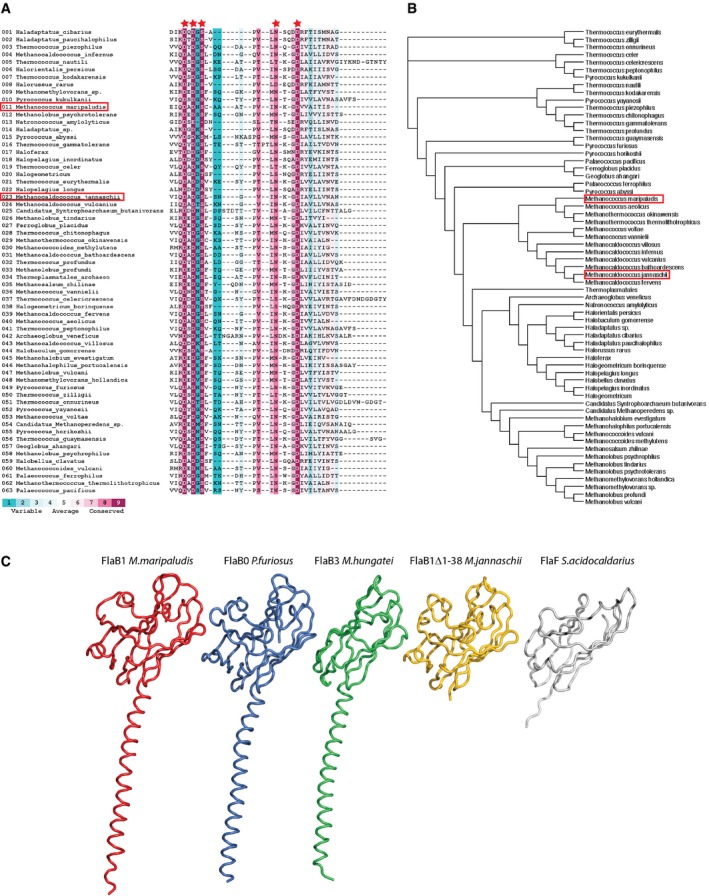
- Multiple sequence alignment of Archaellins from species among Euryarcheota showing metal‐binding region. The metal‐binding residues (red stars) are highly conserved. A search with ConSurf 21 in the UNIREF90 database using the Methanocaldococcus jannaschii sequence as a template revealed 63 unique matches (only highest scoring protein displayed per organism).
- Phylogenetic tree of Archaellins found in (A). Methanocaldococcus jannaschii and Methanococcus maripaludis are frames in red.
- Multiple structure alignment in ribbon representations of FlaB1 Me. maripaludis (red), FlaB0 Pyrococcus furiosus (blue), FlaB3 Methanospirillum hungatei (green), FlaB1Δ1–38 M. jannaschii (yellow), and FlaF Sulfolobus acidocaldarius (white).
Figure 2. Cryo‐EM of archaellum.
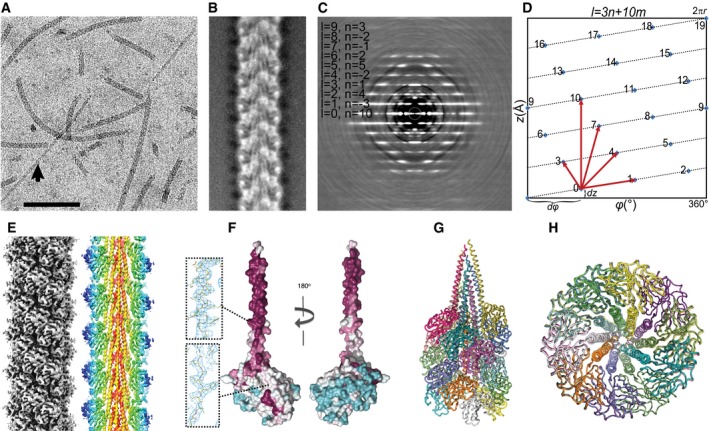
- Fragmented archaella of Methanococcus maripaludis imaged in amorphous ice. Occasionally, the sample contained a thinner “minor” filament (arrow). Scale bar, 100 nm.
- Representative class average after alignment of filament segments and classification into 100 classes. α‐helices in the core are clearly visible.
- Indexed cropped helical diffraction pattern. Resolution at edge 5.6 Å.
- The 10‐start interaction in axial direction is evident in the unrolled helical lattice (horizontal axis: azimuthal angle φ in degrees, vertical: axial rise z in Ångstrom), which is unique among helical assemblies. Selection rule: l = 3n + 10m. Blue diamonds depict numbered subunit positions along the helical lattice. The rise of a single subunit dz is 5.7 Å, and the rotation/subunit dφ is 108°. Red arrows indicate lattice directions in the 1‐, 3‐, 4‐, 7‐, and 10‐start directions. The true pitch of the helix, where the subunits restart their helical pattern precisely, is reached after three full rotations (10 subunits, 57 Å) and is indicated by the long red arrow in the 10‐start direction.
- Symmetrized cryo‐EM 3D‐reconstruction. Left: Shaded iso‐potential surface view contoured at 4σ. The grooved 3‐start lattice dominates the appearance of the filament. Right: Slab through reconstruction in axial direction (colored by cylinder radius) reveals α‐helical core structure and β‐sheets at the periphery. In projection, the α‐helices running in axial (10‐start) direction are perfectly lined up near the center.
- Space‐filled representation of complete subunit model color‐coded by conservation. Individual subunit has a tadpole‐like shape with its highly conserved (purple) α‐helical tail buried inside the core and its head domain containing variable sequence (cyan) residues exposed to solvent. Total length of subunit is 115 Å. Inserts show samples of iso‐electron potential surface of cryo‐EM reconstruction contoured at 2.5σ.
- Worm model of biological assembly with individually colored subunits.
- Radial slab through model, revealing the strong 10‐fold symmetry.
Cryo‐EM analysis
We prepared cryo‐EM samples of archaella from the mesophile Me. maripaludis, because it is difficult to grow the hyperthermophile M. jannaschii and since all our attempts to obtain crystals of full‐length archaellin from Me. maripaludis were unsuccessful. FlaB1 proteins of Me. maripaludis and M. jannaschii share high level of sequence homology, with identity/similarity of 56.2 and 70.5%, respectively. Archaella from Me. maripaludis embedded in amorphous ice were clearly visible in cryo‐EM images (Fig 2A). Image segments were aligned and classified into 100 classes that displayed much improved detail and contrast (Fig 2B and Table EV2). The average filament diameter was ~ 100 Å. As reported also by Poweleit et al in their samples of archaella from Methanospirillum hungatei (PDB code 5TFY), we occasionally observed “minor” filaments with a diameter of approximately 5–7 nm (Fig 2A, arrow, Fig EV3A). After initial analysis, its structural features appeared to be most consistent with the architecture of type IV pili, another surface appendage present in Me. maripaludis 23, 24. We reconstructed the archaellum from Me. maripaludis in three dimensions (3D) using single‐particle cryo‐EM and helical analysis. Because a real‐space symmetry search can lead to ambiguities, we used the classic method of analyzing the helical diffraction pattern to obtain the helical symmetry operator. This layer line pattern, which corresponds to the projected Fourier transform of the object, is an average of the power spectra of all aligned boxed filament segments, with much improved signal‐to‐noise ratio (SNR; Fig 2C). Helical analysis of this layer line pattern allowed us to construct a lattice, which corresponds to the unrolled pattern of features on the surface of a cylinder surrounding the tubular helix 25, that follows the selection rule l = 3n + 10m (Fig 2D). We determined the absolute handedness of the basic (or 1‐start) helix, which is right‐handed, using metal shadowing and verified the correct hand by docking the crystal structure into the reconstruction. The true pitch of the basic helix, which is the axial displacement after which the helical pattern repeats exactly, is 57 Å and contains a set of 10 subunits (rise = 5.7 Å per subunit, rotation 108°). Using this helical operator, we reconstructed the helix in 3D from aligned image segments, followed by iterative refinement using SPRING 26 (Fig 2E and Table EV2).
Figure EV3. Appearance of minor filament, resolution measurement, and diffraction analysis.
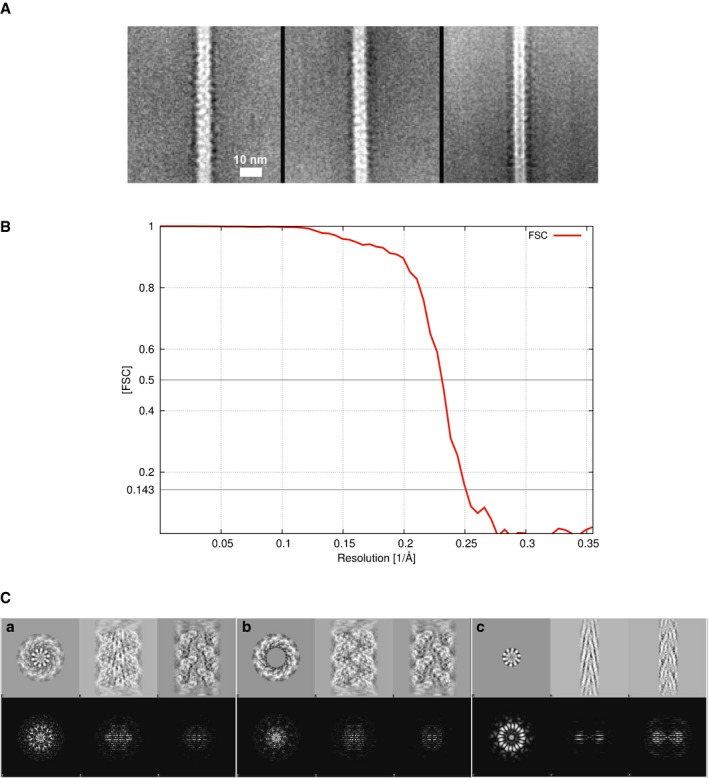
- Minor filament. Three class averages of “minor” filaments, which were occasionally (approximately 1% of all filaments) observed, containing ˜ 100 images/class. These structures have a diameter of 5–7 nm and a fundamentally different appearance than the archaellum core.
- Spatial resolution of cryo‐EM reconstruction of Methanococcus maripaludis archaellum. The resolution measurement by Fourier shell correlation between independently refined data sets containing half of the particle images each indicates 4.0 Å (FSC = 0.143). A soft‐edged cylindrical mask was applied to both reconstructions.
- Layer line patterns caused by structural features. The cryo‐EM reconstruction of the Me. maripaludis archaellum was masked with a cylindrical mask in order to better understand which structural feature give rise to spots in the layer line pattern. Three orthogonal views are shown (top row) with their respective power spectra (bottom row). (a) Full structure, (b) central α‐helical core masked out, (c) central core only. Box dimensions are 180 Å (top row). Nyquist limit at the edge of the power spectra is at 2.8 Å (bottom row).
The archaellum appears enforced by a three‐stranded helix (Fig 2E) consisting of tightly packed tadpole‐shaped subunits (Fig 2F), the long α‐helical tails of which form the core and the globular head domains of which form the outer layer of the filament (Fig 2E–G). As reported for other archaella 11, 12, 14, 17, there is no internal lumen of significant diameter (Fig 2H). The strongest surface features, which determine the macroscopic appearance of the archaellum, are formed by its head domains that run in the 3‐start and the 7‐start directions, creating the visible deeply grooved appearance on the surface of the filament (Fig 2D and E). The archaellum also has a prominent pattern in the 10‐start direction (vertical arrow in Fig 2D), which coincides precisely with the axial direction of the filament. This spatial relationship creates the 10‐fold symmetry when observing a thick radial slab in axial direction (Fig 2H). Strong coupling between subunits 0 and 10, as indicated in the helical lattice, suggests an interaction between these remote structural features. The averaged helical diffraction pattern from all aligned image segments contained visible layer lines to 4 Å resolution. In the diffraction pattern (Fig 2C), numbered layer lines are listed together with their Bessel order.
Individual subunits of the Me. maripaludis archaellum consist of an ~ 80‐Å tail formed by a single conserved α‐helix attached to a tadpole‐shaped head domain (Fig 2F). Throughout the structure, map resolution (Fourier shell correlation, Fig EV3B) allowed unambiguous placement of the polypeptide chain and in many cases there was clear side‐chain density (Fig 2F, inserts). The structure of M. jannaschii FlaB1 was fitted as a rigid body into the reconstructed electron potential map of the Me. maripaludis archaellum. The initial model was further modified according to the sequence of Me. maripaludis archaellins and refined by real‐space fitting at 4 Å resolution. The genome of Me. maripaludis encodes three archaellin proteins—FlaB1, FlaB2, and FlaB3 6. Although we tried to build models for all three proteins, only the sequence of FlaB1 could be fitted well into our cryo‐EM density map, indicating the filament is composed primarily of this single archaellin. Each FlaB1 subunit comprises two domains: N‐terminal α‐helix and a C‐terminal globular part, similar to that described for archaellins of P. furiosus and Msp. hungatei 11, 17. The density map for the linkage region between both domains is well defined, suggesting little flexibility between domains within archaellar filaments. Archaeal filaments are characterized by multiple contacts between subunits. The core of the filament is formed by hydrophobic interaction between the extended N‐terminal α‐helices (Fig 2E, G and H). These N‐termini make contact with the inner parts of head domains in the 10‐start helix direction. Furthermore, there are distinct protein–protein interactions between globular domains, reinforcing major directions (Fig 2D) of the helical lattices between their eight adjacent subunits (Fig 3). In the helical diffraction pattern, there are two pairs of prominent spots on layer line 1 that originate from the tightly packed α‐helices in the filament core (Figs 2C and EV3C). The surrounding stacked β‐sheets in the head domains give rise to a circular set of spots arranged in a spoke‐like pattern, which corresponds to the unusual even‐numbered, 10‐fold radial symmetry created by stacking interactions in the 10‐start helix direction (Fig EV3C). As a consequence, in the diffraction pattern, there is an overlap of the spots on layer line 1.
Figure 3. Protein–protein interactions between adjacent subunits of Methanococcus maripaludis archaellum.
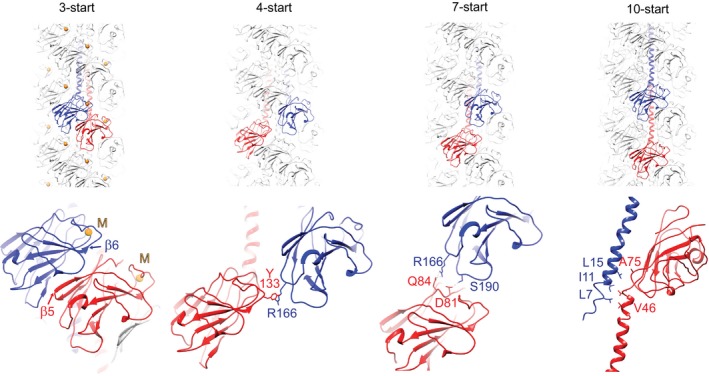
The archaellum is stabilized in unique ways in each major direction of its helical lattice (Fig 1E): The prominent, easily recognizable ridges in the 3‐start direction (Fig 1D) consist of head subunits tightly packed perpendicular to the sheets forming their β‐barrels. Metal ions (M, yellow spheres) are coordinated within each subunit only and do not form inter‐subunit contacts. They are located in the grooves. The 4‐start direction is linked by a single tyrosine–arginine aromatic‐amino interaction, the 7‐start direction is stabilized by electrostatic interactions between charged and polar side chains, and the axial 10‐start interaction is formed by hydrophobic interactions between aliphatic residues near the ends of the extended α‐helices within the filament core (close‐up shows side view rotated 90° around helical axis).
Our model of the Me. maripaludis archaellum contains only one archaellin protein. Previously, it was shown that in Me. maripaludis, two of the three archaellins, FlaB1 and FlaB2, are essential for filament assembly, although the role of each archaellin in archaellation is unknown 6. The third archaellin, FlaB3, apparently forms the hook region, since deletion of this gene results in archaella lacking this curved region. It is possible that all archaellin proteins are incorporated into the same filament. Thus, our model may represent only the archaellum region enriched in FlaB1. However, our mass spectrometry results indicate that FlaB1 is the dominant component in our sample (Table 1), consistent with our structure interpretation. Whether the distribution of archaellins in the filament is random or whether it is regulated by some mechanism remains to be investigated. Interestingly, in both the Msp. hungatei and P. furiosus archaella samples recently studied, filaments were assumed composed of a single archaellin, even though multiple archaellin genes are found in both organisms 11, 17.
Table 1.
Metal composition in Methanococcus maripaludis archaellum
| Element | LC‐MS/MS | ICP‐MS | EELS | ||
|---|---|---|---|---|---|
| Associated sequence | aa | PA | mg l−1 | ||
| 32S | N.D. | 8.9 | − | ||
| 24Mg | YDDSAVDNAVINKG | D203 | 114 | 3.0 | + |
| 66Zn | N.D. | 2.8 | − | ||
| 56Fe | YDDSAVDNAVINKG | D203 | N.D. | 2.4 | − |
| 44Ca | DDSAVDNAVINKG | D203 | 24 | N.D. | − |
High‐resolution tandem mass spectrometry (LC‐MS/MS): element, FlaB1 consensus sequence from up to 10 overlapping metal‐associated peptide fragments, associated amino acid (aa) assigned by software, sum of peak areas (PA) of metal‐associated fragments in million units as a measure of relative abundance. Although a Fe‐associated fragment was identified, its PA could not be determined. The analysis used data from four separate samples. All identified peptides had a false discovery rate of < 0.01%. Inductively coupled plasma mass spectrometry (ICP‐MS) analysis shows absolute concentration of five identified elements after excluding carbon, oxygen, and nitrogen (N.D.: not detected). Samples were injected in triplicate. Ratio sample/background was > 10. Consistent with the most abundant divalent cation detected by mass spectrometry, only Mg was found by electron energy‐loss spectrometry (EELS) using a direct electron detector in electron counting mode (EELS spectra in Fig EV4), but not Fe or Ca. The EELS experiment was repeated seven times.
Interactions within the biological assembly
The helical lattice of archaellin subunits is unique and remarkable, as its symmetry should result in a sevenfold repeat (the 3‐start and 4‐start directions are the most prominent features; Fig 2D). In general, most self‐assembling helical structures contain an uneven number of subunits. Otherwise, polymerization would easily terminate by forming a closed ring. However, the archaellum features strong coupling in the 10‐start direction, parallel to the helical axis. The result is an even‐numbered 10‐fold symmetry when viewing a thick radial slab of the archaellum in the direction of the helical axis (Fig 2H)—a unique geometry unknown in any other helical filaments. The true pitch of the helical assembly is marked by the 10‐start interaction and suggests an interaction of subunits in the axial direction, translated by 57 Å. Indeed, the 75‐Å α‐helical tail of subunit 10 interacts with the innermost part of the head domain of subunit 0 in perfect axial alignment by means of hydrophobic interactions, indicating that the 10‐start helix is the polymerization site of the filament (Figs 2D and 3, right). Furthermore, each of the major lattice directions comes with its own set of interactions, responsible for torsional and longitudinal rigidity and for imparting mechanical properties to the filament required for archaeal motility. The major surface feature is created by the tightly packed head domains that wrap around the entire filament along the 3‐start direction (Fig 3 left). We assume that this structural arrangement conveys greater torsional stability to the filament.
Structure comparison
Comparison of the structure of Me. maripaludis FlaB1 with archaellins of P. furiosus 17 and Msp. hungatei 11 shows that these archaellins have similar shapes: a long N‐terminal α‐helix and a globular C‐terminal domain (Figs 2F and EV2C). The α‐helix is highly conserved, because it is essential for the formation of the filament backbone. The key motif of the globular domain is the β‐barrel, which varies among species due to insertions or deletions between β‐strands. Globular domains of FlaB1 of Me. maripaludis and FlaB0 of P. furiosus show remarkably similar structures, with an RMSD of only 1.6 Å (Fig EV2C). In contrast to FlaB3 of Msp. hungatei, archaellins of Me. maripaludis and P. furiosus have an insertion of ~ 40 amino acids. A similar insertion is found in M. jannaschii FlaB1. In general, these insertions are not conserved. However, they all contain a highly conserved metal‐binding site. Moreover, this region makes multiple contacts with neighboring subunits in the archaellum. It seems that the insertion is only partially stabilized by metal binding; the remainder of the insertion shows large deviations. This assumes some flexibility of this region that might be important for better accommodation of protein subunits during filament formation. The archaellum of Me. maripaludis has a rotational symmetry (108 degrees) close to those of P. furiosus and Msp. hungatei, but a distinct axial rise per subunit (5.7 Å for Me. maripaludis and 5.4 and 5.3 Å for P. furiosus and Msp. hungatei, respectively). Such differences in helical parameters despite structural similarities suggest that differences in filament arrangement can be the result of small variations in amino acid sequence 12. Interestingly, another structural homolog of archaellin is FlaF Sulfolobus acidocaldarius (PDB code 4ZBH), an archaeal protein suggested to function as the archaellum stator 27 (Fig EV2C). FlaF is not a filamentous protein nor is it related to archaellin. Whether this protein plays a role in archaellum assembly remains yet to be discovered.
Posttranslational modification
Posttranslational modification by covalent attachment of carbohydrates has been reported on many archaellins 11, 28, 29. The difference map between the experimental cryo‐EM electron potential map and the model‐derived density contains any amino acid modifications that are not included in the model. Such extra density marks asparagine residues N103 and N116 (Fig 4: numbering refers to the processed archaellin with signal peptide removed), which are the most prominent modifications. We estimated signal‐to‐noise ratio (SNR) of the masked side‐chain densities in the difference map for each visually identified putative modification site (N103, N110, N116, N128, N140, N156) and disregarded weaker difference densities with SNR < 3 as insignificant, leaving only N103, N116, and N128 as significant modifications (Fig 4, right). However, the high SNR in the difference density of N128, which is located inside a β‐sheet, chiefly stems from the inclusion of neighboring protein β‐strands within the masked density. Furthermore, N128 is not part of a consensus N‐glycosylation sequon (NXS/T where X is not proline) and no glycosylation of this site was detected previously 28. In that study, only canonical N‐linked sequons containing N110, N116, and N156 were glycosylated. Therefore, we exclude N128 as posttranslational modification site based on these observations. We did not find significant difference density at N156 in our present analysis, while Kelly et al 28 showed that this site was clearly glycosylated with a tetrasaccharide. Based on our tandem MS‐MS data using an error‐tolerant search with all possible modifications enabled, we can furthermore exclude phosphorylation, acetylation, lipidation, and O‐linked glycosylation. Only N‐linked glycans were positively identified, consistent with the study by Kelly et al 28. Non‐canonical N‐linked glycosylation was recently suggested in analyses of archaella from Msp. hungatei 11. In the case of P. furiosus archaellin, five out of 13 asparagine residues were found to have large adjacent densities, suggesting possible N‐linked glycans. All five asparagines were located as part of canonical N‐linked glycosylation sequons, while none of the remaining eight asparagines, which did not show a similar density nearby, were part of such a sequon 17. The Msp. hungatei archaellin was also modified at six sites with O‐linked glycan, so far, unique for archaellins 11. No indication of possible O‐glycosylation was found in the P. furiosus archaellin 17. Based on our tandem mass spectrometry analysis with error‐tolerant search, any other modifications with exception of N‐linked glycans can be excluded in Me. maripaludis. For several archaea, interference with the N‐glycosylation pathway often results in motility defects and even non‐archaellation, suggesting a role for this posttranslational modification in assembly or/and stability of the filaments 29, 30, 31, 32. Typically, such modifications are found in the C‐terminal portion of the subunits, exposed to the environment 11, 17 where they may contribute to the adhesive properties reported for archaella in various archaea.
Figure 4. Posttranslational modification of Methanococcus maripaludis archaellin.
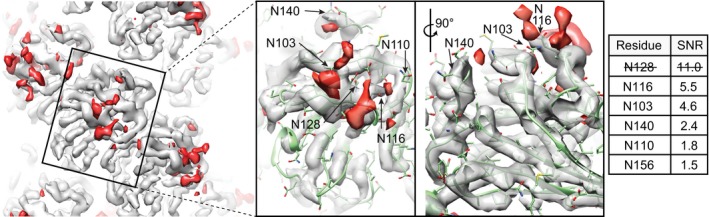
Left: Difference map (red, contour level 4.6σ) calculated at 4 Å resolution between scaled cryo‐EM potential (light gray, contour level 6.2σ) and symmetry‐expanded model‐created electron density (not shown). The red difference map accounts for N‐linked glycans, which were not part of the fitted model and which were the only modifications identified by mass spectrometry. Middle: Close‐up view showing difference densities in immediate vicinity of asparagine residues N103, N110, N116, N128, and N140. The residues associated with the most prominent difference volumes are N103 and N116. Right: Table with signal‐to‐noise ratio (SNR) for each of the side chains within a sphere of 4 Å radius. Only difference densities with SNR > 3 are considered significant. N128 was excluded, because it is buried in the β‐sheet and its high SNR value is mainly due to adjacent protein.
Metal‐binding site in Methanococcus maripaludis archaellin
The novel metal‐binding site identified in the anomalous difference map of M. jannaschii archaellin (Figs 1D and EV1) is also found in our cryo‐EM map of the Me. maripaludis archaellum, which resolves the hydrated single metal atom with surprising clarity (Fig 1E). The density is surrounded by the same conserved amino acids as in the M. jannaschii crystal structure. We validated the presence and nature of the bound metal in the native Me. maripaludis archaella by four methods: (i) inductively coupled plasma mass spectrometry (ICP‐MS), (ii) high‐resolution tandem liquid chromatography mass spectrometry (LC‐MS/MS), (iii) electron energy‐loss spectroscopy (EELS) in amorphous ice using a direct electron detector, and (iv) exposure to chelators followed by negative stain electron microscopy. ICP‐MS is capable of detecting metal concentrations as low as 1 ppq. The purified archaella sample from Me. maripaludis was dialyzed for 24 h against Q‐POD‐purified water (Millipore Inc, ultra‐low metal release) with multiple solvent exchanges. The same water was used as a reference for background subtraction. The most abundant elements were S>Mg>Zn>Fe. Ca was not detected (Table 1). In a separate experiment, the dialyzed sample (using ion‐free ultra‐purified water) was analyzed on a hybrid orbitrap mass spectrometer after separation by HPLC and ionization by electrospray. Fragments were identified according to their mass and charge by comparison with the Me. maripaludis genomic sequence. Peptide fragments with a second, shifted chromatographic peak corresponding to the masses of Mg, Fe, and Ca adducts were identified. The consensus sequences of metal‐associated peptide fragments are consistent with the sequence forming the binding site identified by X‐ray crystallography and cryo‐EM (DYDDSAVDNAVINKGD, Table 1, Fig 1C). Furthermore, adducts with the highest relative abundance (peak area) were associated with FlaB1, supporting our finding that Me. maripaludis archaella are composed predominantly of FlaB1. Low‐dose EELS of radiation‐sensitive organic specimens has only recently become possible using extremely sensitive direct electron counting detectors 33. At a total electron dose of only a few hundred electrons per Å2, we could clearly identify the K‐shell absorption edges of C, N, O, and Mg in native ice‐embedded Me. maripaludis archaella. No Ca peak was found, consistent with our ICP‐MS results (Table 1, Fig EV4A and B).
Figure EV4. Electron energy‐loss spectroscopy on a direct electron detector.
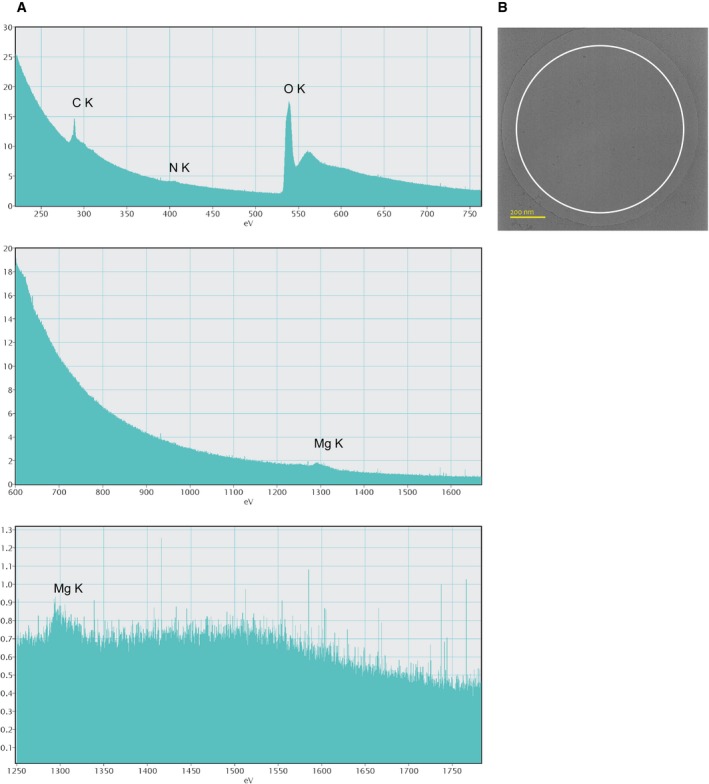
-
A, BEEL spectra of Methanococcus maripaludis archaella in amorphous ice. The sample was dialyzed against ultra‐pure water overnight with multiple water exchanges before plunge‐freezing. The size of the electron probe (beam diameter, white circle) was approximately 1 μm and positioned not to touch the surrounding carbon film (B). Data were collected in movie mode on a customized Gatan K2 direct detector using single electron counting (total dose 630 el/Å2). Presented spectra are from three separate experiments with the energy dispersion of the spectrometer set to progressively more narrow energy windows. No background subtraction was applied. Prominent peaks of the respective K‐edges were observed for C (284 eV), N (401 eV), and O (532 eV). The Mg peak (1,305 eV) was clearly present. Ca (346 eV) and Fe (708 eV) were not detected. The measurements were reproduced in seven different locations of the ice layer.
Figure EV5. Sequence alignment of known archaellin folds with structure annotations.
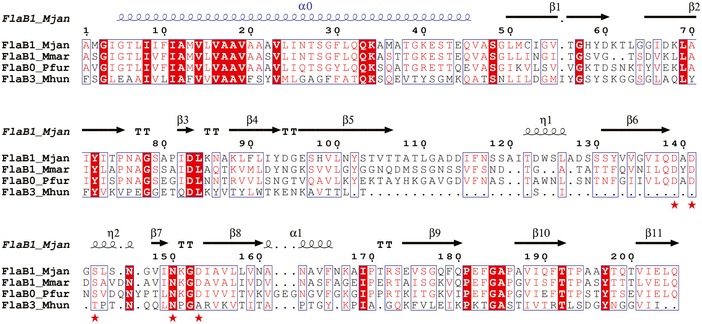
Multiple sequence alignment of FlaB1 Methanocaldococcus jannaschii, FlaB1 Methanococcus maripaludis, FlaB0 Pyrococcus furiosus, and FlaB3 Methanospirillum hungatei. Alignments are shown for the mature archaellins, that is, with the signal peptide removed. These archaellins are the major components of the respective archaellum filaments in these organisms. Identical residues are boxed in red; similar residues are shown in red letters. Secondary structure elements of M. jannaschii FlaB1 are shown above the alignment. The N‐terminal α‐helix α0 of FlaB1 Me. maripaludis, which has been truncated in the M. jannaschii construct, is shown in blue. Red asterisks mark the residues involved in metal binding.
Contrary to the recombinantly expressed M. jannaschii FlaB1 protein, these experiments suggest that the metal bound in the natively produced Me. maripaludis sample is Mg. Note that FeSO4, a large amount of Mg, and a small amount of Ca were added to the growth medium of the latter. The metal‐binding site is located at the periphery of subunits and lines the deep groove along the 3‐start direction (Fig 3, left, and Fig 5A). Although it is not directly involved in intermolecular interactions, it is important for preserving the conformation of the globular domain, thus contributing to the fold of the subunits and the stability of the entire filament. Indeed, when exposed to chelating agents such as EGTA or EDTA, the filament disintegrates at its periphery while initially maintaining its longitudinal connectivity (Fig 5B). Longer exposure or higher chelator concentration leads to complete depolymerization. This observation confirms an essential function of the metal ion in maintaining filament integrity.
Figure 5. Role of the metal‐binding site in subunit interaction and filament stabilization.
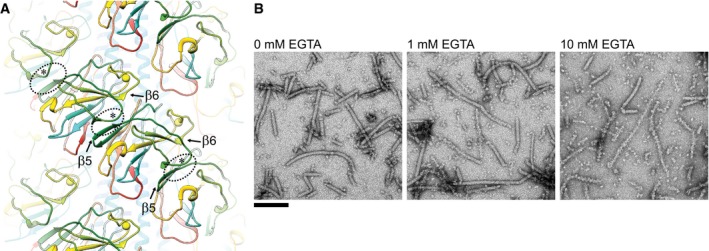
- The 3‐start direction is chiefly formed by anti‐parallel β‐sheet structures of the head domain. The atomic models of Methanococcus maripaludis archaellin in cartoon representation are colored by sequence number from blue (N‐terminus) to red (C‐terminus). Closest inter‐subunit contacts (dotted ovals) are formed between strand β5 and a short anti‐parallel loop (labeled by asterisks) near β6 and the metal‐binding site (yellow spheres). Note how the sequence colored in green forms a “paper clip”‐like structure reaching across each subunit in the 3‐start direction (along the diagonal in the figure).
- Removal of divalent metals destabilizes archaella: Me. maripaludis archaella treated with increasing concentration of EGTA lose their structural integrity. The sample was exposed to the chelator in water for 30 min before negative staining with uranium acetate and imaging by TEM. We found no difference in destabilizing effect between EGTA and EDTA. Scale bar 100 nm.
Our crystal structure of FlaB1 of M. jannaschii, created from protein crystals after recombinant expression of the FlaB1 gene in Escherichia coli, revealed a conserved calcium‐binding site. In the native archaella purified from Me. maripaludis and determined by cryo‐EM, we identified the metal as magnesium by ICP‐MS, high‐resolution tandem LC‐MS/MS, and EELS spectroscopy on a direct electron detector. Ca‐binding sites can be substituted by other metal ions, with the most common replacement being Mg 34, 35. We assume that the binding site can be occupied by different divalent cations in different archaea, depending on environmental conditions. For example, Me. maripaludis has been isolated from crude oil‐storage tanks as an iron‐corroding methanogen shown to use iron as its sole electron source under anaerobic conditions 36, and the related bacterial type 4 pseudopilin PulG has been found to be stabilized by calcium ions in a recent NMR study 37. The ionic radius of Ca2+ is 114 pm, which is larger than either Mg2+ (86 pm) or Fe3+ (79 pm) 38. It is therefore remarkable this metal atom could be resolved in our cryo‐EM map, which has a nominal resolution of only 4 Å. Since we used an energy filter, enhanced amplitude contrast from inelastic scattering is unlikely. However, unlike X‐ray photons, the electron beam is sensitive to charge and the positive charge (Mg2+ or Fe3+) of this ion probably enhances local phase contrast, increasing the size of the reconstructed metal ion. In addition to its charge, the tightly associated hydration shell may further increase its apparent diameter.
The role of metal ions in the archaeal motility system is not clear. The obvious one is stabilization of archaellin structure. A variety of stabilizing strategies has been described for bacterial pilin/pseudopilin, including Ca binding 39. The metal‐binding site (Figs 1, 3 and 4A, yellow spheres), comprising ~ 20 residues upstream of the inter‐subunit β‐strand addition, does not have any other contacts outside each subunit. Its most likely function is to stabilize and hold this free β‐strand in place, while FlaB1 is in solution. Inter‐subunit contacts in the 3‐start direction are expected to increase torsional rigidity (Fig 5A). The short anti‐parallel loop downstream of strand β6 links adjacent subunits (Fig 5A, asterisk). Since the removal of the metal ion with chelators destabilizes the entire filament (Fig 5B), its presence likely instills local order in this bridging structure. Recently, a similar calcium‐binding motif has been identified by NMR spectroscopy in a calcium‐dependent type 2 secretion pseudopilus, and its biological assembly was determined by cryo‐EM at 5 Å resolution 37. This suggests that the divalent metal‐binding motif is a more common feature, which may be conserved throughout evolution of these related structures.
In conclusion, we have determined the structure of the archaellum of Me. maripaludis at 4 Å resolution using cryo‐EM and single‐particle helical averaging, matching a selection rule derived by helical diffraction analysis. We found a novel metal‐binding site in FlaB1 of M. jannaschii by high‐resolution X‐ray crystallography at a resolution of 1.5 Å with a coordination geometry that suggests calcium. A similar density was also visualized with cryo‐EM in the native Me. maripaludis sample. In this sample, the metal ion was identified as magnesium by mass spectrometry and electron energy‐loss spectroscopy, which may explain its exceptional contrast when sampled with a charged electron beam and which may represent one of the first examples to detect the charge of a single atom by cryo‐EM. The complete atomic model suggests an essential role of the divalent cation in filament integrity and reveals protein–protein interactions that may explain mechanical properties of the filament. Our reconstruction contained difference densities consistent with N‐linked glycosylation sites. FlaB1 was identified as the most prominent component of the Me. maripaludis archaellum by sequence match with the cryo‐EM structure, tandem mass spectrometry, and consistent glycosylation pattern.
Materials and Methods
Cloning, expression, and protein purification of Methanocaldococcus jannaschii archaellin
DNA fragment encoding truncated M. jannaschii FlaB1Δ1–38 (numbers correspond to numeration in mature protein) fused to C‐terminal His6 tag was amplified by PCR from genomic DNA of M. jannaschii as a template using the following primers containing NcoI and BamHI restriction sites (in bold): 5′‐GGT GGT CCA TGG GTA AAG AAA GCA CCG AAC AAG TTG‐3′ and 5′‐GGT GGT GGA TCC TTA ATG ATG ATG ATG ATG ATG TTG TAA CTC AAT TAC AGT TTG TGT ATA TGC AG‐3′. The PCR product was double‐digested with NcoI and BamHI and then ligated into the pET52b(+) expression vector (Novagen).
The recombinant vector containing the gene of FlaB1Δ1–38 protein was transformed into E. coli strain Rosetta (DE3; Novagen). Transformed cells were cultured at 37°C to late exponential phase in 2 l Luria–Bertani medium containing 50 μg ml−1 ampicillin and 34 μg ml−1 chloramphenicol. Expression was induced with 0.5 mM isopropyl β‐D‐1‐thiogalactopyranoside at an OD600 of 0.7–0.8. After 3‐h incubation at 37°C, cells were harvested by centrifugation at 8,000 g for 15 min and suspended in 200 ml buffer A (40 mM HEPES, pH 8.0, 0.5 M NaCl, 10 mM imidazole). Suspended cells were sonicated on ice. Cell debris was removed by centrifugation for 30 min at 30,000 g, 5°C. Clarified supernatant was applied to a 5‐ml HisTrap HP column (GE Healthcare) equilibrated with buffer A. The column was washed with 50 ml buffer A. Bound proteins were step eluted with increasing concentration of buffer B (40 mM HEPES, pH 8.0, 0.5 M NaCl, 0.5 M imidazole). Fractions containing FlaB1Δ1–38 were combined, dialyzed overnight against 20 mM HEPES, pH 8.0, 50 mM NaCl, and applied to a 5‐ml HiTrap Q HP column (GE Healthcare) equilibrated with the same buffer. Protein was eluted with a linear gradient of NaCl from 0.05 to 1 M in 20 mM HEPES and pH 8.0. Fractions containing pure protein were pooled, and the protein was transferred by dialysis in 10 mM Tris–HCl, pH 7.5, and 50 mM NaCl.
Crystallization of Methanocaldococcus jannaschii FlaB1Δ1–38
Purified protein was concentrated to 10 mg ml−1 using an Amicon Ultra system (Millipore) with a molecular‐weight cutoff of 10 kDa. Protein concentration was measured by UV spectroscopy at 280 nm using a calculated absorption coefficient of 0.79 mg ml−1 cm−1.
Preliminary screening of crystallization conditions was performed by the sitting‐drop vapor‐diffusion method in 96‐well plates using an automated nanoliter liquid‐handling system (Mosquito, TTP Labtech) at two temperatures: 10 and 20°C. 150 nl protein solution was mixed with 150 nl reservoir solution and equilibrated against 120 μl reservoir solution. Diffraction‐quality crystals were grown in 32.5% PEG 4,000.
Data collection, processing, and model building of Methanocaldococcus jannaschii FlaB1Δ1–38
Prior to data collection, single crystals were briefly soaked in cryoprotectant solution. Subsequently, crystals were mounted on a nylon loop and flash‐cooled in liquid nitrogen. X‐ray diffraction data were collected on beamline BL38B1 at SPring‐8 using an ADSC Quantum 315r CCD detector. Diffraction data were processed and scaled using MOSFLM and SCALA from the CCP4 package 40. The protein structure was solved using the multiple isomorphous replacement method. Heavy atom derivatives were prepared by soaking crystals in stabilization solution (30% PEG 4,000) containing a heavy atom component. Soaking time varied from several hours to several days. Two isomorphous derivatives were prepared: K2OsO4 (1 mM; 18 h soak) and p‐chloromercuribenzoic acid (0.1 mM; 4 days soak). Heavy atom search, phasing, and density modification were performed with AutoSol 41 in the PHENIX suite 42. Automatic model building was performed with Buccaneer 43. The model obtained was used as a search template for molecular replacement with Phaser 44 and high‐resolution native X‐ray data. The model was further refined through an iterative combination of refinement with Refmac5 45 and manual model building in COOT 46. The quality of the final model was validated with MolProbity 47. There were no Ramachandran outliers. Table EV2 lists relevant model statistics.
Isolation of Methanococcus maripaludis archaella
Archaella were extracted from Me. maripaludis cells using detergent OP‐10, precipitated using PEG and banded on a KBr gradient as previously described 5.
Model building and structure refinement of Methanococcus maripaludis filament
First, the crystal structure of FlaB1 of M. jannaschii was fitted as a rigid body into the cryo‐EM density map. The initial model was further modified accordingly to the sequence of Me. maripaludis archaellins, and missing parts were built manually in COOT 46. Finally, the model was refined at 4.0 Å resolution with phenix.real_space_refine 48.
Bioinformatics
The alignment figure was prepared with Crystal Omega 49 and ESPript3 50. Estimation of evolutionary conservation of amino acids was done using ConSurf 21. CheckMyMetal (CMM) server 51, 52 was used for the validation of metal‐binding site.
Cryo‐EM
Sample preparation
3.5 μl purified filament solution was applied to holey carbon grids (Quantifoil 1.2/1.3) and vitrified on a Vitrobot Mark IV (Thermo Fisher) by plunge‐freezing into liquid ethane cooled to liquid nitrogen (LN2) temperature. Frozen grids were transferred into the cryo‐TEM for observation at LN2 temperature.
Data collection
Sample grids were observed on a Titan Krios TEM equipped with an energy filter (Gatan Quantum 968, slit width set to 20 eV) in EFTEM mode using nanoprobe illumination (50 μm C2 aperture, 100 μm objective aperture). The microscope and camera were controlled using LEGINON software. In order to accelerate acquisition, image data collection was set up to take exposures of three target areas per hole using image shift from the center of the hole. Images were recorded as movies (3.5 el/superpixel/s, 250 ms/frame, 12‐s exposure, underfocus of 1.5–2.5 μm) on a K2 direct electron detector in super‐resolution electron counting mode (dose rate 2 el/Å2/s, total dose 98 el/exposure). Movies were saved as uncorrected raw data in MRC file format.
Movie processing
Movies were corrected for gain variation and magnification anisotropy of the projector lens (~ 1.4% as measured with Au/Pt cross‐grating and magdistcor program 53) and binned by a factor of 2 using Fourier cropping. These frame stacks were then aligned and summed in motioncor2 54. All frames were included by applying dose weighting.
Image processing
2,000 filaments were manually selected using e2helixboxer.py 55. Filament length and selected straight segments were short (average 147 nm, standard deviation 127 nm). All subsequent operations were carried out using the SPRING helical image processing package 26. Filaments were segmented at a step size of 75 Å and extracted as boxed particles with dimension 700 × 700 Å. Principal component analysis of threefold binned boxed particle images using the SPARX K‐means algorithm was followed by classification into 100 classes. Class‐sum images revealed a helix diameter of 105 Å and structural detail at improved SNR. Some of these class averages were used for a correlation‐based symmetry search (program segclassreconstruct) near the solution found by analysis of the helical diffraction pattern, but the helical parameter could not be optimized further. Segment alignment and 3D reconstruction were performed with SPRING's segrefine3d program using the gold standard procedure. The final figure‐of‐merit‐weighted electron potential map 56 was sharpened with a B‐factor of −200, masked with a cylindrical mask and low‐pass filtered at 3.7 Å resolution. Fourier shell correlation was determined from the two independently refined half sets (so‐called gold standard FSC). FSC figure was created with gnuplot. Maps of iso‐contoured potential maps were visualized in UCSF Chimera.
Difference map and calculation of SNR
The difference map to highlight posttranslational modification sites was produced with diffmap.exe (Grigorieff Lab) by scaling and subtracting a low‐pass filtered synthetic map based on the refined model coordinates from the normalized cryo‐EM reconstruction. The synthetic map, which was also used to calculate the Fourier cross‐correlation, was created using SFALL and FFT 40. Signal‐to‐noise ratio (SNR) in the difference map near the modified side chains was calculated using the following equation:
where ΔI are the pixel intensities of the difference map inside a spherical mask with radius 4 Å centered at the amide group of the asparagine side chain connected to putative modifications, N is the number of voxels inside the mask, and σNoise is the average variance of the difference map outside the masked volume (in a location that contains some solvent noise). The spherical masks were created with MAMA 40, and the masked map density was cut out using MAVE 40. Voxel intensities were read out with the SPIDER LI command 57. Noise variance, sum of the squared intensities, and SNR within these masked volumes were then calculated by shell script.
Mass spectrometry
Sample dilution
Clean sample was filtered after dialysis using Amicon cutfilter 30 kDa to remove aggregated proteins. Flow‐through was diluted 1/10 with 0.1% formic acid in water and final volume 40 μl.
Tandem LC‐MS/MS analysis
Diluted sample was analyzed using a Thermo Scientific Q‐Exactive Plus Orbitrap hybrid mass spectrometer (Thermo Fisher Scientific, Waltham, MA, USA) equipped with HPLC (Dionex Ultimate 3000 nanoRSLC), autosampler (HTC PAL, CTC Analytics), and nanoelectrospray ion source. Injection volume was 5 μl, separated on a Zorbax 300SB C18 column (0.3 × 150 mm; Agilent, Agilent Technologies, Waldbronn, Germany) at 40°C. A 1‐h solvent B (0.1% formic acid in acetonitrile) gradient in solvent A (0.1% formic acid in water) was employed (1% B to 32% B in 45 min, 32% B to 45% B in 15 min, with a final wash at 75% B for 5 min and reequilibration at 1% B for 10 min). A flow rate of 3.5 μl min−1 was used for peptide separation. Temperature of the heated capillary was 300°C, and 1.9 kV spray voltage was applied to all samples. Mass spectrometer settings were as follows: full MS scan range 350–1,500 m/z, with a mass resolution of 70,000, 30 μs scan time, and AGC set to 1 × E6 ions, and fragmentation MS2 of the 20 most intense ions.
Protein identification
Protein identification employed Proteome Discoverer software v2.1, and Mascot as a search engine. A database downloaded from UniProtKB Me. maripaludis (1,142 reviewed and 7,965 unreviewed proteins) was used. Search parameters were as follows: no enzyme, with precursor and fragment mass tolerance set to 10 ppm and 0.02 Da, respectively. Asparagine and glutamine deamidation, cations Ca, Fe, and Mg were set as variable modifications on aspartic acid and glutamic acid. Results were filtered using a false discovery rate of < 1% as a cutoff threshold, determined with the percolator algorithm in Proteome Discoverer software.
Modified peptide screening
Identified peptides with metal cation modification were subjected to manual examination using the following criteria. Each modified peptide was confirmed to have a chromatographic peak with the same retention time as its unmodified partner; only search ranks “one peptide” and “minimum Mascot score of 25” were accepted.
Structure and map deposition, and accession codes
Model coordinate geometry and structure factors of M. jannaschii FlaB1Δ1–38 were submitted to the Protein Data Bank under entry 5YA6. Atomic coordinates of Me. maripaludis FlaB1 have been deposited in the Protein Data Bank under accession code 5Z1L (statistics in Table EV2). The cryo‐EM reconstruction was uploaded to the EMDB data bank with accession number EMD‐6876. Map and data collection statistics are summarized in Table EV2.
Author contributions
VAM cloned, expressed, purified, crystallized M.j. FlaB1, and refined the structure of M.m. archaellin. SS carried out chelator experiments, neg. stain EM, and sequence alignment. MTS performed EELS data collection and analysis. AV‐B collected LC‐MS/MS and ICP‐MS data and analyzed results. KFJ prepared and purified the M.m. archaellum sample. S‐IA helped with helical diffraction analysis and provided general advice. MW collected and analyzed cryo‐EM data together with SS. MW was responsible for overall project organization and planning. VAM and MW wrote the paper with the input of all authors.
Conflict of interest
The authors declare that they have no conflict of interest.
Supporting information
Expanded View Figures PDF
Table EV1
Table EV2
Review Process File
Acknowledgements
We gratefully acknowledge Young‐Ho Yoon, Hideyuki Matsunami, and Seiya Kitanobo for their support with X‐ray data collection, and S.D. Aird for proof‐reading the manuscript. We thank N. Grigorieff for advice on SNR calculation. The synchrotron data collection was conducted by V.A.M. on beamline BL38B1 at SPring‐8, Japan (Proposal No. 2014B1341).
EMBO Reports (2019) 20: e46340
References
- 1. Jarrell KF, Albers SV (2012) The archaellum: an old motility structure with a new name. Trends Microbiol 20: 307–312 [DOI] [PubMed] [Google Scholar]
- 2. Thomas NA, Bardy SL, Jarrell KF (2001) The archaeal flagellum: a different kind of prokaryotic motility structure. FEMS Microbiol Rev 25: 147–174 [DOI] [PubMed] [Google Scholar]
- 3. Desmond E, Brochier‐Armanet C, Gribaldo S (2007) Phylogenomics of the archaeal flagellum: rare horizontal gene transfer in a unique motility structure. BMC Evol Biol 7: 106 [DOI] [PMC free article] [PubMed] [Google Scholar]
- 4. Tarasov VY, Pyatibratov MG, Tang SL, Dyall‐Smith M, Fedorov OV (2000) Role of flagellins from A and B loci in flagella formation of Halobacterium salinarum . Mol Microbiol 35: 69–78 [DOI] [PubMed] [Google Scholar]
- 5. Bardy SL, Mori T, Komoriya K, Aizawa S, Jarrell KF (2002) Identification and localization of flagellins FlaA and FlaB3 within flagella of Methanococcus voltae . J Bacteriol 184: 5223–5233 [DOI] [PMC free article] [PubMed] [Google Scholar]
- 6. Chaban B, Ng SYM, Kanbe M, Saltzman I, Nimmo G, Aizawa S‐I, Jarrell KF (2007) Systematic deletion analyses of the fla genes in the flagella operon identify several genes essential for proper assembly and function of flagella in the archaeon, Methanococcus maripaludis . Mol Microbiol 66: 596–609 [DOI] [PubMed] [Google Scholar]
- 7. Faguy DM, Jarrell KF, Kuzio J, Kalmokoff ML (1994) Molecular analysis of archaeal flagellins: similarity to the type IV pilin‐transport superfamily widespread in bacteria. Can J Microbiol 40: 67–71 [DOI] [PubMed] [Google Scholar]
- 8. Bardy SL, Jarrell KF (2003) Cleavage of preflagellins by an aspartic acid signal peptidase is essential for flagellation in the archaeon Methanococcus voltae . Mol Microbiol 50: 1339–1347 [DOI] [PubMed] [Google Scholar]
- 9. Albers SV, Szabó Z, Driessen AJM (2003) Archaeal homolog of bacterial type IV prepilin signal peptidases with broad substrate specificity. J Bacteriol 185: 3918–3925 [DOI] [PMC free article] [PubMed] [Google Scholar]
- 10. Egelman EH (2017) Cryo‐EM of bacterial pili and archaeal flagellar filaments. Curr Opin Struct Biol 46: 31–37 [DOI] [PMC free article] [PubMed] [Google Scholar]
- 11. Poweleit N, Ge P, Nguyen HH, Loo RR, Gunsalus RP, Zhou ZH (2016) CryoEM structure of the Methanospirillum hungatei archaellum reveals structural features distinct from the bacterial flagellum and type IV pili. Nat Microbiol 2: 16222 [DOI] [PMC free article] [PubMed] [Google Scholar]
- 12. Braun T, Vos MR, Kalisman N, Sherman NE, Rachel R, Wirth R, Schröder GF, Egelman EH (2016) Archaeal flagellin combines a bacterial type IV pilin domain with an Ig‐like domain. Proc Natl Acad Sci USA 113: 10352–10357 [DOI] [PMC free article] [PubMed] [Google Scholar]
- 13. Trachtenberg S, Galkin VE, Egelman EH (2005) Refining the structure of the Halobacterium salinarum flagellar filament using the iterative helical real space reconstruction method: insights into polymorphism. J Mol Biol 346: 665–676 [DOI] [PubMed] [Google Scholar]
- 14. Trachtenberg S, Cohen‐Krausz S (2006) The archaeabacterial flagellar filament: a bacterial propeller with a pilus‐like structure. J Mol Microbiol Biotechnol 11: 208–220 [DOI] [PubMed] [Google Scholar]
- 15. Cohen‐Krausz S, Trachtenberg S (2002) The structure of the archeabacterial flagellar filament of the extreme halophile Halobacterium salinarum R1M1 and its relation to eubacterial flagellar filaments and type IV pili. J Mol Biol 321: 383–395 [DOI] [PubMed] [Google Scholar]
- 16. Cohen‐Krausz S, Trachtenberg S (2008) The flagellar filament structure of the extreme acidothermophile Sulfolobus shibatae B12 suggests that archaeabacterial flagella have a unique and common symmetry and design. J Mol Biol 375: 1113–1124 [DOI] [PubMed] [Google Scholar]
- 17. Daum B, Vonck J, Bellack A, Chaudhury P, Reichelt R, Albers SV, Rachel R, Kuhlbrandt W (2017) Structure and in situ organisation of the Pyrococcus furiosus archaellum machinery. Elife 6: e27470 [DOI] [PMC free article] [PubMed] [Google Scholar]
- 18. Parge HE, Forest KT, Hickey MJ, Christensen DA, Getzoff ED, Tainer JA (1995) Structure of the fibre‐forming protein pilin at 2.6 Å resolution. Nature 378: 32–38 [DOI] [PubMed] [Google Scholar]
- 19. Hazes B, Sastry PA, Hayakawa K, Read RJ, Irvin RT (2000) Crystal structure of Pseudomonas aeruginosa PAK pilin suggests a main‐chain‐dominated mode of receptor binding. J Mol Biol 299: 1005–1017 [DOI] [PubMed] [Google Scholar]
- 20. Craig L, Pique ME, Tainer JA (2004) Type IV pilus structure and bacterial pathogenicity. Nat Rev Microbiol 2: 363–378 [DOI] [PubMed] [Google Scholar]
- 21. Ashkenazy H, Erez E, Martz E, Pupko T, Ben‐Tal N (2010) ConSurf 2010: calculating evolutionary conservation in sequence and structure of proteins and nucleic acids. Nucleic Acids Res 38: W529–W533 [DOI] [PMC free article] [PubMed] [Google Scholar]
- 22. Holm L, Rosenstrom P (2010) Dali server: conservation mapping in 3D. Nucleic Acids Res 38: W545–W549 [DOI] [PMC free article] [PubMed] [Google Scholar]
- 23. Wang YA, Yu X, Ng SYM, Jarrell KF, Egelman EH (2008) The structure of an archaeal pilus. J Mol Biol 381: 456–466 [DOI] [PMC free article] [PubMed] [Google Scholar]
- 24. Ng SYM, Wu J, Nair DB, Logan SM, Robotham A, Tessier L, Kelly JF, Uchida K, Aizawa SI, Jarrell KF (2011) Genetic and mass spectrometry analyses of the unusual type IV‐like pili of the archaeon Methanococcus maripaludis . J Bacteriol 193: 804–814 [DOI] [PMC free article] [PubMed] [Google Scholar]
- 25. Morgan DG, DeRosier D (1992) Processing images of helical structures: a new twist. Ultramicroscopy 46: 263–285 [DOI] [PubMed] [Google Scholar]
- 26. Desfosses A, Ciuffa R, Gutsche I, Sachse C (2014) SPRING – an image processing package for single‐particle based helical reconstruction from electron cryomicrographs. J Struct Biol 185: 15–26 [DOI] [PubMed] [Google Scholar]
- 27. Banerjee A, Tsai C‐L, Chaudhury P, Tripp P, Arvai AS, Ishida JP, Tainer JA, Albers S‐V (2015) FlaF is a β‐sandwich protein that anchors the archaellum in the archaeal cell envelope by binding the S‐layer protein. Structure 23: 863–872 [DOI] [PMC free article] [PubMed] [Google Scholar]
- 28. Kelly J, Logan SM, Jarrell KF, VanDyke DJ, Vinogradov E (2009) A novel N‐linked flagellar glycan from Methanococcus maripaludis . Carbohydr Res 344: 648–653 [DOI] [PubMed] [Google Scholar]
- 29. Jarrell KF, Ding Y, Meyer BH, Albers S‐V, Kaminski L, Eichler J (2014) N‐linked glycosylation in archaea: a structural, functional, and genetic analysis. Microbiol Mol Biol Rev 78: 304–341 [DOI] [PMC free article] [PubMed] [Google Scholar]
- 30. Tripepi M, You J, Temel S, Önder Ö, Brisson D, Pohlschröder M (2012) N‐glycosylation of Haloferax volcanii flagellins requires known agl proteins and is essential for biosynthesis of stable flagella. J Bacteriol 194: 4876–4887 [DOI] [PMC free article] [PubMed] [Google Scholar]
- 31. Vandyke DJ, Wu J, Logan SM, Kelly JF, Mizuno S, Aizawa SI, Jarrell KF (2009) Identification of genes involved in the assembly and attachment of a novel flagellin N‐linked tetrasaccharide important for motility in the archaeon Methanococcus maripaludis . Mol Microbiol 72: 633–644 [DOI] [PubMed] [Google Scholar]
- 32. Meyer BH, Albers S‐V (2013) Hot and sweet: protein glycosylation in Crenarchaeota. Biochem Soc Trans 41: 384–392 [DOI] [PubMed] [Google Scholar]
- 33. Maigné A, Wolf M (2018) Low‐dose electron energy‐loss spectroscopy using electron counting direct detectors. Reprod Syst Sex Disord 67: i86–i97 [DOI] [PubMed] [Google Scholar]
- 34. Andreini C, Cavallaro G, Lorenzini S, Rosato A (2013) MetalPDB: a database of metal sites in biological macromolecular structures. Nucleic Acids Res 41: D312–D319 [DOI] [PMC free article] [PubMed] [Google Scholar]
- 35. Putignano V, Rosato A, Banci L, Andreini C (2018) MetalPDB in 2018: a database of metal sites in biological macromolecular structures. Nucleic Acids Res 46: D459–D464 [DOI] [PMC free article] [PubMed] [Google Scholar]
- 36. Uchiyama T, Ito K, Mori K, Tsurumaru H, Harayama S (2010) Iron‐corroding methanogen isolated from a crude‐oil storage tank. Appl Environ Microbiol 76: 1783–1788 [DOI] [PMC free article] [PubMed] [Google Scholar]
- 37. López‐Castilla A, Thomassin JL, Bardiaux B, Zheng W, Nivaskumar M, Yu X, Nilges M, Egelman EH, Izadi‐Pruneyre N, Francetic O (2017) Structure of the calcium‐dependent type 2 secretion pseudopilus. Nat Microbiol 2: 1686–1695 [DOI] [PMC free article] [PubMed] [Google Scholar]
- 38. Shannon RD (1976) Revised effective ionic radii and systematic studies of interatomic distances in halides and chalcogenides. Acta Crystallogr A 32: 751–767 [Google Scholar]
- 39. Korotkov KV, Gray MD, Kreger A, Turley S, Sandkvist M, Hol WGJ (2009) Calcium is essential for the major pseudopilin in the type 2 secretion system. J Biol Chem 284: 25466–25470 [DOI] [PMC free article] [PubMed] [Google Scholar]
- 40. Winn MD, Ballard CC, Cowtan KD, Dodson EJ, Emsley P, Evans PR, Keegan RM, Krissinel EB, Leslie AGW, McCoy A et al (2011) Overview of the CCP4 suite and current developments. Acta Crystallogr D Biol Crystallogr 67: 235–242 [DOI] [PMC free article] [PubMed] [Google Scholar]
- 41. Terwilliger TC, Adams PD, Read RJ, McCoy AJ, Moriarty NW, Grosse‐Kunstleve RW, Afonine PV, Zwart PH, Hung LW (2009) Decision‐making in structure solution using Bayesian estimates of map quality: the PHENIX AutoSol wizard. Acta Crystallogr D Biol Crystallogr 65: 582–601 [DOI] [PMC free article] [PubMed] [Google Scholar]
- 42. Adams PD, Afonine PV, Bunkoczi G, Chen VB, Davis IW, Echols N, Headd JJ, Hung L‐W, Kapral GJ, Grosse‐Kunstleve RW et al (2010) PHENIX: a comprehensive Python‐based system for macromolecular structure solution. Acta Crystallogr D Biol Crystallogr 66: 213–221 [DOI] [PMC free article] [PubMed] [Google Scholar]
- 43. Cowtan K (2008) Fitting molecular fragments into electron density. Acta Crystallogr D Biol Crystallogr 64: 83–89 [DOI] [PMC free article] [PubMed] [Google Scholar]
- 44. McCoy AJ, Grosse‐Kunstleve RW, Adams PD, Winn MD, Storoni LC, Read RJ (2007) Phaser crystallographic software. J Appl Crystallogr 40: 658–674 [DOI] [PMC free article] [PubMed] [Google Scholar]
- 45. Murshudov GN, Skubak P, Lebedev AA, Pannu NS, Steiner RA, Nicholls RA, Winn MD, Long F, Vagin AA (2011) REFMAC5 for the refinement of macromolecular crystal structures. Acta Crystallogr D Biol Crystallogr 67: 355–367 [DOI] [PMC free article] [PubMed] [Google Scholar]
- 46. Emsley P, Lohkamp B, Scott WG, Cowtan K (2010) Features and development of Coot. Acta Crystallogr D Biol Crystallogr 66: 486–501 [DOI] [PMC free article] [PubMed] [Google Scholar]
- 47. Chen VB, Arendall WB, Headd JJ, Keedy DA, Immormino RM, Kapral GJ, Murray LW, Richardson JS, Richardson DC (2010) MolProbity: all‐atom structure validation for macromolecular crystallography. Acta Crystallogr D Biol Crystallogr 66: 12–21 [DOI] [PMC free article] [PubMed] [Google Scholar]
- 48. Afonine PV, Grosse‐Kunstleve RW, Echols N, Headd JJ, Moriarty NW, Mustyakimov M, Terwilliger TC, Urzhumtsev A, Zwart PH, Adams PD (2012) Towards automated crystallographic structure refinement with phenix.refine. Acta Crystallogr D Biol Crystallogr 68: 352–367 [DOI] [PMC free article] [PubMed] [Google Scholar]
- 49. Sievers F, Wilm A, Dineen D, Gibson TJ, Karplus K, Li W, Lopez R, McWilliam H, Remmert M, Soding J et al (2011) Fast, scalable generation of high‐quality protein multiple sequence alignments using Clustal Omega. Mol Syst Biol 7: 539 [DOI] [PMC free article] [PubMed] [Google Scholar]
- 50. Robert X, Gouet P (2014) Deciphering key features in protein structures with the new ENDscript server. Nucleic Acids Res 42: W320–W324 [DOI] [PMC free article] [PubMed] [Google Scholar]
- 51. Zheng H, Chordia MD, Cooper DR, Chruszcz M, Muller P, Sheldrick GM, Minor W (2014) Validation of metal‐binding sites in macromolecular structures with the CheckMyMetal web server. Nat Protoc 9: 156–170 [DOI] [PMC free article] [PubMed] [Google Scholar]
- 52. Zheng H, Cooper DR, Porebski PJ, Shabalin IG, Handing KB, Minor W (2017) CheckMyMetal: a macromolecular metal‐binding validation tool. Acta Crystallogr D Struct Biol 73: 223–233 [DOI] [PMC free article] [PubMed] [Google Scholar]
- 53. Grant T, Grigorieff N (2015) Automatic estimation and correction of anisotropic magnification distortion in electron microscopes. J Struct Biol 192: 204–208 [DOI] [PMC free article] [PubMed] [Google Scholar]
- 54. Zheng SQ, Palovcak E, Armache J‐P, Verba KA, Cheng Y, Agard DA (2017) MotionCor2: anisotropic correction of beam‐induced motion for improved cryo‐electron microscopy. Nat Methods 14: 331–332 [DOI] [PMC free article] [PubMed] [Google Scholar]
- 55. Tang G, Peng L, Baldwin PR, Mann DS, Jiang W, Rees I, Ludtke SJ (2007) EMAN2: an extensible image processing suite for electron microscopy. J Struct Biol 157: 38–46 [DOI] [PubMed] [Google Scholar]
- 56. Rosenthal PB, Henderson R (2003) Optimal determination of particle orientation, absolute hand, and contrast loss in single‐particle electron cryomicroscopy. J Mol Biol 333: 721–745 [DOI] [PubMed] [Google Scholar]
- 57. Frank J, Radermacher M, Penczek P, Zhu J, Li Y, Ladjadj M, Leith A (1996) SPIDER and WEB: processing and visualization of images in 3D electron microscopy and related fields. J Struct Biol 116: 190–199 [DOI] [PubMed] [Google Scholar]
Associated Data
This section collects any data citations, data availability statements, or supplementary materials included in this article.
Supplementary Materials
Expanded View Figures PDF
Table EV1
Table EV2
Review Process File