Abstract
Immune infiltration of tumors is closely associated with clinical outcome in renal cell carcinoma (RCC). Tumor‐infiltrating immune cells (TIICs) regulate cancer progression and are appealing therapeutic targets. The purpose of this study was to determine the composition of TIICs in RCC and further reveal the independent prognostic values of TIICs. CIBERSORT, an established algorithm, was applied to estimate the proportions of 22 immune cell types based on gene expression profiles of 891 tumors. Cox regression was used to evaluate the association of TIICs and immune checkpoint modulators with overall survival (OS). We found that CD8+ T cells were associated with prolonged OS (hazard ratio [HR] = 0.09, 95% confidence interval [CI].01‐.53; P = 0.03) in chromophobe carcinoma (KICH). A higher proportion of regulatory T cells was associated with a worse outcome (HR = 1.59, 95% CI 1.23‐.06; P < 0.01) in renal clear cell carcinoma (KIRC). In renal papillary cell carcinoma (KIRP), M1 macrophages were associated with a favorable outcome (HR = .43, 95% CI .25‐.72; P < 0.01), while M2 macrophages indicated a worse outcome (HR = 2.55, 95% CI 1.45‐4.47; P < 0.01). Moreover, the immunomodulator molecules CTLA4 and LAG3 were associated with a poor prognosis in KIRC, and IDO1 and PD‐L2 were associated with a poor prognosis in KIRP. This study indicates TIICs are important determinants of prognosis in RCC meanwhile reveals potential targets and biomarkers for immunotherapy development.
Keywords: genomic alterations, overall survival, prognosis, renal cell carcinoma, tumor‐infiltrating immune cells
1. INTRODUCTION
Kidney cancer is one of the most common cancers among men and women. Its incidence has been increasing during the last two decades, accounting for 2%‐3% of all new tumor cases.1 RCC is the most common form of kidney cancer, comprising up to approximately 85% of kidney cancer cases.2 According to pathological classification, RCC includes a multifarious group of tumors with different molecular, histologic and genetic alterations. Renal clear cell carcinoma (KIRC), renal papillary cell carcinoma (KIRP) and chromophobe carcinoma (KICH) are the most common RCC.3, 4 Despite advances in diagnosis, screening, surgery and drug therapy, the clinical outcome of RCC remains unsatisfactory.5, 6 As a well‐known heterogeneous disease, the useful biomarkers which contribute to individualized treatment options are still lacking for RCC, especially in current immunotherapy.
Immune response is closely associated with clinical outcome in RCC. Tumor‐infiltrating immune cells (TIIC) form an ecosystem in the tumor microenvironment to regulate cancer progression and have shown potential prognostic value.7 Tumor‐infiltrating lymphocytes are the most widely studied populations of TIIC. Cytotoxic CD8+ T cells and CD4+ helper T cells can target antigenic tumor cells to prevent tumor growth.8 Infiltrating CD4+ T cells can regulate RCC cell proliferation by modulating the TGFβ1/YBX1/HIF2α signal.9 A high level of activated CD8+ T cells is associated with prolonged prognosis in many cancers, including RCC.10, 11 However, the tumor microenvironment can also inhibit T cell responses, causing tumors to lose their immunogenicity. This involve regulatory T cells (Tregs), that secrete immunosuppressive cytokines, leading to T cell dysfunction.12, 13 Previous study has shown Tregs can efficiently suppress effector T cells proliferation in RCC.14 Tumor‐associated macrophages (TAM) are another very important immune population that can either promote or block tumor development.15, 16 Distinct TAM subsets can induce or inhibit anti–tumor immunity.17, 18, 19 A high level of CD163+ or CD204+ TAM is linked to poor clinical outcome in KIRP, and the CD163 and CD204 are usually considered to be the markers of M2 macrophages.20 Both TAM and T cell phenotypes are appealing biomarkers in cancer.21, 22
Tumor‐infiltrating immune cells are likely to be effective targets for drugs to improve clinical outcomes. Recently, drug trials targeting immune checkpoints reported a great improvement in patient survival, including for RCC patients.6 Nivolumab, a checkpoint blocker, has been approved for RCC treatment, improving treatment prospects.23 With growing attention on immune checkpoint therapy, the distribution of TIIC has become a main research focus. Previous studies estimated the composition of TIIC by flow cytometry and immunohistochemistry (IHC).24 These methods can only analyze a few immune cell types at once and are restricted by the number of fluorescent channels available. However, the immune response requires numerous different cell types to coordinately interact. To accurately study the interaction of immune responses, a large number of samples should be analyzed. Recently, a bioinformatics tool, CIBERSORT, was developed.25, 26, 27 This deconvolution algorithm based on gene expression data quantifies the cellular composition of immune response and has greatly expanded the potential of the genomic database. Due to the superiority of CIBERSORT over other methods, it has received increasing attention and it has been successfully used to evaluate the composition of immune cells in breast, lung and liver cancer.25, 28, 29
In this study, CIBERSORT was applied to assess the relative proportions of 22 TIIC, presenting a comprehensive immune cell landscape of RCC. We further revealed relationships between the composition of TIIC and molecular subtypes, tumor stages, and survival in RCC; moreover, we explored the association between TIIC and recurrent genomic alterations. In addition, the prognostic landscape of immune checkpoint modulators was investigated in KIRC and KIRP. The present study attempted to reveal potential targets and biomarkers for immunotherapy of RCC.
2. MATERIALS AND METHODS
2.1. Data acquisition
Data from the public domain were used in the current study. Data on gene expression, copy number, somatic mutations and corresponding clinical information were identified and downloaded from The Cancer Genome Atlas (TCGA, https://cancergenome.nih.gov/) kidney cohort through the R package “TCGA‐Assembler” in February 2018. The dataset used included 891 primary kidney tumors, with no particular exclusion criteria applied. Each tumor case corresponded to one RCC patient. Somatic mutation data and copy number data were aligned against hg19. The clinicopathological data collected included sex, age, T‐stage, lymph node involvement, clinical stage, survival status and survival duration in months.
2.2. Assessment of immune infiltration
CIBERSORT, a deconvolution algorithm reported by Bindea et al, can characterize the cell composition of complex tissues based on normalized gene expression profiles. This method quantifies the abundance of a particular cell type and has been verified by fluorescence activated cell sorting (FACS). We used CIBERSORT (http://cibersort.stanford.edu/) to examine the relative fractions of 22 infiltrating immune cell types in each tumor tissue, with the algorithm run using the LM22 signature matrix at 1000 permutations. These TIIC included macrophages (M1 macrophages, M2 macrophages, M0 macrophages), 7 T‐cell types (T follicular helper [Tfh] cells, resting memory CD4+ T cells, activated memory CD4+ T cells, γδ T cells, CD8+ T cells, Tregs, naïve CD4+ T cells), resting natural killer (NK) cells, activated NK cells, resting mast cells, activated mast cells, memory B cells, resting dendritic cells (DC), activated DC, naïve B cells, monocytes, plasma cells, neutrophils and eosinophils. For each tumor sample, the sum of all evaluated immune cell type fractions equaled 1.
2.3. Statistical analysis
Statistical analyses were conducted using R v3.3.2 and Bioconductor (https://www.bioconductor.org/). Each dataset was processed by a weighted average method to compare the differences in the composition of TIIC in various subtypes and stages of RCC. Overall survival (OS) was defined as the time interval from the date of diagnosis to the date of death. To estimate the prognostic value of immune cells, the associations between immune cell type fractions and OS were assessed by Cox regression analysis, with age and sex as covariates. The listwise deletion method was used to handle missing data, which excluded the entire sample from the analysis if any single value was missing. The prognostic value of immune checkpoint molecules was also assessed by Cox regression analysis. Univariate linear regression models of TIIC percentage versus mutational status of genes that were mutated in at least 2% of tumors were fitted. Fold‐changes of TIIC percentage with point estimates were acquired. Moreover, we investigated the association between TIIC and copy number aberrations (CNA) present in at least 5% of the patients by Spearman test. t test analysis was performed to assess the differences in the gene expression of immune checkpoint molecules between tumor and normal tissues. For all statistical analyses, a P‐value < 0.05 was considered significant.
3. RESULTS
3.1. Summary of renal cell carcinoma clinicopathological information from 891 cases
In this study, the dataset included 891 cases of RCC samples. The clinicopathological characteristics of these samples are shown in Table 1.
Table 1.
Primary tumor characteristics
| Variable | Number of samples | % | Valid % |
|---|---|---|---|
| Gender | |||
| Male | 595 | 66.8 | 67.4 |
| Female | 288 | 32.3 | 32.6 |
| Missing | 8 | .1 | |
| Age at diagnosis | |||
| ≤50 | 194 | 21.8 | 22.0 |
| >50 | 686 | 77.0 | 78.0 |
| Missing | 11 | 1.2 | |
| T‐stage | |||
| T1 | 484 | 54.3 | 54.9 |
| T2 | 126 | 14.3 | 14.3 |
| T3 | 256 | 28.7 | 29.1 |
| T4 | 15 | 1.7 | 1.7 |
| Missing | 10 | 1.1 | |
| Stage | |||
| I | 457 | 51.3 | 53.7 |
| II | 103 | 11.6 | 12.1 |
| III | 188 | 21.1 | 22.1 |
| IV | 103 | 11.6 | 12.1 |
| Missing | 40 | 4.5 | |
| Lymph node involvement | |||
| True | 221 | 24.8 | 25.3 |
| False | 652 | 73.2 | 74.7 |
| Missing | 18 | 2 | |
| Subtype | |||
| KICH | 65 | 7.3 | 7.3 |
| KIRC | 538 | 60.4 | 60.4 |
| KIRP | 288 | 32.2 | 32.2 |
| Missing | 0 | 0 | |
KICH, chromophobe carcinoma; KIRC, renal clear cell carcinoma; KIRP, renal papillary cell carcinoma.
3.2. Distribution of tumor‐infiltrating immune cells
Figure 1 shows the composition of TIIC in RCC. Tumors contained abundant fractions of TAM (35.8%), CD8+ T cells (17.3%), resting memory CD4+ T cells (16.0%) and resting mast cells (7.1%), whereas the fractions of eosinophils (.02%), memory B cells (.01%) and activated mast cells (.03%) were rare. There were large differences in the composition of TIIC in various stages and subtypes of RCC. A lower fraction of CD8+ T cells was seen in KICH subtypes compared with the KIRC and KIRP subtypes. The fractions of M0 macrophages and resting mast cells were significantly lower in the KIRC subtype, and the KIRP subtype had a higher level of M2 macrophages. With an increase in tumor stage, the proportion of Tregs increased, whereas the proportion of resting mast cells decreased.
Figure 1.
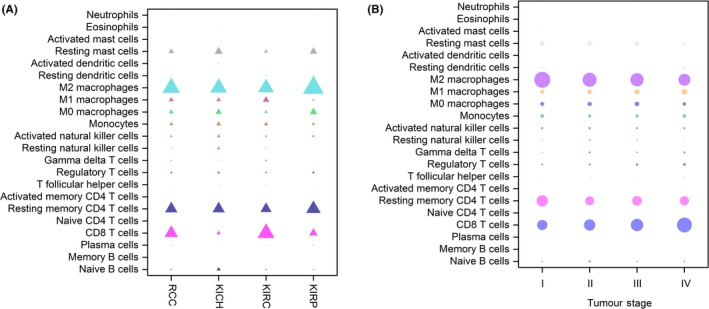
Distribution of immune cell‐type fractions in renal cell carcinoma (RCC) subtypes (A) and stages (B). Fractions of each immune cell type in different RCC subtypes and stages were compared. The size of the bubble represents the fraction of immune cell–type
3.3. Association between tumor‐infiltrating immune cells and genomic alterations
Figures 2 and 3 show that genomic alterations with carcinogenic potential were closely related to the immune infiltration of tumors. We revealed an association between the composition of TIIC and copy number of aberrations (CNA). CNA data were available in 881 cases. We observed a higher level of CD8+ T cells in tumors with chr1q32.2 gain (including G0S2), a lower level of resting mast cells in tumors with chr3p21.31 loss (including SETD2), a lower level of M0 macrophages in tumors with chr3p26.3 loss (including CHL1) and a higher level of activated DC in tumors with chr2p25.3 loss. Moreover, we evaluated the relationship between TIIC and mutational status of genes that were mutated in at least 2% of tumors. We found statistically significantly lower frequency of CD8+ T cells in tumors harboring the somatic oncogenic TP53 and ARID1A mutations compared with tumors that were not mutated in these genes. There was a statistically significantly higher level of M2 macrophages in tumors presenting PTEN and SETD2 mutations, and a higher level of Tregs in tumors presenting PIK3CA mutations.
Figure 2.
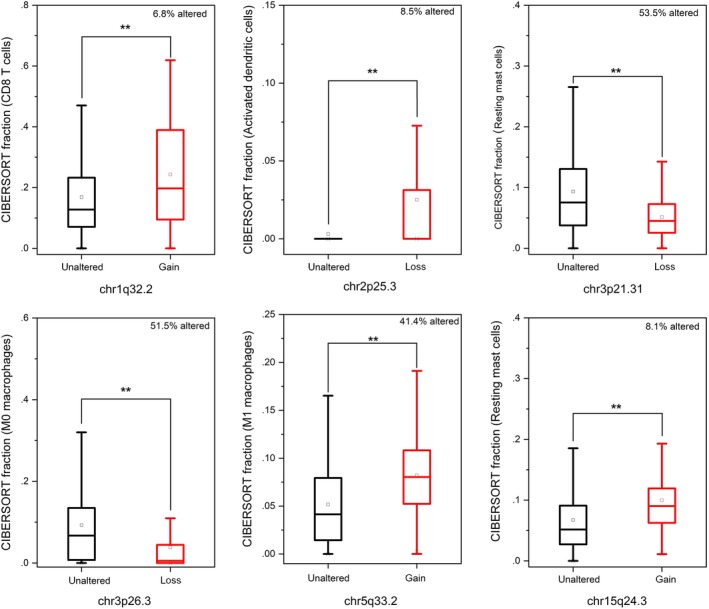
Associations between the composition of tumor‐infiltrating immune cells and copy number of aberrations in renal cell carcinoma cohort (n = 881). *P < 0.05, **P < 0.01
Figure 3.
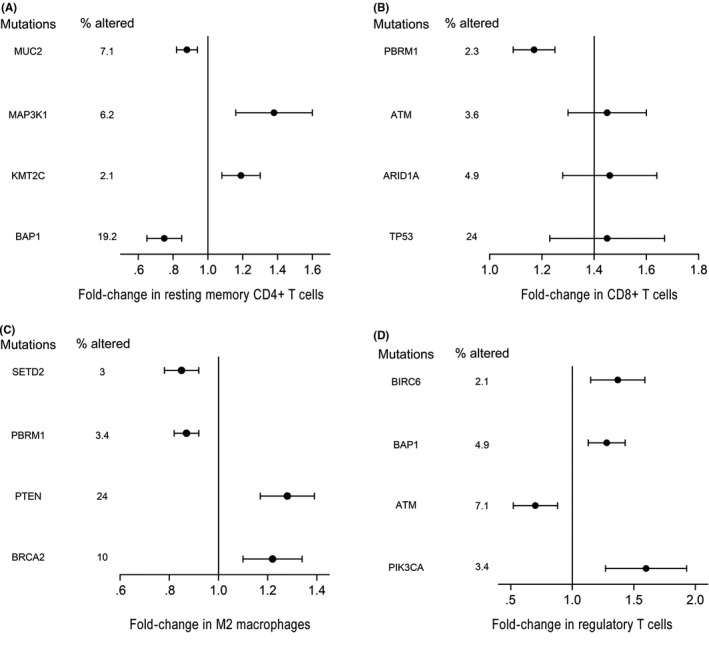
Univariate associations between the composition of tumor‐infiltrating immune cells and recurrently mutated genes in renal cell carcinoma cohort (n = 562), (A) CD4+ T cells, (B) CD8+ T cells, (C) M2 macrophages, (D) regulatory T cells
3.4. Association between tumor‐infiltrating immune cells and survival
The prognostic value of TIIC was assessed in RCC. In Figure 4, the blue bubble indicates that a higher level is related to prolonged OS and the red bubble indicates that a higher level is related to shorter OS. Detailed results are provided in Tables [Link], [Link], [Link]. CD8+ T cells were associated with favorable outcome (HR = .09, 95% CI .01‐.53; P = 0.03) in KICH. In KIRC, resting memory CD4+ T cells (HR = .74, 95% CI .58‐.96; P = 0.05), Tfh cells (HR = .74, 95% CI .58‐.96; P = 0.05) and resting DC (HR = .69, 95% CI .53‐.89; P = 0.02) were associated with improved outcome, whereas Tregs (HR = 1.59, 95% CI 1.23‐.06; P < 0.01) indicated the opposite. In KIRP, increased proportions of M1 macrophages (HR = .43, 95% CI .25‐.72; P < 0.01) were associated with prolonged OS, whereas a greater proportion of M2 macrophages (HR = 2.55, 95% CI 1.45‐4.47; P < 0.01) was associated with a shorter OS. The Kaplan‐Meier curves are provided in Figures [Link], [Link], [Link].
Figure 4.
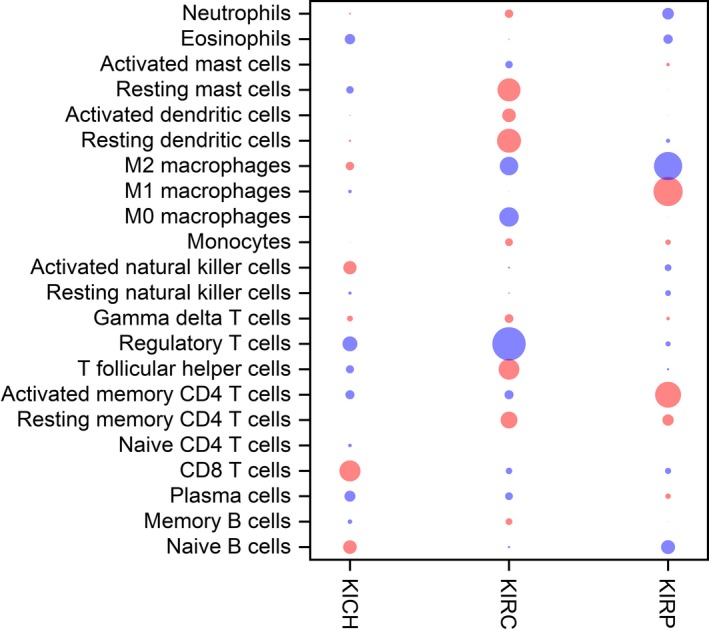
Bubble heat map for the predictive and prognostic values of immune cell–type fractions in renal cell carcinoma. Associations between fractions and overall survival (OS) were analyzed. A blue bubble indicates that a higher fraction is associated with shorter OS; a red bubble indicates that a higher fraction is associated with prolonged OS. The size of the bubble indicates the statistical significance level. The prognostic value of immune cell‐type fractions was assessed by Cox regression analysis
3.5. Expression of immunomodulators and their prognostic significance in renal cell carcinoma
Immune checkpoint blockade therapy has significantly improved the treatment prospects of refractory RCC. We revealed differences in the expressions of several critical immunomodulators between tumor and normal tissues. These immunomodulators included co‐stimulatory molecules (CD27 and ICOS) and co‐inhibitory molecules (PD‐1, TIM‐3, LAG3, PDL1, CTLA4, PD‐L2, TIGIT and IDO1). As shown in Figure 5, the expression of PD‐1, PD‐L1, CTLA4, TIM‐3, IDO1 and PD‐L2 were significantly increased in tumors. In addition, we evaluated the prognostic value of immune checkpoint molecules that participate in immune escape mechanisms. In KIRC, patients with tumors expressing high levels of CTLA4, LAG3, and TIGIT had a shorter OS, while patients with high TIM‐3‐expressing tumors had a longer OS. In KIRP, high expressions of LAG3, IDO1 and PD‐L2 were associated with a worse prognosis, whereas high expression of TIM‐3 was associated with a better prognosis. The Kaplan‐Meier curves are provided in Figures [Link], [Link].
Figure 5.
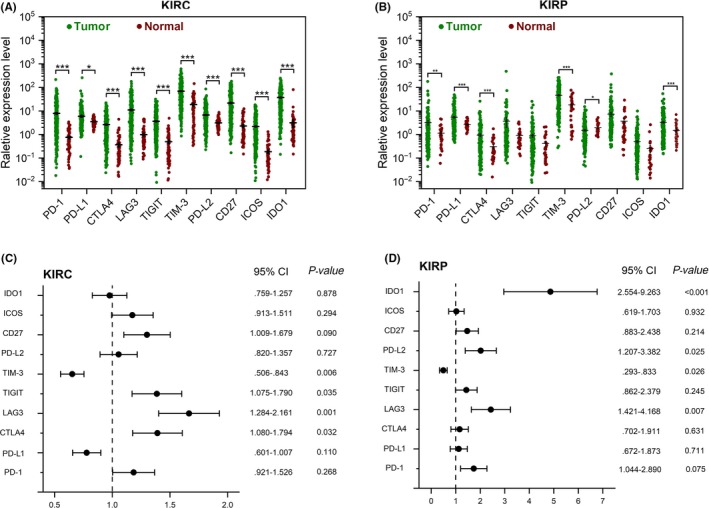
Immunomodulators and their prognostic properties in renal clear cell carcinoma (KIRC) and renal papillary cell carcinoma (KIRP). A, B, Expression profile of immunomodulators in KIRC (A) and KIRP patients (B). C, D, Cox regression analysis for the prognostic value of immunomodulators in KIRC (C) and KIRP (D) patients. CI, confidence interval; HR, hazard ratio. *P < 0.05, **P < 0.01
4. DISCUSSION
We conducted a comprehensive and detailed assessment of immune infiltration in RCC, based on the deconvolution of bulk gene expression data from a large set of samples. In addition, the independent prognostic value of immune phenotypes was revealed. This should be of great interest in view of the current development of immunomodulatory therapies. We reported that the composition of TIIC differs greatly in various subtypes and stages of RCC. These differences may be important determinants for prognosis.
The importance of immune infiltration for prognosis has been recognized. The immunoscore, a scoring system that evaluates the distribution and amount of TIIC in tumors, has been applied to colon cancer and has shown prognostic value.30 Here, we found that a high level of CD8+ T cells was associated with prolonged OS in KICH and that a high level of resting memory CD4+ T cells was associated with a better outcome in KIRC. Regarding subpopulations of T cells, CD8+ T cells are critical anti–tumor effector cells, while resting memory CD4+ T cells can differentiate further to possess various functions (eg, differentiate to CD8 + memory T cells to suppress tumor growth).31, 32 We observed a lower fraction of CD8+ T cells in KICH compared with KIRC and KIRP, suggesting that KICH might have an immune‐excluded phenotype where CD8+ T cells were maintained in the stroma, restricting cancer immunity. Interestingly, the infiltration of cytotoxic CD8+ T cells might be modified by immunotherapy.33 The role of CD8+ T cells in the clinical outcome in KICH provides a future therapeutic target in KICH.
Tregs contribute to suppressing anti–tumor T cell responses. They produce immunosuppressive cytokines and immune‐inhibitory receptors to disrupt the activation of anti–tumor T cells.12 Our findings showed that Tregs were related to a worse prognosis in KIRC. Previous studies have shown that anti–CTLA‐4 antibody (ipilimumab) downregulated Tregs tumor infiltration in breast cancer. This might be a potential intervention strategy for KIRC.
Another immune suppressor cell, M2 macrophages, was also related to a worse OS in KIRC and KIRP. Macrophages are the most abundant subpopulations of TIIC in RCC. Macrophage phenotypes correspond to distinct immunoregulatory functions, but the “polarized states” of macrophages are controversial.34 M1 (anti–tumoral) and M2 (pro–tumoral) phenotypes may represent the extremes of a range of functional states rather than truly different cell types.34 Macrophages are likely to exist in tumors in quantities of such states. We found that high M0 macrophage fractions were related to a poor outcome, which might reflect their gradual change of function. Our results further highlighted the significance of macrophage functional state and demonstrated the potential of TAM as biomarkers for RCC.
In KIRC, a high estimated Tfh cell proportion was related to a better prognosis. This is in accordance with previous findings that infiltrating Tfh cells were associated with prolonged OS in colorectal cancer.35 Tfh cells function by driving antigen‐specific B cells to selectively differentiate into memory B cells and plasma cells and by maintaining the germinal centre.36, 37 Our results further support the protective roles of Tfh cells in tumors.
Here, the association between TIIC and genomic alterations was revealed. Tumors presenting with TP53 mutations were associated with higher levels of resting memory CD4+ T cells and CD8+ T cells. A similar association was also observed for tumors with ARID1A mutations. Although we found no evidence for an association of TP53 mutations and TIIC in RCC, a study of ovarian cancer showed that TP53 mutations were associated with a high amount of tumor‐infiltrating lymphocytes.38 Previous studies reported that a deficiency in ARID1A promoted the infiltration of immune cells in hepatocellular carcinoma.39, 40 Moreover, ARID1A mutations are associated with high immune infiltration and microsatellite instability in colorectal cancer.40 In addition, copy number variations (CNV) are another common form of genetic instability, and directly change the expression level of specific genes. We observed a higher level of CD8+ T cells in tumors with chr1q32.2 gain (including G0S2). G0S2 can modulate homeostatic proliferation of CD8+ T cells.41 The CAN of chr1q32.2 may affect the immune infiltration of CD8+ T cells by regulating the expression of G0S2. Our results showed a lower level of resting mast cells in tumors with chr3p21.31 loss (including SETD2). Moreover, SETD2 has been reported in association with immune infiltration in KIRP.42 Although we have some knowledge of the clinical utility of mutations, the value of genomic alterations as biomarkers for immunotherapy requires further research.
We also revealed the independent prognostic value of several important immune checkpoint modulators in KIRC and KIRP. Blocking immune checkpoints is currently the most promising strategy for cancer immunotherapy.43 Our results showed that CTLA4, LAG3 and TIGIT were associated with a worse prognosis in KIRC, and that LAG3 and PD‐L2 were associated with a poor outcome in KIRP. Of note, one of the immunotherapeutic strategies for renal cell carcinoma is to suppress immune tolerance by inhibiting the interaction between tumor cells and immune cells. CTLA‐4, PD‐1, PD‐L1 and PD‐L2 receptors are involved in this interaction. The PD‐1 inhibitor (nivolumab) has been approved for RCC treatment by the FDA. CTLA‐4 (ipilimumab) and PD‐L1 inhibitors (avelumab) are also being investigated.6
To conclude, we described the immune landscape in detail, revealing the distinct immune infiltration patterns of different subtypes and stages of RCC. The complex relationship between TIIC and genomic alterations was further established. Finally, we highlighted the independent prognostic value of TIIC and immune checkpoint modulators. Immune checkpoint therapy is changing the treatment prospects of cancer patients but only for a subset of RCC patients. Our work advances the understanding of immune response and provides valuable resources for research to improve immunotherapy.
DISCLOSURE
The authors have no conflict of interest.
Supporting information
Zhang S, Zhang E, Long J, et al. Immune infiltration in renal cell carcinoma. Cancer Sci. 2019;110:1564‐1572. 10.1111/cas.13996
Shichao Zhang and Erdong Zhang equally contributed to the paper.
Contributor Information
Yan Ouyang, Email: ouyangyan@gmc.edu.cn.
Zhu Zeng, Email: 724914301@qq.com.
REFERENCES
- 1. Ljungberg B, Bensalah K, Canfield S, et al. EAU guidelines on renal cell carcinoma: 2014 update. Eur Urol. 2015;67(5):913‐924. [DOI] [PubMed] [Google Scholar]
- 2. Choueiri TK, Motzer RJ. Systemic therapy for metastatic renal‐cell carcinoma. N Engl J Med. 2017;376(4):354‐366. [DOI] [PubMed] [Google Scholar]
- 3. Srigley JR, Delahunt B, Eble JN, et al. The International Society of Urological Pathology (ISUP) vancouver classification of renal neoplasia. Am J Surg Pathol. 2013;37(10):1469‐1489. [DOI] [PubMed] [Google Scholar]
- 4. Shuch B, Amin A, Armstrong AJ, et al. Understanding pathologic variants of renal cell carcinoma: distilling therapeutic opportunities from biologic complexity. Eur Urol. 2015;67(1):85‐97. [DOI] [PubMed] [Google Scholar]
- 5. Garcia JA, Rini BI. Recent progress in the management of advanced renal cell carcinoma. CA Cancer J Clin. 2007;57(2):112‐125. [DOI] [PubMed] [Google Scholar]
- 6. Barata PC, Rini BI. Treatment of renal cell carcinoma: current status and future directions. CA Cancer J Clin. 2017;67(6):507‐524. [DOI] [PubMed] [Google Scholar]
- 7. Grivennikov SI, Greten FR, Karin M. Immunity, inflammation, and cancer. Cell. 2010;140(6):883‐899. [DOI] [PMC free article] [PubMed] [Google Scholar]
- 8. Vesely MD, Kershaw MH, Schreiber RD, et al. Natural innate and adaptive immunity to cancer. Annu Rev Immunol. 2011;29:235‐271. [DOI] [PubMed] [Google Scholar]
- 9. Wang Y, Wang Y, Xu L, et al. CD4+ T cells promote renal cell carcinoma proliferation via modulating YBX1. Exp Cell Res. 2018;363(1):95‐101. [DOI] [PubMed] [Google Scholar]
- 10. Youngblood B, Hale JS, Kissick HT, et al. Effector CD8 T cells dedifferentiate into long‐lived memory cells. Nature. 2017;552(7685):404‐409. [DOI] [PMC free article] [PubMed] [Google Scholar]
- 11. Yao J, Xi W, Zhu Y, et al. Checkpoint molecule PD‐1‐assisted CD8(+) T lymphocyte count in tumor microenvironment predicts overall survival of patients with metastatic renal cell carcinoma treated with tyrosine kinase inhibitors. Cancer Manag Res. 2018;10:3419‐3431. [DOI] [PMC free article] [PubMed] [Google Scholar]
- 12. Speiser DE, Ho PC, Verdeil G. Regulatory circuits of T cell function in cancer. Nat Rev Immunol. 2016;16(10):599‐611. [DOI] [PubMed] [Google Scholar]
- 13. Wherry EJ, Kurachi M. Molecular and cellular insights into T cell exhaustion. Nat Rev Immunol. 2015;15(8):486‐499. [DOI] [PMC free article] [PubMed] [Google Scholar]
- 14. Santagata S, Napolitano M, D'Alterio C, et al. Targeting CXCR4 reverts the suppressive activity of T‐regulatory cells in renal cancer. Oncotarget. 2017;8(44):77110‐77120. [DOI] [PMC free article] [PubMed] [Google Scholar]
- 15. Kitamura T, Qian BZ, Pollard JW. Immune cell promotion of metastasis. Nat Rev Immunol. 2015;15(2):73‐86. [DOI] [PMC free article] [PubMed] [Google Scholar]
- 16. Sica A, Larghi P, Mancino A, et al. Macrophage polarization in tumour progression. Semin Cancer Biol. 2008;18(5):349‐355. [DOI] [PubMed] [Google Scholar]
- 17. Murray PJ, Allen JE, Biswas SK, et al. Macrophage activation and polarization: nomenclature and experimental guidelines. Immunity. 2014;41(1):14‐20. [DOI] [PMC free article] [PubMed] [Google Scholar]
- 18. Quatromoni JG, Eruslanov E. Tumor‐associated macrophages: function, phenotype, and link to prognosis in human lung cancer. Am J Transl Res. 2012;4(4):376‐389. [PMC free article] [PubMed] [Google Scholar]
- 19. Daud AI, Loo K, Pauli ML, et al. Tumor immune profiling predicts response to anti‐PD‐1 therapy in human melanoma. J Clin Invest. 2016;126(9):3447‐3452. [DOI] [PMC free article] [PubMed] [Google Scholar]
- 20. Motoshima T, Miura Y, Wakigami N, et al. Phenotypical change of tumor‐associated macrophages in metastatic lesions of clear cell renal cell carcinoma. Med Mol Morphol. 2018;51(1):57‐63. [DOI] [PubMed] [Google Scholar]
- 21. Ostuni R, Kratochvill F, Murray PJ, et al. Macrophages and cancer: from mechanisms to therapeutic implications. Trends Immunol. 2015;36(4):229‐239. [DOI] [PubMed] [Google Scholar]
- 22. Galon J, Mlecnik B, Bindea G, et al. Towards the introduction of the ‘Immunoscore’ in the classification of malignant tumours. J Pathol. 2014;232(2):199‐209. [DOI] [PMC free article] [PubMed] [Google Scholar]
- 23. Motzer RJ, Escudier B, McDermott DF, et al. Nivolumab versus everolimus in advanced renal‐cell carcinoma. N Engl J Med. 2015;373(19):1803‐1813. [DOI] [PMC free article] [PubMed] [Google Scholar]
- 24. Chevrier S, Levine JH, Zanotelli VRT, et al. An immune atlas of clear cell renal cell carcinoma. Cell. 2017;169(4):736‐749 e18. [DOI] [PMC free article] [PubMed] [Google Scholar]
- 25. Ali HR, Chlon L, Pharoah PD, et al. Patterns of immune infiltration in breast cancer and their clinical implications: a gene‐expression‐based retrospective study. PLoS Med. 2016;13(12):e1002194. [DOI] [PMC free article] [PubMed] [Google Scholar]
- 26. Newman AM, Liu CL, Green MR, et al. Robust enumeration of cell subsets from tissue expression profiles. Nat Methods. 2015;12(5):453‐457. [DOI] [PMC free article] [PubMed] [Google Scholar]
- 27. Charoentong P, Finotello F, Angelova M, et al. Pan‐cancer immunogenomic analyses reveal genotype‐immunophenotype relationships and predictors of response to checkpoint blockade. Cell Rep. 2017;18(1):248‐262. [DOI] [PubMed] [Google Scholar]
- 28. Rohr‐Udilova N, Klinglmuller F, Schulte‐Hermann R, et al. Deviations of the immune cell landscape between healthy liver and hepatocellular carcinoma. Sci Rep. 2018;8(1):6220. [DOI] [PMC free article] [PubMed] [Google Scholar]
- 29. Liu X, Wu S, Yang Y, et al. The prognostic landscape of tumor‐infiltrating immune cell and immunomodulators in lung cancer. Biomed Pharmacother. 2017;95:55‐61. [DOI] [PubMed] [Google Scholar]
- 30. Mlecnik B, Bindea G, Angell HK, et al. Integrative analyses of colorectal cancer show immunoscore is a stronger predictor of patient survival than microsatellite instability. Immunity. 2016;44(3):698‐711. [DOI] [PubMed] [Google Scholar]
- 31. Mami‐Chouaib F, Blanc C, Corgnac S, et al. Resident memory T cells, critical components in tumor immunology. J Immunother Cancer. 2018;6(1):87. [DOI] [PMC free article] [PubMed] [Google Scholar]
- 32. Rosenberg J, Huang J. CD8(+) T Cells and NK Cells: parallel and complementary soldiers of immunotherapy. Curr Opin Chem Eng. 2018;19:9‐20. [DOI] [PMC free article] [PubMed] [Google Scholar]
- 33. Chen Y, Ramjiawan RR, Reiberger T, et al. CXCR4 inhibition in tumor microenvironment facilitates anti‐programmed death receptor‐1 immunotherapy in sorafenib‐treated hepatocellular carcinoma in mice. Hepatology (Baltimore, MD). 2015;61(5):1591‐1602. [DOI] [PMC free article] [PubMed] [Google Scholar]
- 34. Noy R, Pollard JW. Tumor‐associated macrophages: from mechanisms to therapy. Immunity. 2014;41(1):49‐61. [DOI] [PMC free article] [PubMed] [Google Scholar]
- 35. Bindea G, Mlecnik B, Tosolini M, et al. Spatiotemporal dynamics of intratumoral immune cells reveal the immune landscape in human cancer. Immunity. 2013;39(4):782‐795. [DOI] [PubMed] [Google Scholar]
- 36. Eivazi S, Bagheri S, Hashemzadeh MS, et al. Development of T follicular helper cells and their role in disease and immune system. Biomed Pharmacother. 2016;84:1668‐1678. [DOI] [PubMed] [Google Scholar]
- 37. Ivanova EA, Orekhov AN. T helper lymphocyte subsets and plasticity in autoimmunity and cancer: an overview. Biomed Res Int. 2015;2015:327470. [DOI] [PMC free article] [PubMed] [Google Scholar]
- 38. Shah CA, Allison KH, Garcia RL, et al. Intratumoral T cells, tumor‐associated macrophages, and regulatory T cells: association with p53 mutations, circulating tumor DNA and survival in women with ovarian cancer. Gynecol Oncol. 2008;109(2):215‐219. [DOI] [PubMed] [Google Scholar]
- 39. Fang JZ, Li C, Liu XY, et al. Hepatocyte‐specific Arid1a deficiency initiates mouse steatohepatitis and hepatocellular carcinoma. PLoS ONE. 2015;10(11):e0143042. [DOI] [PMC free article] [PubMed] [Google Scholar]
- 40. Desmedt C, Salgado R, Fornili M, et al. Immune infiltration in invasive lobular breast cancer. J Natl Cancer Inst. 2018;110(7):768‐776. [DOI] [PMC free article] [PubMed] [Google Scholar]
- 41. Lee PH, Yamada T, Park CS, et al. G0S2 modulates homeostatic proliferation of naive CD8(+) T cells and inhibits oxidative phosphorylation in mitochondria. Immunol Cell Biol. 2015;93(7):605‐615. [DOI] [PMC free article] [PubMed] [Google Scholar]
- 42. Feng C, Ding G, Ding Q, et al. Overexpression of low density lipoprotein receptor‐related protein 1 (LRP1) is associated with worsened prognosis and decreased cancer immunity in clear‐cell renal cell carcinoma. Biochem Biophys Res Commun. 2018;503(3):1537‐1543. [DOI] [PubMed] [Google Scholar]
- 43. Sanmamed MF, Chen L. A paradigm shift in cancer immunotherapy: from enhancement to normalization. Cell. 2018;175(2):313‐326. [DOI] [PMC free article] [PubMed] [Google Scholar]
Associated Data
This section collects any data citations, data availability statements, or supplementary materials included in this article.
Supplementary Materials


