Abstract
The testis‐specific protein, Y‐linked 1 (TSPY1), a newly recognized cancer/testis antigen, has been suggested to accelerate tumor progression. However, the mechanisms underlying TSPY1 cancer‐related function remain limited. By mining the RNA sequencing data of lung and liver tumors from The Cancer Genome Atlas, we found frequent ectopic expression of TSPY1 in lung adenocarcinoma (LUAD) and liver hepatocellular carcinoma (LIHC), and the male‐specific protein was associated with higher mortality rate and worse overall survival in patients with LUAD and LIHC. Overexpression of TSPY1 promotes cell proliferation, invasiveness, and cycle transition and inhibits apoptosis, whereas TSPY1 knockdown has the opposite effects on these cancer cell phenotypes. Transcriptomic analysis revealed the involvement of TSPY1 in PI3K/AKT and RAS signaling pathways in both LUAD and LIHC cells, which was further confirmed by the increase in the levels of phosphorylated proteins in the PI3K‐AKT and RAS signaling pathways in TSPY1‐overexpressing cancer cells, and by the suppression on the activity of these two pathways in TSPY1‐knockdown cells. Further investigation identified that TSPY1 could directly bind to the promoter of insulin growth factor binding protein 3 (IGFBP3) to inhibit IGFBP3 expression and that downregulation of IGFBP3 increased the activity of PI3K/AKT/mTOR/BCL2 and RAS/RAF/MEK/ERK/JUN signaling in LUAD and LIHC cells. Taken together, the observations reveal a novel mechanism by which TSPY1 could contribute to the progression of LUAD and LIHC. Our finding is of importance for evaluating the potential of TSPY1 in immunotherapy of male tumor patients with TSPY1 expression.
Keywords: IGFBP3, PI3K/AKT, RAS, TSPY1, tumor progression
Abbreviations
- APC
allophycocyanin
- CT
cancer‐testis
- DEG
differentially expressed gene
- GO
Gene Ontology
- IGFBP3
insulin growth factor binding protein 3
- KEGG
Kyoto Encyclopedia of Genes and Genomes
- LIHC
liver hepatocellular carcinoma
- LUAD
lung adenocarcinoma
- MSY
male‐specific region of the Y chromosome
- NAP
nucleosome assembling protein
- PI
propidium iodide
- RT‐qPCR
real‐time quantitative PCR
- SET
suppressor of variegation, enhancer of zeste, and trithorax
- TCGA
The Cancer Genome Atlas
- TSPY1
testis‐specific protein, Y‐linked 1
1. INTRODUCTION
TSPY1 (testis‐specific protein, Y‐linked 1) is located in the male‐specific region of the Y chromosome (MSY),1 representing the largest and most homogenous protein‐coding tandem array in the human genome.1, 2 Previous studies have revealed that TSPY1, a testis‐specific protein, is predominantly expressed in mature spermatogonia and serves physiological functions in the proliferation and differentiation of spermatogonia during spermatogenesis.3, 4 Remarkably, TSPY1 is also involved in the initiation and development of many tumors. TSPY1 is the only MSY gene that is definitely related to a specific tumor, gonadoblastoma.5, 6, 7 Additionally, TSPY1 is overexpressed in the majority of evaluated testicular germ cell tumors,8 and ectopically activated in various somatic cancers, including hepatocellular carcinoma, melanoma, and prostate cancer.9, 10, 11 All of this evidence supports an oncogenic role of TSPY1 in germ cell and somatic tumors.
The predominant TSPY1 isoform is a 38‐kDa phosphoprotein that harbors a highly conserved SET/NAP domain.3 Its homology to other proteins of the SET/NAP superfamily might suggest the functional diversity of TSPY1, including nucleosome assembly, transcription modulation, DNA replication, cell cycle control, and cell proliferation.12, 13, 14 To date, studies have evaluated several molecular mechanisms of this cancer‐testis (CT) protein functions. For example, TSPY1 potentiates cell proliferation and promotes a rapid transition from G2 to M phase through binding to cyclin B1 and enhancing the kinase activity of cyclin B1/cyclin‐dependent kinase 1 complex.15, 16 It increases protein synthesis and gene transcription through interacting with the eukaryotic translation elongation factor 1A,17 and exacerbates the transactivation of endogenous androgen receptor and activates a number of growth‐related and oncogenic canonical pathways.18 Recently, we reported that TSPY1 promotes cell proliferation through suppressing the ubiquitin‐specific peptidase 7‐mediated p53 function.19 All these accumulating findings improve our knowledge of the mechanism underlying TSPY1 functions under physiological or pathological conditions. However, our understanding of the clinical significance of TSPY1 in the progression of the tumors is still limited. Also, it is unknown whether there are some common mechanisms underlying TSPY1 oncogenic functions in different kinds of tumor. It is of importance to explore these issues for evaluating the potential of the CT antigen as a tumor immunotherapy target.
Lung and liver cancers are now the leading cancer killer worldwide. In the present study, the correlations between the expression pattern of TSPY1 and the clinical consequences in patients with lung or liver tumors were explored by mining the datasets of TCGA. Transcriptomic analysis was carried out to systematically investigate the TSPY1‐influenced signaling pathways and hub genes in lung and liver tumor cells. With this work, we observed higher mortality and worse overall survival in patients with TSPY1‐expressed LUAD and LIHC relative to those with TSPY1‐negative LUAD and LIHC. Importantly, we revealed that TSPY1 could activate PI3K/AKT and RAS signaling through inhibiting the transcription of IGFBP3. Our findings disclosed a novel mechanism underlying the promotion of cell proliferation, cell cycle‐transition, invasiveness, and the inhibition of cell apoptosis by TSPY1 during tumor progression.
2. MATERIALS AND METHODS
2.1. Bioinformatics analysis of TSPY1 expression profile and clinical features in male patients with lung and liver tumors
We abstracted the mRNA expression profiles of male lung and liver tumors with the clinical information from TCGA database (http://cancergenome.nih.gov, updated April 5, 2018). After normalizing mRNA expression data obtained from RNA sequencing, the cancers that showed recurrent ectopic expression of TSPY1 were determined. For each of such cancers, the ratio of TSPY1‐positive cases was calculated and the difference in overall survival was assessed between patients with TSPY1‐positive and ‐negative cancer by the log‐rank test. The hazard ratios with 95% confidence intervals and log‐rank P‐values were calculated and displayed on the plot. The mortality rate was compared between TSPY1‐positive and ‐negative groups by the χ2‐test for each tumor type.
2.2. Transcriptomic analysis of TSPY1‐overexpressing cells
Total RNA was isolated from TSPY1‐overexpressing A549 and HepG2 cells using TRIzol reagent (Invitrogen, Carlsbad, CA, USA). After determining the quality and concentration using an Agilent 2100 bioanalyzer (Agilent Technologies, Santa Clara, CA, USA), RNAs were sequenced in a HiSeq4000 (Illumina, San Diego, CA, USA) instrument. Triplicate RNA samples from independent groups were prepared for sequencing. The primary bioinformatic analysis was carried out by Genedenovo Biotechnology. (Guangzhou, China). Gene Ontology analysis was visualized using the Database for Annotation, Visualization and Integrated Discovery (https://david.ncifcrf.gov/). GeneRatio was calculated by the percentage of DEGs that match a specific GO term in the total DEGs. Kyoto Encyclopedia of Genes and Genomes pathway enrichment analysis was undertaken using the KEGG Orthology‐based Annotation System 2.0 (KOBAS 2.0, http://kobas.cbi.pku.edu.cn). The protein‐protein interaction network was analyzed using the Cytoscape software from the STRING database (http://string-db.org/). The hub genes in the DEGs were identified according to a combined conditions that included: (i) a high connectivity degree (>3); (ii) involvement in one of the enriched pathways; and (iii) regulation on important biological phenotypes.
2.3. Reverse transcription and RT‐qPCR
Total RNAs from cells were reverse transcribed into cDNAs using a RevertAid First‐Strand cDNA Synthesis Kit (Thermo Fisher Scientific, Waltham, MA, USA). The RT‐qPCRs were carried out using SYBR Premix Ex Taq II (TaKaRa Bio, Dalian, China) in a Bio‐Rad iCycler RT‐qPCR Detection System (Bio‐Rad, Berkeley, CA, USA). Each assay was carried out in triplicate. GAPDH was used as an internal control. The RT‐qPCR primers for target genes are listed in Table S1.
2.4. Western blot analysis
Cells were harvested in lysis buffer (Bioteke, Beijing, China) with a protease inhibitor cocktail (Roche, Basel, Switzerland). Protein concentrations were determined using a BCA protein assay kit (Bioteke), and equal amounts of protein were loaded into SDS‐PAGE for western blotting. Antibodies used in this study are presented in Table S2.
2.5. Plasmid construction
The full‐length cDNA encoding FLAG‐tagged TSPY1 was synthesized and cloned into pcDNA3.1 (+) vector (Invitrogen) and pLVX‐IRES‐ZsGreen1 vector (Clontech, Mountain View, CA, USA). Six IGFBP3 promoter fragments with different lengths (Table S1) were amplified and cloned into the pGL3‐Basic luciferase reporter vector (Promega, Madison, WI, USA). TSPY1‐specific shRNA (shTSPY1) and IGFBP3‐specific shRNA (shIGFBP3) were synthesized and inserted into the pLKO.1 vector (Addgene, Cambridge, MA, USA). The TSPY1‐specific siRNA (siTSPY1) and IGFBP3‐specific siRNA (siIGFBP3) were synthesized by RiboBio (Guangzhou, China). Their target sequences are listed in Table S1.
2.6. Cell culture and lentivirus infection
Human cell lines 293T (embryonic kidney), A549 (lung adenocarcinoma), HepG2 (hepatocellular carcinoma), LCLC‐103H (large cell lung carcinoma), and MHCC97H (hepatocellular carcinoma) were cultured in DMEM and 1640 medium supplemented with 10% FBS and 1% penicillin‐streptomycin in a humidified incubator with 37°C and 5% CO2. The lentivirus system was composed of 3 vectors: pMD2G (VSV‐G envelope) (Addgene), pSPAX2 (backbone) (Addgene), and pLVX‐IRES‐ZsGreen1 (stably expressed target gene) or pLKO.1 (shRNA to interfere the target gene). The 3 vectors were transfected into 293T cells using a jetPRIME transfection kit (Polyplus, Illkirch, France). After 48 hours, viral supernatants were collected, centrifuged, and filtered through 0.45‐μm PVDF membranes. Then the viral supernatants were used to infect cells. After 72 hours, RT‐qPCRs and western blot assays were undertaken to detect the expression levels of TSPY1 and IGFBP3. Additionally, the lentivirus‐infected cell clones of TSPY1‐overexpressing or ‐knockdown and IGFBP3‐knockdown cells were selected using puromycin. The siRNAs were transfected into the cells using a jetPRIME transfection kit (Polyplus). At 48 hours after transfection, total proteins were extracted from the cells for western blot assays.
2.7. Dual‐luciferase reporter assays
A Dual‐Luciferase Reporter Assay kit (Promega) was used for detection of luciferase activity. In brief, 6 plasmids, pGL3‐P1, pGL3‐P2, pGL3‐P3, pGL3‐P4, pGL3‐P5, and pGL3‐P6, were separately co‐transfected with FLAG‐TSPY1 or the negative control pcDNA3.1‐FLAG plasmids into 293T cells. After 48 hours, the luciferase activity of cell lysates was detected according to the manufacturer's protocols.
2.8. Chromatin immunoprecipitation assays
Chromatin immunoprecipitation assays were carried out using a Magna ChIP kit (Millipore, Temecula, CA, USA) according to the manufacturer's protocols. Briefly, cells were fixed with 1% formaldehyde for 10 minutes, and cell lysates were sheared by sonication in 1% SDS lysis buffer to generate chromatin fragments. Then 1% of the optimally sheared chromatin was retained as a positive control “input DNA” in the subsequent PCRs. The remaining chromatin was immunoprecipitated with 2 μg anti‐FLAG Abs specific to FLAG‐TSPY1. Antibody‐protein‐DNA complexes were precipitated with protein A/G magnetic beads. The DNA eluted and purified was subjected to PCR using primers specific for the target regions of the IGFBP3 promoter. The primers for PCR are listed in Table S1. Immunoglobulin G was used as a negative control.
2.9. Cell proliferation and colony formation assays
The cell proliferation rate was measured with the CCK‐8 (Beyotime, Shanghai, China) according to the manufacturer's instructions. Briefly, cells were seeded into 96‐well plates at a density of 3000 cells per well. At indicated time points, CCK‐8 solution was added to each well. After 2 hours of incubation at 37°C, 5% CO2, the absorbance of each well was measured at 450 nm using a microplate reader. Each group was measured in triplicate. The relative proliferation was determined as a fold change that was calculated using the absorbance of each well. The results were normalized by the value of a control.
For the colony formation assay, 300 cells were plated into 6‐well plates and incubated for 2 weeks. Colonies were then fixed with methanol and stained with crystal violet solution when the colonies were sufficiently large for visualization. The stained colonies were counted and photographed. Each group was tested independently in triplicate.
2.10. Cell cycle and apoptosis assays
For the cell cycle assay, cells were resuspended and fixed with 70% prechilled ethanol overnight at 4°C. The fixed cells were washed with cold PBS and treated with RNase A solution (250 μg/mL) for 30 minutes. Finally, the cells were stained with PI (Sigma‐Aldrich, St. Louis, MO, USA) and assessed on a flow cytometer (Beckman, Krefeld, Germany). The measured results were analyzed using ModFit software (Verity Software House, Topsham, ME, USA).
Cell apoptosis was detected using an annexin V‐APC/PI apoptosis detection kit (BD Pharmacy, Franklin Lakes, NJ, USA) according to the manufacturer's protocol. Briefly, the indicated cells were washed with cold PBS and resuspended with staining buffer. A volume of 5 μL annexin V‐APC and 1 μL PI were added to a total of 100 μL cell suspension. The mix was incubated at room temperature for 15 minutes and then subjected to flow cytometry analysis. Apoptotic cells were identified as both annexin V‐APC+/PI− and annexin V‐APC+/PI+.
2.11. Cell invasion assay
Cells were cultured in serum‐free medium for 24 hours and plated into upper Transwell filter chambers coated with Matrigel (Corning, Corning, NY, USA). Medium with 10% FBS was added to the lower chamber as a chemoattractant to drive cell movement and incubated for 12 hours. Invaded cells on the undersides of the membrane were fixed with methanol and stained with crystal violet. Cells were photographed and counted under a microscope. Each assay was carried out in triplicate.
2.12. Statistical analysis
Student's t test was used to compare the experimental groups with SPSS software (version 17.0; IBM, Chicago, IL, USA). Numerical data were reported as the mean ± SD. P < .05 was considered statistically significant.
3. RESULTS
3.1. Ectopic expression of TSPY1 significantly affects the mortality rate and overall survival of patients with LUAD and LIHC
After extracting the RNA sequencing data from TCGA, we analyzed the TSPY1 expression profile in different kinds of lung and liver tumors, each of which contained more than 50 samples with relevant clinical information. Our results showed frequent ectopic expression of TSPY1 mRNA in lung squamous cell carcinoma, LUAD, and LIHC (Figure S1A). For exploring the clinical significance of TSPY1 in tumor progression, we further investigated the effect of TSPY1 expression on mortality rate and overall survival. Significantly, results showed a higher mortality rate in the patients with TSPY1‐positive LIHC relative to those with TSPY1‐negative LIHC (Figure S1B). Moreover, we observed that patients with TSPY1‐positive LUAD or LIHC had worse overall survival than those with TSPY1‐negative tumor (Figure 1A,B). However, the influence of TSPY1 on overall survival was not found in lung squamous cell carcinoma (Figure 1C), which might have resulted from the limited number of samples. Collectively, these findings provided evidence to suggest that the ectopic expression of TSPY1 promoted tumor progression.
Figure 1.

Poor prognosis associated with the ectopic expression of testis‐specific protein, Y‐linked 1 (TSPY1) in patients with lung adenocarcinoma and liver hepatocellular carcinoma. For each tumor, the prognosis was compared between patients with and without the ectopic expression of TSPY1 in cancer tissue, in the form of a survival curve. Deterioration of overall survival was observed in patients with TSPY1‐positive lung adenocarcinoma (A) and liver hepatocellular carcinoma (B) relative to TSPY1‐negative (log‐rank test, α = 0.05: lung adenocarcinoma, P = .0203; liver hepatocellular carcinoma, P = .0050). Such an influence was not identified in lung squamous cell carcinoma (C). HR, hazard ratio
3.2. Overexpression of TSPY1 promotes proliferation, invasiveness, and cycle transition and inhibits apoptosis of cancer cells
To investigate the impact of TSPY1 during tumor progression, we constructed 2 cell lines, A549 and HepG2, in which TSPY1 was overexpressed exogenously (Figure 2A). Then we examined the cell characters of proliferation, invasiveness, cycle transition, and apoptosis in the 2 TSPY1‐overexpressing cell lines. We observed that TSPY1 overexpression resulted in enhanced cell proliferation (Figure 2B), colony formation (Figure 2C), and invasive ability (Figure 2D) in the A549 and HepG2 cells. We also found that TSPY1 overexpression increased the cell ratio of the G1/G0 phase and decreased that of the G2/M phase (Figure 2E), indicating that TSPY1 promoted the phase transition of G2 to M in the A549 and HepG2 cells. Additionally, we observed that TSPY1 overexpression reduced the percentage of apoptotic cells in the A549 and HepG2 cells (Figure 2F). Taken together, these findings suggested that TSPY1 promoted the proliferation, invasiveness, and cycle transition and inhibited the apoptosis of cancer cells, and that the 2 TSPY1‐overexpressing cell lines can be used to explore the potential mechanism that enables TSPY1 to promote cancer progression.
Figure 2.
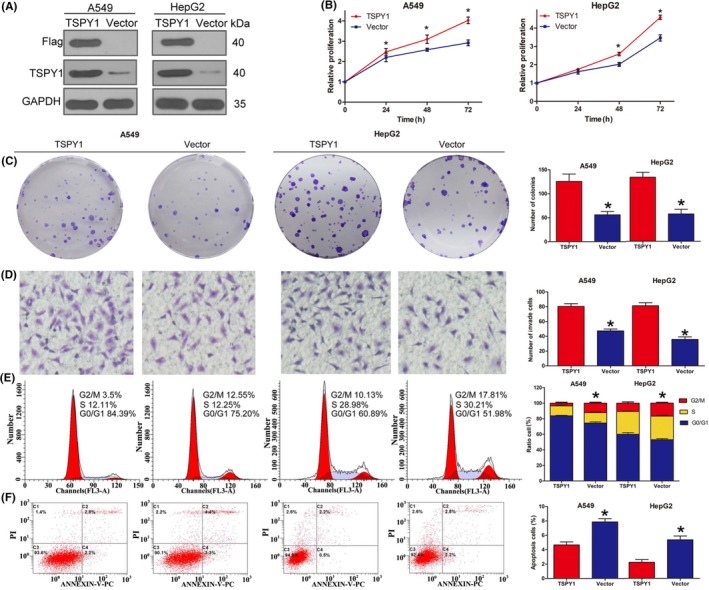
Promotion of cell proliferation, cell cycle transition, cell invasiveness, and inhibition of cell apoptosis by testis‐specific protein, Y‐linked 1 (TSPY1) in A549 lung adenocarcinoma cells and HepG2 liver hepatocellular carcinoma cells. A, Western blot analysis showed that TSPY1 was exogenously overexpressed in A549 and HepG2 cells. B, CCK‐8 assays showed that TSPY1 overexpression enhanced the proliferation of A549 and HepG2 cells. The relative proliferation is presented as the fold change, calculated based on absorbance and normalized to a control value. C, Colony formation assays showed that TSPY1 overexpression increased the colony numbers in A549 and HepG2 cells. Original magnification, ×1. D, Transwell assays showed that TSPY1 overexpression accelerated invasion of A549 and HepG2 cells. Original magnification, ×400. E, Cell cycle assays showed that TSPY1 overexpression promotes G2/M phase transition in the cell cycle, and a shorter phase transition was found in A549 and HepG2 cells. F, Cell apoptosis assays showed that TSPY1 overexpression inhibits apoptosis of A549 and HepG2 cells. Data are presented as the mean ± SD (n = 3, *P < .05)
3.3. Transcriptomic analysis reveals a potential influence of TSPY1 on the function of both PI3K‐AKT and RAS signaling pathways
To investigate the common mechanism by which TSPY1 contributes to the progression and cell phenotypes of LUAD and LIHC, we explored the changes of the gene expression profiles in the A549 and HepG2 cells when TSPY1 was overexpressed through RNA sequencing. The sequencing data from this study have been submitted to the NCBI short read archive portal under accession number SRP152744; raw sequence data were submitted to the NCBI Bio‐project PRJNA479692. We observed that 501 genes were upregulated and 208 genes were downregulated in the TSPY1‐overexpressing A549 cells, and that 117 genes were upregulated and 222 genes were downregulated in the TSPY1‐overexpressing HepG2 cells (Figure S2). Sixteen upregulated genes and nine downregulated genes were found in both TSPY1‐overexpressing cell lines (Figure S2). Then, we undertook GO classification to functionally annotate the DEGs. We obtained a total of 294 and 289 GO assignments in the TSPY1‐overexpressing A549 and HepG2 cells, respectively; approximately 60% comprised biological processes, 19% comprised molecular function, and 21% comprised cellular components in both cells (Figure 3A). In the biological process category, the DEGs were involved in “response to stimulus” (A549, DEG proportion 42.74%; HepG2, 47.55%), “localization” (A549, 36.54%; HepG2, 38.11%), “cellular developmental process” (A549, 31.48%; HepG2, 38.11%), “cell differentiation” (A549, 30.67%; HepG2, 36.71%) and “single‐organism developmental process” (A549, 33.44%; HepG2, 40.56%). In the category of molecular function, most DEGs play roles in “binding” (A549, 58.75%; HepG2, 50.35%) and “catalytic activity” (A549, 25.25%; HepG2, 29.43%). As for the cellular component, a large percentage of DEGs were associated with the categories “cytoplasm” (A549, 60.73%; HepG2, 63.34%), “membrane” (A549, 33.64%; HepG2, 28.94%), and “nucleus” (A549, 30.9%; HepG2, 33.12%). Furthermore, we used the KEGG pathway enrichment analysis to identify potential biological pathways in which TSPY1 might be involved. The KEGG analysis showed that TSPY1 might affect the function of several signaling pathways; only the PI3K‐AKT and RAS signaling pathways were found to have an association with TSPY1 in both A549 and HepG2 cells (Figure 3B). Therefore, we further investigated the influence of TSPY1 on the function of these two signaling pathways in the A549 and HepG2 cells.
Figure 3.
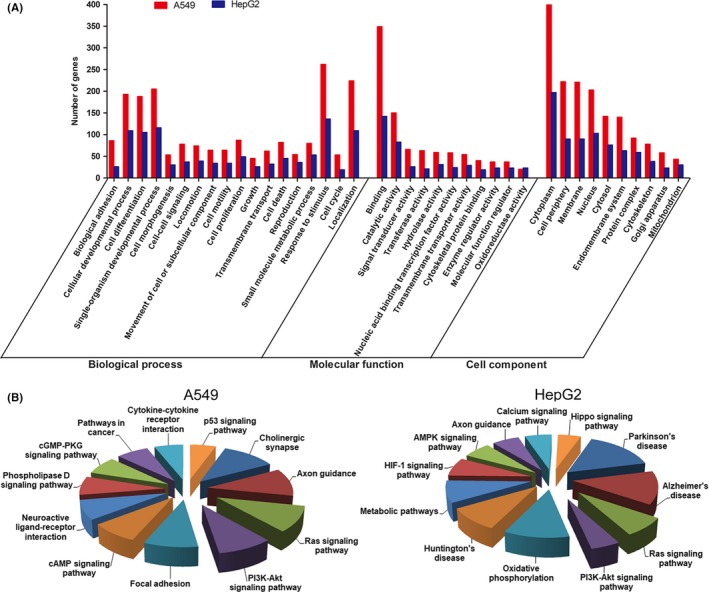
RNA sequencing‐based transcriptomic evidence for the involvement of testis‐specific protein, Y‐linked 1 (TSPY1) in important biological functions and signaling pathways in A549 and HepG2 cells. A, Differentially expressed genes (DEGs) were obtained by RNA sequencing of A549 and HepG2 cells with and without TSPY1 overexpression. Gene Ontology (GO) analysis showed that the functions of the DEGs could be associated with 3 main GO categories include biological process, cellular component, and molecular function. Each bar represents the relative abundance of DEGs classified under each category. B, Kyoto Encyclopedia of Genes and Genomes pathway enrichment analysis showed that TSPY1 could be associated with the function of PI3K/AKT and RAS signaling pathways in TSPY1‐overexpressing A549 and HepG2 cells
In addition, we undertook a protein‐protein interaction network analysis to identify the most significant DEG “hub genes” whose expression is regulated by TSPY1 during tumor progression according to the STRING database (Figures S3 and S4). We obtained 11 hub genes in the A549 cells and 6 hub genes in the HepG2 cells (Figure 4A). We then verified the mRNA level alteration of these hub genes using RT‐qPCR analysis which showed a high consistency with the RNA sequencing results (Figure 4B‐D). Interestingly, the 4 genes JUN, BCL2, RUNX2, and HCFC1 were observed in both cells. Of them, JUN and BCL2 were detected to have the highest degree of connectivity in the network that we constructed using the selected 13 hub genes (Figure 4E). Given that BCL2 and JUN are important downstream molecules of PI3K/AKT and RAS signaling pathways, respectively,20, 21 we postulated that TSPY1 increased the expression of BCL2 and JUN through upregulating the activities of these pathways.
Figure 4.
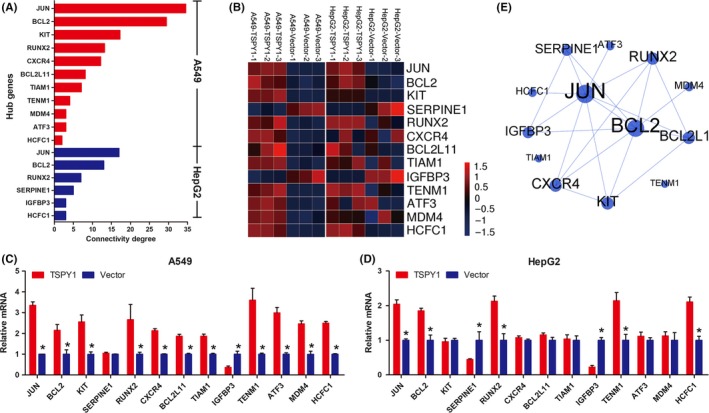
Identification of the hub genes JUN and BCL2 involved in the PI3K/AKT and RAS signaling pathways, respectively, in testis‐specific protein, Y‐linked 1 (TSPY1)‐overexpressing A549 and HepG2 cells. A, A total of 13 differentially expressed genes (11 in A549 and 6 in HepG2 cells) were classified as hub genes, of which 4 (JUN, BCL2, RUNX2, and HCFC1) were found in both cells. B, RNA sequencing heat map showing different expression of the 13 hub genes in TSPY1‐overexpressing A549 and HepG2 cells, relative to controls. C,D, Expression level changes of the 13 hub genes were validated by real‐time quantitative PCR analysis in TSPY1‐overexpressing A549 and HepG2 cells relative to controls. Data are presented as the mean ± SD (n = 3, *P < .05). E, Protein‐protein interaction network analysis of the hub genes showed that JUN and BCL2 were located in the center of the network with the highest degree of connectivity and that there were 6 hub genes (SERPINE1, RUNX2, BCL2L11, KIT, CXCR4, and IGFBP3) with potential connection with both BCL2 and JUN
3.4. Overexpression of TSPY1 promotes activation of PI3K/AKT/mTOR/BCL2 and RAS/RAF/MEK/ERK/JUN signaling pathways
To validate the influence of TSPY1 on PI3K/AKT and RAS signaling pathways, we analyzed the relevant protein level changes in the TSPY1‐overexpressing A549 and HepG2 cells (Figures 5 and S5). As shown in Figure 5A, we observed that the phosphorylated proteins p‐AKT and p‐mTOR in the PI3K‐AKT signaling pathway were significantly increased in both TSPY1‐overexpressing A549 and HepG2 cells and that the upregulation of BCL2 protein was also verified. In addition, we found that TSPY1 contributed to the upregulation of p‐RAF1, p‐MEK1/2, and p‐ERK1/2 in the RAS signaling pathway in both A549 and HepG2 cells and that the JUN protein level was consequently increased (Figures 5B and S5). Considering the significance of PI3K/AKT/mTOR/BCL2 and RAS/RAF/MEK/ERK/JUN signaling pathways in cell proliferation, cycle, invasiveness, and apoptosis,22, 23, 24, 25, 26 we propose that TSPY1 affects cell biological phenotypes probably through a cross‐talk network that involves the molecules with functional regulation of both PI3K/AKT and RAS signaling pathways.
Figure 5.
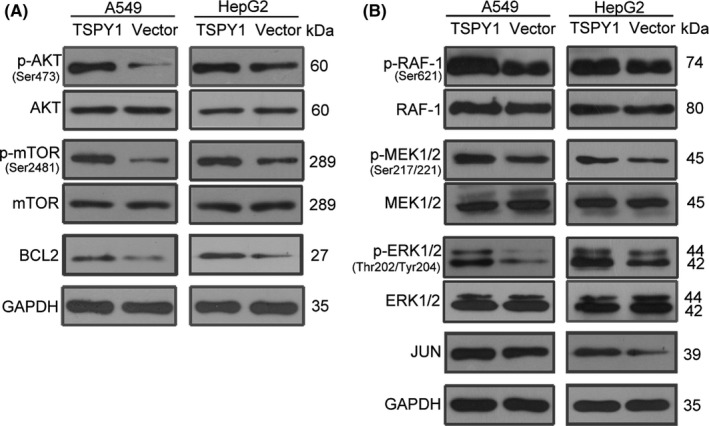
Promotion of the activation of PI3K/AKT and RAS signaling pathways by testis‐specific protein, Y‐linked 1 (TSPY1) in A549 and HepG2 cells. A, Western blot analysis shows higher levels of 3 key proteins (p‐AKT, p‐mTOR, and BCL2) of the PI3K/AKT signaling pathway in TSPY1‐overexpressing A549 and HepG2 cells relative to controls. B, Western blot analysis shows higher levels of 4 key proteins (p‐RAF‐1, p‐MEK1/2, p‐ERK1/2 and JUN) of the RAS signaling pathway in TSPY1‐overexpressing A549 and HepG2 cells relative to controls
3.5. Inhibition of IGFBP3 expression might be a potential way of TSPY1 promoting the activation of PI3K/AKT and RAS signaling pathways
Among the network containing 13 hub genes, we found that IGFBP3 and RUNX2 closely connected with BCL2 and JUN (Figure 4E). Considering that the downregulation of IGFBP3 and the upregulation of RUNX2 expression were confirmed in both TSPY1‐overexpressing cells, we suspected that IGFBP3 and RUNX2 might also be involved in the TSPY‐regulated PI3K/AKT and RAS signaling pathways. As a transcription factor that plays an important role in the regulation of cell proliferation, cell cycle, cell differentiation, and apoptosis, RUNX2 has been reported to be the downstream molecule of the PI3K/AKT and RAS signaling pathways as its transcription‐regulation activity is dependent on the phosphorylation obtained from p‐AKT and p‐ERK.27 Contrarily, IGFBP3 has been suggested to function as an important upstream regulator of both PI3K/AKT and RAS signaling pathways as IGFBP3, acting as an insulin‐like growth factor 1 binding protein, can inhibit the bioactivity of insulin‐like growth factor 1 that activates PI3K/AKT and MAPK signaling.28 In addition, a previous report has shown that ectopic TSPY1 activation and low IGFBP3 expression were presented simultaneously in many hepatocellular carcinoma cases.9 Thus, we hypothesized that TSPY1 suppressed IGFBP3 expression, which resulted in promoted activity of PI3K/AKT and RAS signaling pathways.
To verify this hypothesis, we first confirmed the suppression of TSPY1 on the IGFBP3 protein level in A549 and HepG2 cells (Figure 6A). Then we knocked down IGFBP3 expression in A549 and HepG2 cells, using both shRNA and siRNA targeted to the IGFBP3 gene (Figures 6B and S6), and observed that the reduction of IGFBP3 was associated with the increase of p‐AKT, p‐mTOR, BCL2, p‐RAF, p‐MEK, p‐ERK, and JUN (Figures 6B,C and S6). These results supported that the function of TSPY1 inhibiting IGFBP3 expression can activate the pathways of PI3K/AKT and RAS.
Figure 6.
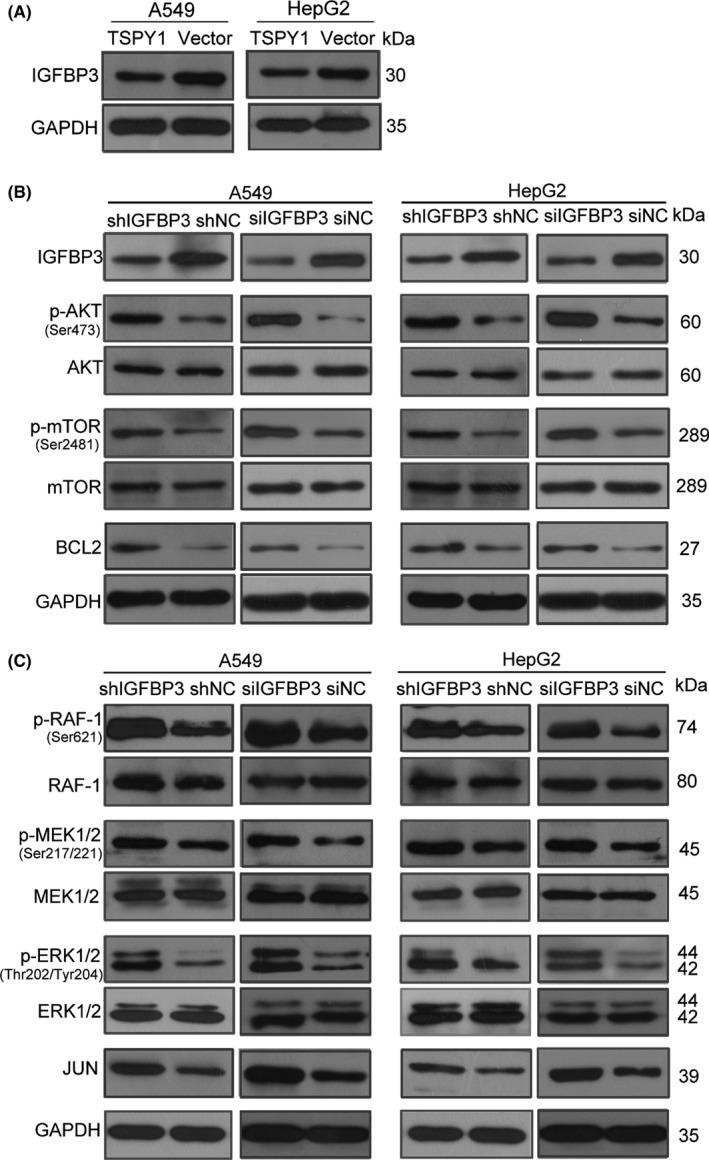
Knockdown of insulin growth factor binding protein 3 (IGFBP3) promotes the activation of PI3K/AKT and RAS pathways in A549 and HepG2 cells. A, Western blot analysis confirmed that testis‐specific protein, Y‐linked 1 (TSPY1) reduced the endogenous IGFBP3 expression in A549 and HepG2 cells. B, Western blot analysis shows decreased IGFBP3 expression was correlated with the increased level of 3 key proteins (p‐AKT, p‐mTOR, and BCL2) of the PI3K/AKT signaling pathway in A549 and HepG2 cells. C, Western blot analysis showed higher levels of 4 key proteins (p‐RAF‐1, p‐MEK1/2, p‐ERK1/2, and JUN) of the RAS signaling pathway in A549 and HepG2 cells with IGFBP3 knockdown, relative to controls (shNC and siNC)
3.6. Transcriptional activity of IGFBP3 suppressed by TSPY1 directly binding to the promoter of IGFBP3
To investigate whether TSPY1 directly binds to the promoter of IGFBP3 to regulate its transcription, we constructed 6 luciferase reporter vectors containing the promoter fragments different in sizes (Figure 7A). After co‐transfecting the constructs with a TSPY1‐expressed vector individually, we found that, compared to a control vector, the relative luciferase activities of 4 fragments were significantly decreased (Figure 7B). Correspondingly, the potential binding region of TSPY1 in the IGFBP3 promoter might be limited from −272 to −172 bp. To further verify the direct binding of TSPY1 to the IGFBP3 promoter, we undertook ChIP assays using an anti‐FLAG Ab to precipitate FLAG‐TSPY1 protein in the chromatin derived from the TSPY1‐overexpressing A549 and HepG2 cells. Then various regions of the IGFBP3 promoter were amplified with the immunoprecipitated DNA (Figure 7C,D), using several pairs of specific primers (Figure 7A), and the PCR products were verified by DNA sequencing. The results suggested that TSPY1 occupied on the fragments from −388 to −205 bp and from −225 to −78 bp in the IGFBP3 promoter (Figure 7C,D). Taken together, these findings suggested that TSPY1 might bind to the region from −225 to −205 bp of the IGFBP3 promoter to suppress the transcriptional activity of IGFBP3, decreasing IGFBP3 expression.
Figure 7.
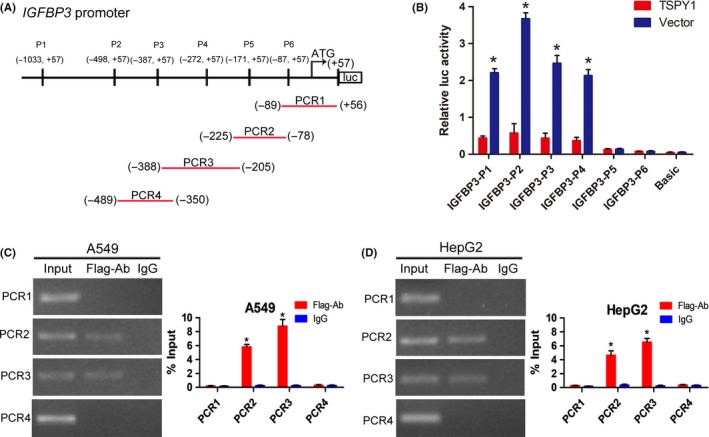
Mechanism of action underlying the suppression of the transcriptional activity of IGFBP3 by testis‐specific protein, Y‐linked 1 (TSPY1). A, Schematic of the IGFBP3 promoter depicting the location of IGFBP3 promoter constructs (P1‐P6) and ChIP‐PCR primers (PCR1‐PCR4). B, Luciferase reporter assays showed that TSPY1 could decrease the luciferase activity of 4 IGFBP3 promoter constructs (P1‐P4) in 293T cells. C,D, ChIP‐PCR assays revealed TSPY1 directly occupied the binding site from −388 to −205 bp and from −225 to −78 bp of the IGFBP3 promoter in A549 (C) and HepG2 (D) cells. Moreover, ChIP‐qPCR analysis showed higher a TSPY1 level in the IGFBP3 promoter when compared to IgG. Data are presented as the mean ± SD (n = 3, *P < .05)
3.7. Knockdown of TSPY1 presents an opposite effect on the biological phenotypes and the activity of PI3K/AKT and RAS signaling pathways in both LCLC‐103H and MHCC97H cells
Considering that TSPY1 is less expressed in both A549 and HepG2 cells, we checked the effect on the cell phenotypes when the TSPY1 level was downregulated in lung carcinoma cell line LCLC‐103H and liver hepatocellular carcinoma cell line MHCC97H in which cells TSPY1 is constitutively expressed (Figure 8A). As expected, the cell proliferation and invasiveness were clearly inhibited (Figure 8B‐D), the transition from G2 to M phase was obstructed (Figure 8E), and apoptosis was accelerated (Figure 8F) in the LCLC‐103H and MHCC97H cells in which the TSPY1 expression was inhibited by special shRNA and siRNA. These results indicated that the targeted block of TSPY1 expression would impede tumor progression.
Figure 8.
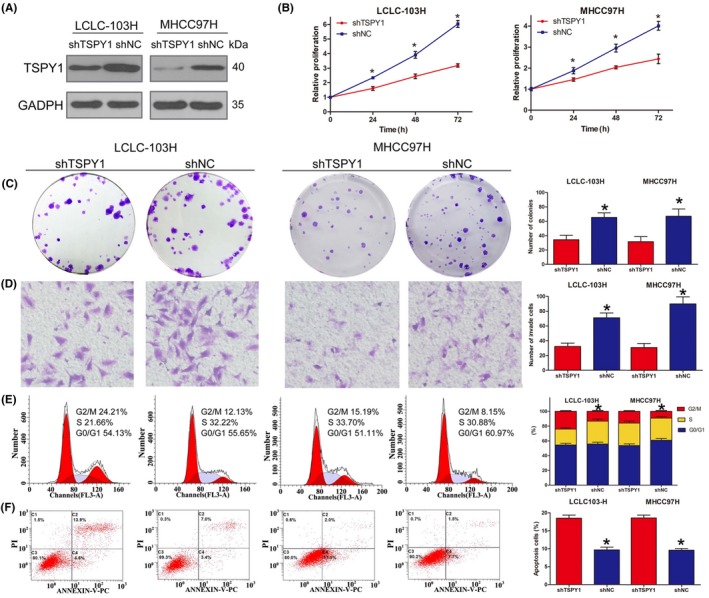
Knockdown of testis‐specific protein, Y‐linked 1 (TSPY1) inhibits cell proliferation, cell cycle transition, and cell invasiveness and promotes cell apoptosis in LCLC‐103H lung carcinoma and MHCC97H liver carcinoma cells. A, Western blot analysis shows decreased endogenous TSPY1 in LCLC‐103H and MHCC97H cells after transfection with the lentiviral TSPY1 shRNA vector. B, CCK‐8 assays show that the knockdown of TSPY1 inhibited the proliferation of LCLC‐103H and MHCC97H cells. Relative proliferation is presented as the fold change, calculated based on absorbance and normalized to a control value. C, Colony formation assays show that the knockdown of TSPY1 decreased the colony numbers of LCLC‐103H and MHCC97H cells. Original magnification, ×1. D, Transwell assays show that the knockdown of TSPY1 could impair invasion of LCLC‐103H and MHCC97H cells. Original magnification, ×400. E, Cell cycle assays show that the knockdown of TSPY1 could extend G2/M phase. F, Cell apoptosis assays show that the knockdown of TSPY1 could promote apoptosis of LCLC‐103H and MHCC97H cells. Data are presented as the mean ± SD (n = 3, *P < .05). shNC, Scrambled shRNA vector acting as a negative control
We then investigated the levels of proteins involved in the signaling pathways of PI3K/AKT and RAS in the TSPY1‐downregulated LCLC‐103H and MHCC97H cells, and observed that the decrease of TSPY1 expression upregulated the IGFBP3 expression (Figures 9A and S7), and contrarily reduced the protein levels of p‐AKT, p‐mTOR, BCL2, p‐RAF, p‐MEK, p‐ERK, and JUN (Figures 9 and S7). These results further confirmed the positive influence of TSPY1 on the activation of PI3K/AKT and RAS signaling pathways through inhibiting IGFBP3 expression.
Figure 9.
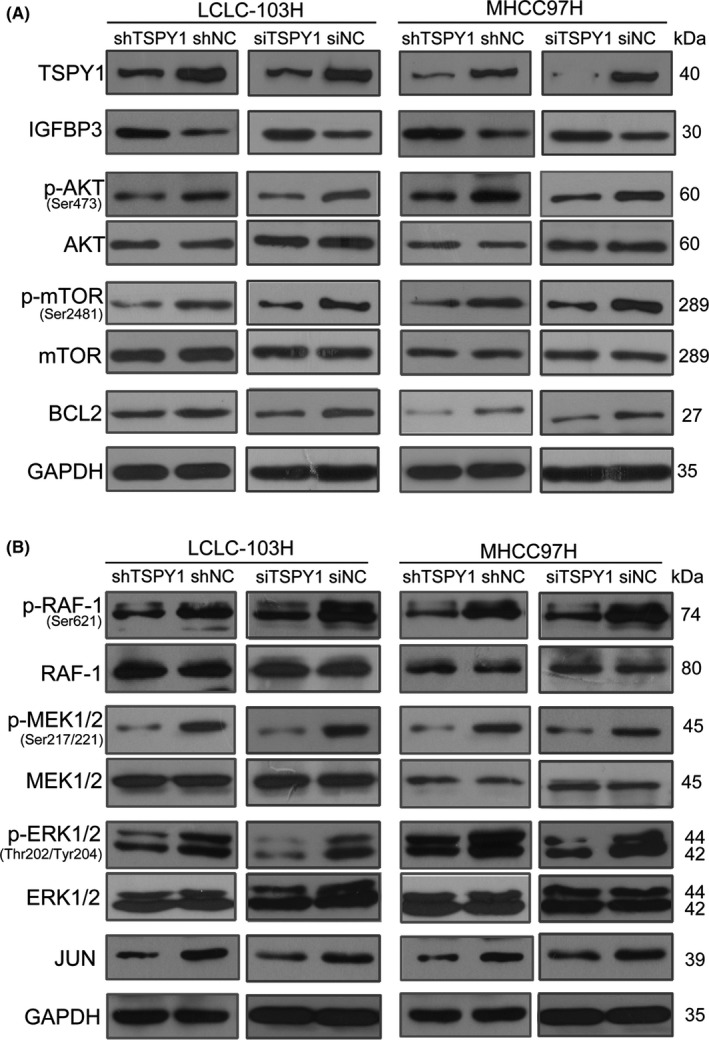
Knockdown of testis‐specific protein, Y‐linked 1 (TSPY1) suppresses the activation of PI3K/AKT and RAS pathways in LCLC‐103H and MHCC97H cells. A, Western blot analysis shows increased insulin growth factor binding protein 3 (IGFBP3) expression and lower levels of 3 key proteins (p‐AKT, p‐mTOR, and BCL2) of the PI3K/AKT signaling pathway in LCLC‐103H and MHCC97H cells with TSPY1 knockdown, relative to controls (shNC and siNC). B, Western blot analysis shows lower levels of 4 key proteins (p‐RAF‐1, p‐MEK1/2, p‐ERK1/2, and JUN) of the RAS signaling pathway in LCLC‐103H and MHCC97H cells with TSPY1 knockdown, relative to controls (shNC and siNC)
4. DISCUSSION
The ectopic activation of TSPY1 is frequently observed in various somatic cancers, and some potential mechanisms associated with the involvement of TSPY1 in tumor progression have been reported.15, 16, 17, 18, 19 In the present study, we presented a novel mechanism underlying the promotion of TSPY1 on IGFBP3‐mediated tumor progression (Figure 10). We identified that TSPY1 promoted the activation of both PI3K/AKT/mTOR/BCL2 and RAS/RAF/MEK/ERK/JUN signaling pathways, and this promotion depended on the inhibition of TSPY1 on IGFBP3 expression. The PI3K/AKT and RAS signaling pathways are key signal transduction components in the regulation of cell growth, cell differentiation, cell cycle, apoptosis, and metastasis,22, 23, 24, 25, 26 and recent reports show that deregulated activation of the 2 signalings is frequently observed in many cancers.29, 30, 31 Therefore, our findings provided a potential common mechanism of TSPY1's function as an oncogene in the tumor process.
Figure 10.
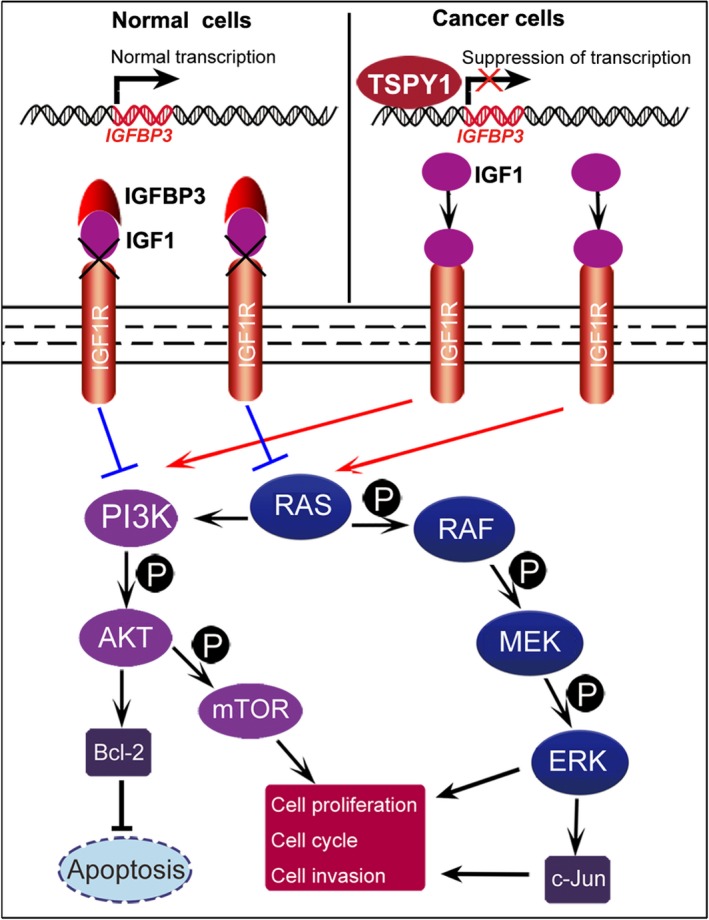
Proposed model for the mechanism of action underlying the promotion of tumor progression by testis‐specific protein, Y‐linked 1 (TSPY1). The ectopic expression of TSPY1 in cancer cells downregulates the mRNA expression of the insulin growth factor binding protein 3 (IGFBP3) gene as a transcription suppressor by occupying its promotion region. The decrease in the level of IGFBP3 protein in the cell reduces its extracellular secretions and impairs its capability that sequesters insulin‐like growth factor 1 (IGF1) from IGF1 receptor (IGF1R). Augmenting of the IGF1/IGF1R‐mediated signal activates both PI3K/AKT and RAS signaling pathways and upregulates the expression of BCL‐2, p‐mTOR, p‐ERK, and JUN. The enhancement of functions of these 4 proteins facilitates cell proliferation, cycle transition, and invasion and inhibits cell apoptosis, probably promoting tumor progression
Previous studies have shown that IGFBP3, a tumor suppressor, inhibits cell proliferation, promotes apoptosis, and reduces growth in various cancers, including prostate cancer,32 colorectal cancer,33 breast cancer,34 and ovarian endometrioid carcinoma.35 Recent reports also showed that the low levels of IGFBP3 were correlated with poor prognosis for patients with hepatocellular carcinoma36 and that Igfbp3‐null mice experienced increased lung tumor burden.37 These observations strongly suggest the significance of IGFBP3 in tumorigenesis. In the present study, we found the inhibitory effect of TSPY1 on IGFBP3 transcriptional activity by binding to IGFBP3 promoter and the following activation of PI3K/AKT and RAS signaling pathways. These findings provide evidence that TSPY1 is an upstream modulator of IGFBP3 and the ectopic activation of TSPY1 disrupts the suppressing ability of IGFBP3 on tumor progression.
Considered a transcription regulator, TSPY1 was found to upregulate its transcriptional activity by binding to the exon‐1 of its own gene.38 It also promotes the transcription of its homologous gene TSPYL5 by binding to the TSPYL5 promoter.19 Surprisingly, in this study, we found that TSPY1 had a negative effect on the transcription of IGFBP3, indicating that the transactivating ability of TSPY1 depends on the availability of other specific cofactors. Similarly, B‐myb, another transcriptional factor, also possesses dual characters in the transcription regulation activities of repression and activation.39, 40 A recent report also showed that B‐myb, like TSPY1, suppressed the IGFBP3 expression and upregulated the proliferation and migration of non‐small‐cell lung cancer cells.41 Given that SET and NAP1 family proteins play multiple functions, such as histone chaperones,42 the transcriptional regulation ability of enhancer or suppressor might depend on additional regulatory factors that can generate a transcriptional complex with TSPY1. However, these transcriptional complexes containing TSPY1 need to be verified in future investigations.
Sex disparities in incidence and progression are frequently identified in various human diseases.43 The risk of greater incidence, higher mortality rate, and lower survival are observed in male patients relative to female patients for 32 of 36 cancer types studied.44, 45 The mechanisms responsible for the gender differences in cancer development and prognosis remain largely unknown. The most significant genetic trait of men is genes on their Y chromosome, which could provide a reason for such male preference in cancer. A recent study has revealed that the loss of the Y chromosome in the peripheral blood is closely associated with shorter survival and higher incidence risk of cancer in males.46 Additionally, the ectopic expression of MSY‐linked genes, including TSPY1, RBMY, and VCY, was observed in various male‐biased somatic cancers, particularly in liver and lung cancer.9, 47, 48, 49 These observations suggest that the Y chromosome might be involved in the development, progression, and outcomes of cancers in a male‐specific manner. In the current study, we confirmed that the ectopic expression of TSPY1 was associated with higher mortality and worse overall survival probability in male patients with LUAD or LIHC, which further provided evidence to suggest that TSPY1 might contribute to the sex disparities in some cancers, particularly LUAD and LIHC.
Cancer/testis antigens are important for cancer diagnosis and immunotherapy due to their tumor‐restricted expression pattern and high immunogenicity. Several clinical trials assessed CT antigens, such as MAGE‐A3 and NYESO‐1, as vaccine therapy in patients with lung, prostate, and ovarian cancers and melanoma.50, 51, 52, 53 Cancer‐testis genes are generally located on the X chromosome,54 rarely on the Y chromosome. However, it is important to identify Y chromosome‐linked CT genes, particularly for the diagnosis and immunotherapy of male patients with cancers. In the present study, we observed that TSPY1 was frequently ectopically activated in different male somatic tumor specimens and identified a significant correlation between TSPY1 activation, higher mortality, and worse overall survival probability in male patients with LUAD or LIHC. The clinical findings, together with the potential of TSPY1 in cell proliferation, cell invasion, cell cycle transition, and cell apoptosis, suggest that TSPY1 acting as a CT antigen could be a target for diagnosis and immunotherapy in male patients with some cancers.
In conclusion, we presented a comprehensive set of clinical and experimental evidence establishing TSPY1 as an oncogenic factor that facilitates tumor progression and causes poor prognosis in male patients with LUAD or LIHC. Our findings revealed that TSPY1 strongly promotes the activation of the PI3K/AKT and RAS signaling pathways through suppressing IGFBP3 gene transcription, providing a novel explanation for the contribution of TSPY1 to tumor progression.
CONFLICT OF INTEREST
The authors declare that they have no conflicts of interest.
Supporting information
ACKNOWLEDGMENTS
This work was supported by Grants from the National Natural Science Foundation of China (Nos. 81370748, 81773159 and 81871203) and Sichuan Science and Technology Program (No. 2018FZ0035). We are grateful to Professor Yun‐Fai Chris Lau (University of California) for providing the mouse monoclonal Ab against TSPY1.
Tu W, Yang B, Leng X, et al. Testis‐specific protein, Y‐linked 1 activates PI3K/AKT and RAS signaling pathways through suppressing IGFBP3 expression during tumor progression. Cancer Sci. 2019;110:1573–1586. 10.1111/cas.13984
Tu and Yang contributed equally to this work.
Contributor Information
Yunqiang Liu, Email: yq_liu@scu.edu.cn.
Yuan Yang, Email: yangyuan@scu.edu.cn.
REFERENCES
- 1. Skaletsky H, Kuroda‐Kawaguchi T, Minx PJ, et al. The male‐specific region of the human Y chromosome is a mosaic of discrete sequence classes. Nature. 2003;423:825‐837. [DOI] [PubMed] [Google Scholar]
- 2. Manz E, Schnieders F, Brechlin AM, Schmidtke J. TSPY‐Related Sequences represent a microheterogeneous gene family organized as constitutive elements in DYZ5 tandem repeat units on the human Y chromosome. Genomics. 1993;17:726‐731. [DOI] [PubMed] [Google Scholar]
- 3. Schnieders F, Dörk T, Arnemann J, et al. Testis‐specific protein, Y‐encoded (TSPY) expression in testicular tissues. Hum Mol Genet. 1996;5:1801‐1807. [DOI] [PubMed] [Google Scholar]
- 4. Lau YF. Gonadoblastoma, testicular and prostate cancers, and the TSPY gene. Am J Hum Genet. 1999;64:921‐927. [DOI] [PMC free article] [PubMed] [Google Scholar]
- 5. Tsuchiya K, Reijo R, Page DC, Disteche CM. Gonadoblastoma: molecular definition of the susceptibility region on the Y chromosome. Am J Hum Genet. 1995;57:1400‐1407. [PMC free article] [PubMed] [Google Scholar]
- 6. Li Y, Vilain E, Conte F, et al. Testis‐specific protein Y‐encoded gene is expressed in early and late stages of gonadoblastoma and testicular carcinoma in situ. Urol Oncol. 2007;25:141‐146. [DOI] [PubMed] [Google Scholar]
- 7. Lau YF, Li Y, Kido T. Gonadoblastoma locus and the TSPY gene on the human Y chromosome. Birth Defects Res C Embryo Today. 2009;87:114‐122. [DOI] [PubMed] [Google Scholar]
- 8. Li Y, Tabatabai ZL, Lee TL, et al. The Y‐encoded TSPY protein: a significant marker potentially plays a role in the pathogenesis of testicular germ cell tumors. Hum Pathol. 2007;38:1470‐1481. [DOI] [PMC free article] [PubMed] [Google Scholar]
- 9. Kido T, Lo RC, Li Y, et al. The potential contributions of a Y‐located protooncogene and its X homologue in sexual dimorphisms in hepatocellular carcinoma. Hum Pathol. 2014;45:1847‐1858. [DOI] [PubMed] [Google Scholar]
- 10. Gallagher WM, Bergin OE, Rafferty M, et al. Multiple markers for melanoma progression regulated by DNA methylation: insights from transcriptomic studies. Carcinogenesis. 2005;26:1856‐1867. [DOI] [PubMed] [Google Scholar]
- 11. Kido T, Hatakeyama S, Ohyama C, Lau YF. Expression of the Y‐encoded TSPY is associated with progression of prostate cancer. Genes (Basel). 2010;1:283‐293. [DOI] [PMC free article] [PubMed] [Google Scholar]
- 12. Shikama N, Chan HM, Krstic‐Demonacos M, et al. Functional interaction between nucleosome assembly proteins and p300/CREB‐binding protein family coactivators. Mol Cell Biol. 2000;20:8933‐8943. [DOI] [PMC free article] [PubMed] [Google Scholar]
- 13. Mosammaparast N, Ewart CS, Pemberton LF. A role for nucleosome assembly protein 1 in the nuclear transport of histones H2A and H2B. EMBO J. 2002;21:6527‐6538. [DOI] [PMC free article] [PubMed] [Google Scholar]
- 14. Nagata K, Kawase H, Handa H, et al. Replication factor encoded by a putative oncogene, set, associated with myeloid leukemogenesis. Proc Natl Acad Sci USA. 1995;92:4279‐4283. [DOI] [PMC free article] [PubMed] [Google Scholar]
- 15. Oram SW, Liu XX, Lee TL, et al. TSPY potentiates cell proliferation and tumorigenesis by promoting cell cycle progression in HeLa and NIH3T3 cells. BMC Cancer. 2006;6:154. [DOI] [PMC free article] [PubMed] [Google Scholar]
- 16. Li Y, Lau YF. TSPY and its X‐encoded homologue interact with cyclin B but exert contrasting functions on cyclin‐dependent kinase 1 activities. Oncogene. 2008;27:6141‐6150. [DOI] [PubMed] [Google Scholar]
- 17. Kido T, Lau YF. The human Y‐encoded testis‐specific protein interacts functionally with eukaryotic translation elongation factor eEF1A, a putative oncoprotein. Int J Cancer. 2008;123:1573‐1585. [DOI] [PubMed] [Google Scholar]
- 18. Li Y, Zhang DJ, Qiu Y, et al. The Y‐located proto‐oncogene TSPY exacerbates and its X‐homologue TSPX inhibits transactivation functions of androgen receptor and its constitutively active variants. Hum Mol Genet. 2017;26:901‐912. [DOI] [PMC free article] [PubMed] [Google Scholar]
- 19. Shen Y, Tu W, Liu Y, et al. TSPY1 suppresses USP7‐mediated p53 function and promotes spermatogonial proliferation. Cell Death Dis. 2018;9:542. [DOI] [PMC free article] [PubMed] [Google Scholar]
- 20. Hers I, Vincent EE, Tavaré JM. Akt signalling in health and disease. Cell Signal. 2011;23:1515‐1527. [DOI] [PubMed] [Google Scholar]
- 21. Dhillon AS, Hagan S, Rath O, Kolch W. MAP kinase signalling pathways in cancer. Oncogene. 2007;26:3279‐3290. [DOI] [PubMed] [Google Scholar]
- 22. Yu P, Ye L, Wang H, et al. NSK‐01105 inhibits proliferation and induces apoptosis of prostate cancer cells by blocking the Raf/MEK/ERK and PI3K/AKT/mTOR signal pathways. Tumor Biol. 2015;36:2143‐2153. [DOI] [PubMed] [Google Scholar]
- 23. Wang C, Li Z, Shao F, et al. High expression of Collagen Triple Helix Repeat Containing 1 (CTHRC1) facilitates progression of oesophageal squamous cell carcinoma through MAPK/MEK/ERK/FRA‐1 activation. J Exp Clin Cancer Res. 2017;36:84. [DOI] [PMC free article] [PubMed] [Google Scholar]
- 24. Wang Y, Nie H, Zhao X, et al. Bicyclol induces cell cycle arrest and autophagy in HepG2 human hepatocellular carcinoma cells through the PI3K/AKT and RaS/RAF/MEK/ERK pathways. BMC Cancer. 2016;16:742. [DOI] [PMC free article] [PubMed] [Google Scholar]
- 25. Butler DE, Marlein C, Walker HF, et al. Inhibition of the PI3K/Akt/mTOR pathway activates autophagy and compensatory RaS/RAF/MEK/ERK signalling in prostate cancer. Oncotarget. 2017;8:56698‐56713. [DOI] [PMC free article] [PubMed] [Google Scholar]
- 26. Wang H, Yu Z, Huo S, et al. Overexpression of ELF3 facilitates cell growth and metastasis through PI3K/Akt and ERK signaling pathways in non‐small cell lung cancer. Int J Biochem Cell Biol. 2018;94:98‐106. [DOI] [PubMed] [Google Scholar]
- 27. Kanno T, Takahashi T, Tsujisawa T, et al. Mechanical stress‐mediated Runx2 activation is dependent on Ras/ERK1/2 MAPK signaling in osteoblasts. J Cell Biochem. 2007;101:1266‐1277. [DOI] [PubMed] [Google Scholar]
- 28. Lee HY, Chun KH, Liu B, et al. Insulin like growth factor binding protein‐3 inhibits the growth of non‐small cell lung cancer. Cancer Res. 2002;62:3530‐3537. [PubMed] [Google Scholar]
- 29. Cancer Genome Atlas Research Network . Comprehensive molecular profiling of lung adenocarcinoma. Nature. 2014;511:543‐550. [DOI] [PMC free article] [PubMed] [Google Scholar]
- 30. Huynh H, Nguyen TT, Chow KH, et al. Over‐expression of the mitogen‐activated protein kinase (MAPK) kinase (MEK)‐MAPK in hepatocellular carcinoma: its role in tumor progression and apoptosis. BMC Gastroenterol. 2003;3:19. [DOI] [PMC free article] [PubMed] [Google Scholar]
- 31. Janku F, Kaseb AO, Tsimberidou AM, et al. Identification of novel therapeutic targets in the PI3K/Akt/mTOR pathway in hepatocellular carcinoma using targeted next generation sequencing. Oncotarget. 2014;5:3012‐3022. [DOI] [PMC free article] [PubMed] [Google Scholar]
- 32. Wang L, Habuchi T, Tsuchiya N, et al. Insulin‐like growth factor‐binding protein‐3 gene ‐202 A/C polymorphismis correlated with advanced disease status in prostate cancer. Cancer Res. 2003;63:4407‐4411. [PubMed] [Google Scholar]
- 33. Ma J, Pollak MN, Giovannucci E, et al. Prospective study of colorectal cancer risk in men and plasma levels ofinsulin‐like growth factor (IGF)‐I and IGF‐binding protein‐3. J Natl Cancer Inst. 1999;91:620‐625. [DOI] [PubMed] [Google Scholar]
- 34. Tas F, Karabulut S, Bilgin E, et al. Clinical significance of serum insulin‐like growth factor‐1 (IGF‐1) and insulin‐like growth factor binding protein‐3 (IGFBP‐3) in patients with breast cancer. Tumor Biol. 2014;35:9303‐9309. [DOI] [PubMed] [Google Scholar]
- 35. Torng PL, Lee YC, Huang CY, et al. Insulin‐like growth factor binding protein‐3 (IGFBP‐3) acts as an invasion‐metastasis suppressor in ovarian endometrioid carcinoma. Oncogene. 2008;27:2137‐2147. [DOI] [PubMed] [Google Scholar]
- 36. Yan J, Yang X, Li L, et al. Low expression levels of insulin‐like growth factor binding protein‐3 are correlated with poor prognosis for patients with hepatocellular carcinoma. Oncol Lett. 2017;13:3395‐3402. [DOI] [PMC free article] [PubMed] [Google Scholar]
- 37. Wang YA, Sun Y, Palmer J, et al. IGFBP3 modulates lung Tumorigenesis and cell growth through IGF1 signaling. Mol Cancer Res. 2017;15:896‐904. [DOI] [PubMed] [Google Scholar]
- 38. Kido T, Lau YF. The Y‐located gonadoblastoma gene TSPY amplifies its own expression through a positive feedback loop in prostate cancer cells. Biochem Biophys Res Commun. 2014;446:206‐211. [DOI] [PubMed] [Google Scholar]
- 39. Cicchillitti L, Jimenez SA, Sala A, Saitta B. B‐Myb acts as a repressor of human COL1A1 collagen gene expression by interacting with Sp1 and CBF factors in scleroderma fibroblasts. Biochem J. 2004;378(Pt 2):609‐616. [DOI] [PMC free article] [PubMed] [Google Scholar]
- 40. Sala A, Saitta B, De Luca P, et al. B‐MYB transactivates its own promoter through SP1‐binding sites. Oncogene. 1999;18:1333‐1339. [DOI] [PubMed] [Google Scholar]
- 41. Fan X, Wang Y, Jiang T, et al. B‐Myb mediates proliferation and migration of non‐small‐cell lung cancer via suppressing IGFBP3. Int J Mol Sci. 2018;19:E1479. [DOI] [PMC free article] [PubMed] [Google Scholar]
- 42. Muto S, Senda M, Akai Y, et al. Relationship between the structure of SET/TAF‐Ibeta/INHAT and its histone chaperone activity. Proc Natl Acad Sci USA. 2007;104:4285‐4290. [DOI] [PMC free article] [PubMed] [Google Scholar]
- 43. US Institute of Medicine . Exploring the biological contributions to human health: does sex matter? J Womens Health Gend Based Med. 2001;10:433‐439. [DOI] [PubMed] [Google Scholar]
- 44. Cook MB, McGlynn KA, Devesa SS, et al. Sex disparities in cancer mortality and survival. Cancer Epidemiol Biomarkers Prev. 2011;20:1629‐1637. [DOI] [PMC free article] [PubMed] [Google Scholar]
- 45. Cook MB, Dawsey SM, Freedman ND, et al. Sex disparities in cancer incidence by period and age. Cancer Epidemiol Biomarkers Prev. 2009;18:1174‐1182. [DOI] [PMC free article] [PubMed] [Google Scholar]
- 46. Forsberg LA, Rasi C, Malmqvist N, et al. Mosaic loss of chromosome Y in peripheral blood is associated with shorter survival and higher risk of cancer. Nat Genet. 2014;46:624‐628. [DOI] [PMC free article] [PubMed] [Google Scholar]
- 47. Tsuei DJ, Hsu HC, Lee PH, et al. RBMY, a male germ cell‐specific RNA‐binding protein, activated in human liver cancers and transforms rodent fibroblasts. Oncogene. 2004;23:5815‐5822. [DOI] [PubMed] [Google Scholar]
- 48. Tsuei DJ, Lee PH, Peng HY, et al. Male germ cell‐specific RNA binding protein RBMY: a new oncogene explaining male predominance in liver cancer. PLoS ONE. 2011;6:e26948. [DOI] [PMC free article] [PubMed] [Google Scholar]
- 49. Taguchi A, Taylor AD, Rodriguez J, et al. A search for novel cancer/testis antigens in lung cancer identifies VCX/Y genes expanding the repertoire of potential immunotherapeutic targets. Cancer Res. 2014;74:4694‐4705. [DOI] [PMC free article] [PubMed] [Google Scholar]
- 50. Slingluff CL Jr, Petroni GR, Chianese‐Bullock KA, et al. Immunologic and clinical outcomes of a randomized phase II trial of two multipeptide vaccines for melanoma in the adjuvant setting. Clin Cancer Res. 2007;13:6386‐6395. [DOI] [PubMed] [Google Scholar]
- 51. Odunsi K, Qian F, Matsuzaki J, et al. Vaccination with an NY‐ESO‐1 peptide of HLA class I/II specificities induces integrated humoral and T cell responses in ovarian cancer. Proc Natl Acad Sci USA. 2007;104:12837‐12842. [DOI] [PMC free article] [PubMed] [Google Scholar]
- 52. Atanackovic D, Altorki NK, Cao Y, et al. Booster vaccination of cancer patients with MAGE‐A3 protein reveals long‐term immunological memory or tolerance depending on priming. Proc Natl Acad Sci USA. 2008;105:1650‐1655. [DOI] [PMC free article] [PubMed] [Google Scholar]
- 53. Jäger E, Karbach J, Gnjatic S, et al. Recombinant vaccinia/fowlpox NY‐ESO‐1 vaccines induce both humoral and cellular NY‐ESO‐1‐specific immune responses in cancer patients. Proc Natl Acad Sci USA. 2006;103:14453‐14458. [DOI] [PMC free article] [PubMed] [Google Scholar]
- 54. Rajagopalan K, Mooney SM, Parekh N, et al. A majority of the cancer/testis antigens are intrinsically disordered proteins. J Cell Biochem. 2011;112:3256‐3267. [DOI] [PMC free article] [PubMed] [Google Scholar]
Associated Data
This section collects any data citations, data availability statements, or supplementary materials included in this article.
Supplementary Materials


