

Abstract
There is a strong demand for bioanalytical techniques to rapidly detect protease activities with high sensitivity and high specificity. This study reports an activity-based electrochemical method toward this goal. Nanoelectrode arrays (NEAs) fabricated with embedded vertically aligned carbon nanofibers (VACNFs) are functionalized with specific peptide substrates containing a ferrocene (Fc) tag. The kinetic proteolysis curves are measured with continuously repeated ac voltammetry, from which the catalytic activity is derived as the inverse of the exponential decay time constant based on a heterogeneous Michaelis–Menten model. Comparison of three peptide substrates with different lengths reveals that the hexapeptide H2N─(CH2)4─CO─Pro-Leu-Arg-Phe-Gly-Ala─NH─CH2─Fc is the optimal probe for cathepsin B. The activity strongly depends on temperature and is the highest around the body temperature. With the optimized peptide substrate and measuring conditions, the limit of detection of cathepsin B activity and concentration can reach 2.49 × 10⁻⁴ s−1 and 0.32 nM, respectively. The peptide substrates show high specificity to the cognate proteases, with negligible cross-reactions among three cancer-related proteases cathepsin B, ADAM10, and ADAM17. This electrochemical method can be developed into multiplex chips for rapid profiling of protease activities in cancer diagnosis and treatment monitoring.
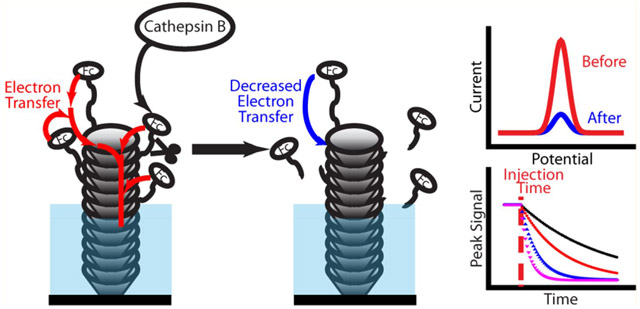
Graphical Abstract
It is well-recognized that overexpression, increased activity, and altered localization of many proteases are associated with tumor progression.1 Many clinical therapeutics or drugs under development target proteases.2,3 However, quantitative analyses of proteases for cancer diagnosis and treatment monitoring are challenging, because there are more than 500 known proteases and they interact with each other in complex activation cascades and networks.4–7 Hence, there is a strong demand for developing bioanalytical techniques that can rapidly detect protease activities with high sensitivity and high specificity. Techniques with the capability for parallel profiling of protease activities are particularly attractive.3,8 Here we report the study on the quantitative analysis of cathepsin B activity using a peptide-functionalized nanoelectrode array (NEA), which can be potentially developed into multiplex electronic chips for rapidly profiling the activity of many proteases simultaneously.
Cathepsin B, a member of the cathepsin family, is one of the most studied proteases, which hydrolyzes peptides and proteins in lysosome in an acidic environment. Typically, there are three subgroups in the cathepsin family (cysteine, aspartic, and serine cathepsins).9 Cathepsin B is a cysteine protease, functioning in protein hydrolysis, cell death, antigen presentation, and tissue homeostasis.10–12 According to recent studies, cathepsin B has been implicated in cancer progression to degrade extracellular matrix.13,14 It is overexpressed in various cancers including breast, colorectal, prostate, and gastric cancer.1 Therefore, developing a rapid, sensitive, and specific method for detecting cathepsin B is critical for cancer diagnosis and therapeutic efficacy assessment.
Various techniques have been developed for detecting proteases, which can be divided into two classes: (1) affinity assays that detect the total protease concentration (including both inactive proenzymes and active enzymes) such as immunohistochemistry15 and enzyme-linked immunosorbent assay (ELISA),16–18 and (2) activity assays that detect the protease functions (the proteolytic activity of active enzymes) based on the catalytic cleavage of specifically designed peptide substrates by the cognate protease.8,19 The activity assay is particularly useful in cancer diagnosis since it reflects the true biological function of the target proteases. So far, most activity-based protease sensors use fluorogenic techniques based on fluorescence resonance energy transfer (FRET), in which the dye and quencher labeled peptide substrate emits strong fluorescence upon being proteolyzed into separate fragments by the cognate protease.8,19 However, interference from autofluorescence of indigenous molecules can easily affect the detection in complex samples such as plasma or cell lysates. The capability for multiplex detection is also limited due to overlap of the broad spectra of fluorescent dyes.
Electrochemical methods are recognized as an attractive alternative technique due to their high sensitivity and multiplexing capability.20 Moreover, electrochemical systems can be easily integrated and miniaturized.21 They can be developed into activity-based protease sensors by functionalizing the electrodes with proper peptide substrates. Liu et al. first demonstrated electrochemical detection of matrix metalloproteinase-7 (MMP-7) by monitoring the proteolytic process of ferrocene (Fc)-labeled nonapeptide on a gold electrode.22 A very low detection limit of 3.4 pM was obtained using square wave voltammetry. The peptide probe was found highly specific to MMP-7 over other MMP family enzymes such as MMP-2 and MMP-3. From then on, more electrochemical techniques have been reported for detecting proteases, such as plasmin,23 trypsin,24 α-thrombin,24 renin,25 and caspase 3.26 However, these studies all focused on assessing the detection limit of the protease concentration. The capability to derive protease activity based on quantitative analysis of the real-time proteolytic kinetics has not been adequately explored. As mentioned above, the activity shows how fast the peptide probes are proteolyzed by a specific protease. It depends on both the protease concentration and the specific peptide sequence used as the substrate. Quantitative determination of the protease activity with highly specific peptide substrates is critical to achieve the desired selectivity toward multiplex detection of complex biological samples containing many types of proteases.
Recently, we have demonstrated that a NEA fabricated with vertically aligned carbon nanofibers (VACNFs) can serve as a unique electrochemical platform for detecting protease activities.27–29 VACNFs of ~100 nm in diameter and ~5 μm in length are grown on a chromium-coated Si wafer in uniform vertical alignment and are fully separated from each other, forming a brushlike structure. With further processes to encapsulate the VACNFs in SiO2 by chemical vapor deposition (CVD) followed by mechanical polishing and reactive ion etching (RIE), ~100 nm long VACNF tips can be exposed above the SiO2 matrix, forming a stable NEA. The VACNF NEA can be used to detect proteolysis with ac voltammetry (ACV) by covalently attaching the exposed tip with proper peptide probes containing a ferrocene (Fc) redox tag at the distal end. Such NEAs have shown improved temporal resolution and reduced steric hindrance.27 Thus, reliable realtime proteolytic kinetics can be recorded and the protease activity can be quantitatively derived based on a heterogeneous Michaelis–Menten model. 27, 28 Reliable detection of the activity of cancer-related proteases (legumain and cathepsin B) has been demonstrated in buffer solutions27 as well as in complex samples such as tissue lysates28 and cancer cell lysates.30
Our previous studies used rather simple peptide sequences with only four amino acids (i.e., tetrapeptides) as the substrate probe, and the system was not optimized regarding the sensitivity and selectivity. Here, we report a systematic study on the effects of peptide length (using tetrapeptide, hexapeptide, and octapeptide) and incubation temperature (at 19.3, 29.5, 38.6, and 44.2 °C) on the kinetic proteolysis of cathepsin B. The limit of detection (LOD) of cathepsin B activity and concentration have been determined to be 2.49 × 10⁻⁴ s−1 and 0.32 nM, respectively, under the optimized conditions (hexapeptide at 38.6 °C). The latter is more than 10 times lower than that in our previous study.28 Furthermore, the Fc–hexapeptide-functionalized VACNF NEA shows very high selectivity, with essentially no measurable cross-reaction with 6.0 nM of other two cancer-related proteases (ADAM10 and ADAM17). These results demonstrate a great potential for a multiplex electrochemical chip for rapid profiling of protease activities in cancer diagnosis.
EXPERIMENTAL SECTION
Materials and Instruments.
These are detailed in the Supporting Information. The peptide substrates and their cognate proteases are summarized in Table 1. The compositions of storage, activation, and assay buffers are detailed in Table S1.
Table 1.
Peptide Substrate Sequences and Cognate Proteases
| no. | peptide substrate sequences | protease | Dtna |
|---|---|---|---|
| 1 | Z-Leu-Arg-AMC | cathepsin B | FLb |
| 2 | Mca-Lys-Pro-Leu-Gly-Leu-Dpa-Ala-Arg─NH2 | ADAM10 ADAM17 | FL |
| 3 | A-Leu-Arg-Phe-Gly-Bc | cathepsin B | ECb |
| 4 | A-Pro-Leu-Arg-Phe-Gly-Ala-B | cathepsin B | EC |
| 5 | A-Ala-Pro-Leu-Arg-Phe-Gly-Ala-Ala-B | cathepsin B | EC |
| 6 | A-Lys-Pro-Leu-Gly-Leu-Ser-Ala-Arg-B | ADAM17 | EC |
Dtn, detection method.
FL, fluorescence; EC, electrochemical.
A, linker H2N(CH2)4CO─ at the N-terminus; B, redox tag ─NHCH2Fc at the C-terminus.
Fabrication of the VACNF NEA Chip.
The procedures to fabricate VACNF NEA chips follow our previous reports27,28,30–33 and are detailed in the Supporting Information. Briefly, VACNFs with an average length of ~5 μm were grown on a 100 nm Cr film coated on a polished Si(100) wafer using plasma-enhanced chemical vapor deposition (PECVD). With the help of the Ni catalyst and the electric field, CNFs were uniformly aligned along the surface normal in a tip growth mode, forming a brushlike structure. As illustrated in Figure S1, SiO2 was then deposited with tetraethyl orthosilicate (TEOS) precursor in a tube furnace to encapsulate the VACNFs. Mechanical polishing followed by RIE with CHF3 selectively removed the desired amount of SiO2 and exposed about ~50–100 nm long VACNF tips as the active electrodes.
Passivation and Functionalization of Peptides to the VACNF NEA Chip.
To reduce nonspecific adsorption, the SiO2 surface was modified with a passivation layer terminated with an ethylene glycol moiety as described in the Supporting Information. Electrochemical etching was performed to specifically remove the passivating molecules attached to the exposed VACNF tips and produce active VACNF tip surface with abundant carboxylic acid groups. Cyclic voltammetry (CV) was carried out in 1.0 mM K4Fe(CN)6 benchmark redox solution (Figure S2) to examine the VACNF NEA and ensure an active electrode (with <150 mV peak separation) with a small background current. The substrate peptides with a general structure of H2N─(CH2)4─CO─peptide─NH─CH2─Fc containing a flexible linker at the N-terminus and a redox tag Fc at the C-terminus were then covalently attached to the exposed VACNF tip through an amide bond using EDC and sulfo-NHS as coupling reagents (see details in the Supporting Information).
Electrochemical Measurements.
ACV was used for electrochemical measurements of protease activities in a homemade Teflon cell in the three-electrode configuration with a coiled Pt wire as the counter electrode, Ag/AgCl (3.0 M KCl, saturated with Ag+) as the reference electrode, and a peptide-modified VACNF NEA chip as the working electrode. The electrolytes, i.e., the assay buffers, for each protease are listed Table S1. The temperature was controlled by passing liquid ethylene glycol from a thermal circulator through the channels in a copper heat sink placed beneath the VACNF NEA chip. The potential window for ACV measurements was set at 0.05–0.65 V. The amplitude and frequency were varied in specific experiments.
Validation of Enzyme Activity with Fluorescence and HPLC Methods.
The enzyme activity was validated with fluorogenic techniques regularly to ensure no degradation. Figures S3 and S4 show the representative kinetic curves and calibration curves of cathepsin B proteolysis of a commercial fluorogenic substrate (peptide no. 1). The increasing signal represents accumulation of the proteolyzed product, i.e., AMC fluorophore, dissociated from the quencher, i.e., the carbonyl group in arginine. Peptide no. 2 was used to measure the activity of ADAM10 and ADAM17 based on a similar FRET mechanism (shown in Figures S5 and S6). Cleavage between Gly and Leu released the Mca fluorophore fragment from the Dpa quencher and gave a strong fluorescence. The proteolysis of the peptide substrates has also been tested by high-performance liquid chromatography (HPLC) to identify the cleavage sites.
RESULTS AND DISCUSSION
Design Principles and Characterization of the VACNF NEA Chip.
Parts A and B of Figure 1 show the top view and 30° perspective view by scanning electron microscopy (SEM) with an as-grown VACNF array of 5 μm in length. These VACNFs are uniformly aligned within 5° from the surface normal. The average diameter is about 100 nm. Typically, these VACNFs are randomly distributed with an average nearneighbor distance of ~350 nm. The VACNFs are effectively encapsulated in the insulating SiO2 matrix through TEOS CVD. A controlled length of the VACNF tips is exposed after mechanical polishing and RIE. Figure 1D shows a representative image of a single VACNF tip with an exposed length of about 100 nm. Only the longest VACNFs are exposed due to variation of individual VACNF length (within ±350 nm from the mean length), leaving a large average neighboring distance >1 μm between the exposed VACNF tips (indicated by the arrows in Figure 1C). The smaller “grass” features (~20–30 nm in size) in Figure 1D are polymers formed on the SiO2 surface during RIE, which do not affect the electrochemical measurements.
Figure 1.

SEM images of (A and B) an as-grown VACNF array and (C and D) an embedded VACNF NEA: panel A is the top view; panels B, C, and D are 30° perspective view. Arrows point to the exposed VACNF tips. (E) Schematic graph to illustrate the proteolysis process of Fc-labeled peptides on the exposed VACNF tips by cathepsin B.
As reported previously,34,35 the VACNFs grown by PECVD consist of conical graphitic cups stacked along the fiber axis as schematically illustrated in Figure 1E. This generates abundant ─COOH groups at graphitic edges along the VACNF side wall in the exposed tips. The Fc-labeled peptide substrate H2N─(CH2)4CO─peptide─NH─CH2─Fc can be covalently linked to the exposed CNF tip through the amide bond formed between the amine group in the linker H2N─(CH2)4CO─ and ─COOH group at the VACNF tip. The Fc label provides a reversible oxidation peak at ~0.25 V versus Ag/AgCl (3.0 M KCl) in ACV. After adding the specific target protease into the electrochemical cell, the enzyme recognizes its cognate peptide sequence and cleaves it at the specific sites. The Fc-containing fragments are released from the VACNF tip and causing the ACV signal to decrease over time. Higher protease activity induces a faster decrease in the Fc signal. For noncognate proteases, the enzyme–peptide interaction is much weaker, resulting in a lower proteolysis rate. Thus, measuring the proteolysis kinetic of specific peptide probes allows quantitative estimation of the activity of its cognate proteases.
Measurement of Real-Time Proteolysis Processes with the VACNF NEA Chip.
Figure 2 shows representative electrochemical measurements obtained with hexapeptide H2N─(CH2)4─CO─Pro-Leu-Arg-Phe-Gly-Ala─NH─CH2─Fc (peptide no. 4) functionalized onto the VACNF NEA in 25 mM MES (pH = 5.0). Figure 2A shows the initial ACV curve. A clear peak is observed at ~0.25 V [vs Ag/AgCl (3.0 M KCl)]. The peak current ip can be extracted by subtracting the linear background. Figure 2B shows five representative background-subtracted ACV curves at the reaction time t = 0, 10, 20, 30, and 50 min after cathepsin B is added into the electrochemical cell. Clearly, the peak current decreases with the reaction time. Meanwhile, the peak position slightly shifts to lower potentials, indicating the possibility that the protease cleaves the stretched “upstanding” peptides first, and then the peptides “lying” closer to the surface. Figure 2C shows a representative kinetic curve, i.e., the normalized peak current ip/ip0 versus the reaction time, illustrating an exponential decay of the extracted peak current ip relative to the initial peak current ip0 right before cathepsin B is added.
Figure 2.

(A) A representative ac voltammogram of a random VACNF NEA modified with hexapeptide (peptide no. 4) measured at an ac frequency of f = 400 Hz and amplitude V0 = 100 mV in 25 mM MES buffer (pH = 5.0). (B) Background-subtracted ACV peaks from repeated ACV measurements after 25 μL of activated cathepsin B is added in the electrochemical cell. (C) The ratio of the measured ACV peak current ip to the initial ACV peak current ip0 vs the reaction time at a cathepsin B concentration of 2.56 nM. The temperature was controlled at 38.6 °C in all experiments, and the moment that cathepsin B was added in the electrochemical cell is defined as t = 0 min.
In contrast to fluorescence proteolytic measurements that depend on peptide substrate concentration (see Figure S4), all normalized electrochemical proteolytic curves pass through the same starting point (t = 0, ip/ip0 = 1). Before adding the activated cathepsin B at t = 0, the observed signal is rather stable indicating negligible variation in the total Fc attached to the CNF tips through the peptide. At t = 0, the activated cathepsin B (with a final concentration of 2.56 nM in Figure 2C) was added into the electrochemical cell. As the enzyme cleaves the peptide, more Fc moieties are dissociated from the CNF tips. Consequently, the curve shows an exponential decay which can be fitted with the following equation (black line):
| (1) |
where the exponential term (with a time constant τ) associates with the proteolysis reaction and the linear term (bt + c) accounts for the slow background drift. Because of the steric hindrance, not all Fc-labeled peptides can be cleaved by the protease as reflected by a small nonzero value (~0.3) at the end of the proteolysis (t = ~50 min). The protruding VACNF tips in this study substantially reduce the steric hindrance compared to the common planar electrodes, but some Fc residues remain adsorbed on the surface.
As derived in our previous studies,27,28,30 the exponential kinetic proteolysis can be described by a Michaelis–Menten model for the heterogeneous enzymatic reaction:
| (2) |
where E is the enzyme, Ss is the Fc-labeled peptide substrate attached on the VACNF tips, ESs is the enzyme–substrate complex on the CNF tips, Ps is the surface-attached product, and P is the released product containing Fc. At the steady-state conditions, we can derive (see details in the Supporting Information):
| (3) |
where kcat is the catalytic dissociation rate constant and KM = (kcat + k−1)/k1 is the Michaelis–Menten constant. This reveals the relationship between the experimentally observed quantity τ and the fundamental protease properties as
| (4) |
where kcat/KM is the “specificity constant” representing the intrinsic catalytic efficiency of a protease to a specific peptide substrate. Clearly, the activity represented by 1/τ is not only proportional to the concentration of the protease [E0] but also the “specificity constant” kcat/KM. It is the overall value of (kcat/KM)[E0] that defines the decay rate (i.e., the proteolysis rate). The affinity techniques to detect [E0] (such as ELISA) only reveal [E0] but not (kcat/KM)[E0]. In this study, we focus on enhancing the (kcat/KM) value of the cognate protease over other nontarget proteases by optimizing peptide substrates so that a higher selectivity can be obtained.
Effect of Peptide Length on the Proteolytic Rate.
A shorter tetrapeptide, H2N─(CH2)4─CO─Leu-Arg-Phe-Gly─NH─CH2─Fc (peptide no. 3), was used as the substrate for cathepsin B in our previous studies.27,28,30 In principle, longer peptides may provide higher binding with the protease and thus give a higher (kcat/KM) value. However, longer peptides may give a lower electron-transfer rate due to larger distance between Fc and the VACNF tip. To assess these effects, we have designed a hexapeptide substrate (peptide no. 4) and an octapeptide substrate (peptide no. 5) by adding extra amino acids at the two ends of the tetrapeptide.
Figure 3A shows the dependence of the peak current on the applied frequency in ACV for the tetrapeptide, hexapeptide, and octapeptide, respectively. The peak current is normalized to the maximum value (ip,max) of each peptide substrate for easier comparison. Clearly, each peptide shows a maximal ip at a specific frequency which shifts to lower value as the peptide length increases, being ~600 Hz for the tetrapeptide, ~400 Hz for the hexapeptide, and ~200 Hz for the octapeptide. This is consistent with a decrease of the electron-transfer rate as the average distance between Fc and VACNF tip increases with the peptide length. Such frequency dependence is a good evidence that peptide molecules likely stand up rather than lie flatly on the surface of the VACNF tips, which is beneficial in reducing the steric hindrance of the surface. From an electrochemical detection point of view, higher ac frequency is desired in order to achieve higher detection speed and higher sensitivity.
Figure 3.

(A) Normalized peak current of the peptide–Fc-functionalized VACNF NEA in ac voltammetry at different frequencies for tetrapeptide (peptide no. 3), hexapeptide (peptide no. 4), and octapeptide (peptide no. 5) in 25 mM MES buffer (pH = 5.0), respectively. (B) Normalized peak current of peptide–Fc-functionalized VACNF NEA in ac voltammetry at different voltage amplitudes for the tetrapeptide, hexapeptide, and octapeptide, respectively. (C) Bar chart plot of 1/τ vs different peptides. All experiments were carried out at room temperature (varying between 20 and 26 °C). The error bars represent the standard deviation from three replicates (n = 3).
The ac voltage amplitude is another factor that affects the ACV measurements. In Figure 3B, tetrapeptide, hexapeptide, and octapeptide show similar trends in the normalized ip versus the ac voltage amplitude. The peak current linearly increases with the amplitude from 25 to 100 mV. When the voltage amplitude goes above 100 mV, the peak current slowly drops. Thus, the optimal amplitude is between 100 and 150 mV, which is notably higher than the small amplitude (<25 mV) used in ACV on planar electrodes. The high ac voltage would induce dielectrophoresis that can concentrate biomolecules near the electrode surface due to the large electric field gradient. This is a unique advantage of the VACNF NEA that has been demonstrated in our previous study of ac dielectrophoretic capture of bacteria29,36 and virus particles.37,38 In this study, concentrating protease molecules near the VACNF tips would further enhance the proteolysis rate and increase the detection sensitivity.
Figure S7 shows the kinetic proteolysis curves, in the form of ip/ip0 versus time, for the three peptides with 30.7 nM activated cathepsin B at room temperature. All measurements were done by continuously repeated ACV at 400 Hz and 100 mV amplitude. The fitted time constant τ is 1059, 846, and 1030 s for the tetrapeptide, hexapeptide, and octapeptide, respectively. The hexapeptide gives the fastest kinetic decay and smallest τ value. Figure 3C summarizes these results in the form of a bar chart. The average 1/τ values from the three replicates are 9.8 × 10⁻⁴, 11.6 × 10⁻⁴, and 10.7 × 10⁻⁴ s−1, respectively, which represent the activity of cathepsin B on each peptide substrate. Apparently, even though the concentration of cathepsin B is the same (30.7 nM), peptide substrates interact differently with cathepsin B and give different kcat/KM values, leading to varied activities. The central tetrapeptide sequence seems to play the major role in defining the peptide–protease interaction, and longer peptides only induce small modulations. Overall, the hexapeptide gives the highest proteolysis rate which balances the protease–peptide binding and electron-transfer rate.
Effect of Temperature on the Proteolysis Rate.
Enzyme activity is known to be sensitive to temperature. Thus, the kcat/KM value and the proteolysis rate may be significantly altered by the temperature, leading to varied proteolysis rate at the same protease concentration. To illustrate this, proteolysis is measured with ACV using VACNF NEAs at four different temperatures, i.e., 19.3, 29.5, 38.6, and 44.2 °C. The sample preparation and measurement conditions (400 Hz, 100 mV amplitude, and 30.7 nM cathepsin B) are kept the same. As shown in Figure 4A, the curve decays fastest at 38.6 °C and slows down when the temperature is off to either side, with τ = 1447 s at 19.3 °C, τ = 1038 s at 29.5 °C, τ = 274 s at 38.6 °C, and τ = 552 s at 44.2 °C. The measured activity (i.e., 1/τ) in Figure 4B slowly increases from 7.6 × 10⁻⁴ s−1 at 19.3 °C to 10.6 × 10⁻⁴ s−1 at 29.5 °C, reaches the maximum of 36.3 × 10⁻⁴ s−1 at 38.6 °C, and then drops to 15.4 × 10⁻⁴ s−1 at 44.2 °C. This reflects a dramatic effect on the activity, about 5 times at 38.6 °C compared to that near room temperature (19.3 °C). It is not surprising that the proteolysis activity is the highest near body temperature (~37 °C), the natural physiology condition.
Figure 4.

(A) Kinetic proteolysis curve by 30.7 nM cathepsin B at four different temperature settings with ac voltammetry on the VACNF NEA modified with hexapeptide–Fc (peptide no. 4) in 25 mM MES buffer (pH = 5.0). (B) Scatter plot of 1/τ (× 10−4 s−1) vs the measuring temperature. The error bars represent the standard deviation from three replicates (n = 3).
Assessment of the Limit of Detection in Measuring Cathepsin B.
A series of proteolysis measurements have been carried out at different cathepsin B concentrations using VACNF NEA chips functionalized with the Fc-labeled hexapeptide (peptide no. 4) to assess the LOD for cathepsin B activity and concentration. All measurements are at the optimized ACV conditions (400 Hz and 100 mV amplitude) and the optimal temperature (38.6 °C) based on the above studies. As shown in Figure 5A, the proteolytic curve decays faster as the enzyme concentration is increased. The fitted τ values at 0.50, 1.0, 2.56, and 10.2 nM cathepsin B are 3305, 1976, 1277, and 326 s, respectively. Figure 5B shows the bar chart of 1/τ at six protease concentrations. The 1/τ values, i.e., the activity, are 1.87 × 10⁻⁴, 3.02 × 10⁻⁴, 5.24 × 10⁻⁴, 6.56 × 10⁻⁴, 12.30 × 10⁻⁴, and 27.66 × 10⁻⁴ s−1 for the blank, 0.50, 1.0, 2.56, 6.0, and 10.2 nM cathepsin B, respectively. The error bars are the standard deviation of three replicates for each measurement. The LOD of activity (i.e., 1/τ) can be determined as 2.49 × 10⁻⁴ s−1 (represented by the dashed line in Figure 5B) by
| (5) |
where σblank = 2.06 × 10⁻⁵ s−1 is the standard deviation and (1/τblank = 1.87 × 10⁻⁴ s−1 is the mean value of blank experiments. This involves adding blank activity buffer into electrochemical cell filled with the assay buffer. Thus, it causes some disturbance to the electrochemical signal and causes the ip/ip0 value to slowly decrease. However, it is clear in Figure 5B that even adding 0.50 nM cathepsin B gives an activity (i.e., 1/τ value from fitting the proteolytic curve) above that of the blank buffer. This illustrates the necessity to measure the whole kinetic proteolytic curve rather than only measure the singlepoint signal at the end of a fixed proteolysis time, as done in many studies.
Figure 5.

(A) Kinetic proteolysis profiles measured at cathepsin B concentrations of 0.50, 1.0, 2.56, and 10.2 nM in 25 mM MES buffer (pH = 5.0), respectively, using the hexapeptide (peptide no. 4). (B) Bar plot of 1/τ vs cathepsin B concentrations. The error bars are one standard deviation obtained with three replicates. (C) The linear calibration curve of the protease activity represented by 1/τ vs the cathepsin B concentration from 0.5 to 10.2 nM.
The LOD of cathepsin B concentration can also be accurately derived from the calibration curve. Figure 5C shows the best linear fit to the data of 1/τ versus the enzyme concentration [E0]. A total of six enzyme concentrations (including the blank) are included. Instrument fitting was used to get the best fitting line. The LOD of the cathepsin B concentration [E0] can be calculated as 0.32 nM by
| (6) |
where m = 1.9 × 10⁵ M−1 s−1 is the slope of the fitting line.
Since 1/τ = (kcat/KM)[E0], the slope of the fitting line in Figure 5C represents the specificity constant (kcat/KM) of cathepsin B, which is 1.9 × 10⁵ M−1 s−1 in this study, about 4.6 times of the value (4.11 ± 0.67) × 104 M−1 s−1 in our previous reports.27,28 As described above, the larger specificity constant gives a higher catalytic efficiency. Raising the temperature from room temperature (~20 °C) to 38.6 °C effectively enhances the specificity constant, leading to a higher sensitivity and a lower LOD.
Selectivity of the Hexapeptide Substrate.
As can be seen from the above results, the hexapeptide (peptide no. 4) serves as a highly sensitive probe for detecting cathepsin B. The next question is whether it can be cleaved by other proteases due to cross-reactions. To assess this, we have tested it with two other cancer-related proteases, i.e., ADAM10 and ADAM17. Figures S5 and S6 are measurements with the fluorescent substrates to validate their activity. The activity of ADAM17 on its cognate peptide substrate, peptide no. 2, is comparable to that of cathepsin B on peptide no. 1, but that of ADAM10 is much lower.
Figure 6A shows that the kinetic curves of 6.0 nM ADAM10 and 6.0 nM ADAM17 are almost overlapped with that of the blank buffer. In contrast, the curve of 6.0 nM cathepsin B shows a fast decay, giving 1/τ = 12 × 10−4 s−1, well above all other controls in Figure 6B. It is clear that peptide no. 4 has a very high selectivity for cathepsin B. Furthermore, as shown in Figure 6C, D, the VACNF NEAs functionalized with the cognate octapeptide (peptide no. 6) of ADAM17 present negligible cross-reactions with cathepsin B and ADAM10. Both 6.0 nM cathepsin B and 6.0 nM ADAM10 show very small 1/τ values comparable to the blank buffer, while a large value 1/τ = ~9 × 10⁻⁴ s−1 is obtained in 6.0 nM ADAM17.
Figure 6.

(A) Specificity test in 6.0 nM of cathepsin B, ADAM10, and ADAM17, respectively, vs the blank on hexapeptide (peptide no. 4) functionalized VACNF NEA (the measurements were carried out in the specific assay buffers of corresponding proteases) and (B) bar plot of the corresponding 1/τ values. (C) Specificity test in 6.0 nM of cathepsin B, ADAM10, and ADAM17, respectively, vs the blank on octapeptide (peptide no. 6) functionalized VACNF NEA (the measurements were carried out in the specific assay buffers of corresponding proteases) and (D) bar plot of the corresponding 1/τ values. The error bars in panels B and D represent the standard deviation from three replicates (n = 3).
Figure S8A further shows the electrochemical proteolysis curves of peptide no. 4 functionalized VACNF NEA in blank, 0.50 nM ADAM10, and 0.50 nM cathepsin B, respectively. The decay rate in 0.5 nM cathepsin B is clearly faster than the other two. The average value of 1/τ in 0.50 nM cathepsin B is 3.02 × 10⁻⁴ s−1, larger than those in blank (1.87 × 10⁻⁴ s−1) and 0.50 nM ADAM10 (2.16 × 10⁻⁴ s−1) in Figure S8B. In addition, the 1/τ value of 0.50 nM ADAM10 is comparable with the blank, indicating negligible cross-reaction of ADAM10 with peptide no. 4 that was specifically designed for cathepsin B.
Cleavage Site(s) of the Hexapeptide by Cathepsin B.
Previously, tetrapeptide (peptide no. 3) H2N─(CH2)4─CO─Leu-Arg-Phe-Gly─NH─CH2─Fc was cleaved by cathepsin B at the Arg-Phe site in the MES assay buffer (pH = 5.0).27 To our surprise, the hexapeptide (peptide no. 4) H2N─(CH2)4CO─Pro-Leu-Arg-Phe-Gly-Ala─NH─CH2─Fc extended from the tetrapeptide was cleaved by cathepsin B at two different sites between Gly-Ala and Phe-Gly in MES buffer (see the HPLC results in Figure S9). We have synthesized Ala─NH─CH2─Fc and Gly-Ala─NH─CH2─Fc molecules independently and found that their HPLC retention times matched those of proteolyzed hexapeptide (peptide no. 4) by cathepsin B (see Figure S9). It is clear that the cleavage sites are different from that in tetrapeptide (peptide no. 3). Two possible changes in the hexapeptide may contribute to the observed cleavage sites: (1) addition of Pro at the C-terminus and Ala at the N-terminus of peptide no. 3 to synthesize peptide no. 4 may change the binding conformation of hexapeptide with cathepsin B, leading to different cleavage sites, at the less sterically bulky amino acid residues Gly and Ala; (2) the Pro residue may provide a β-turn of the substrate peptide, resulting in different cleavage sites from that of peptide no. 3 (absence of Pro). Using Mobyle predictive computational calculation (RPBS Web portal),39 the minimum energy conformation of peptide no. 4 adapted a turn structure (see Figure S10). In addition, cathepsin B is known to cleave peptides at Gly and Arg sites.
Proteolysis Rate Dependence on the pH Value and Ionic Strength of Electrolytes.
The effect of the pH value of the electrolyte (i.e., assay buffer) on the proteolysis rate and cleavage site was investigated using PBS buffers (pH = 7.3) in comparison with the above-discussed MES buffer (pH = 5.0). Three concentrations (0.2×, 0.5×, and 1× PBS) were studied to examine the effect of the ionic strength. Proteolyses of hexapeptide (peptide no. 4) functionalized VACNF NEAs were measured with 6.0 nM cathepsin B at 38.6 °C in these buffers. As shown in Figure S11A–C, 0.2× PBS buffer yields the fastest decay (τ = 1654 s) compared to 0.5× PBS buffer (τ = 1863 s) and 1× PBS buffer (τ = 9506 s). The measured activity (i.e., 1/τ) in Figure S11D decreases from 12.6 × 10⁻⁴ s−1 in 25 mM MES buffer (pH = 5.0) to 6.0 × 10⁻⁴ s−1 in 0.2× PBS buffer, 5.4 × 10⁻⁴ s−1 in 0.5× PBS buffer, and 1.0 × 10⁻⁴ s−1 in 1× PBS buffer. This reflects that both the ionic strength and pH value affect the proteolysis rate. The higher pH value and higher ionic strengths in PBS may cause conformational changes in the protease and the peptides. Fortuitously, a relatively high protease activity, about a half of that in 25 mM MES buffer (pH = 5.0), can be achieved in the 0.2× PBS buffer (pH = 7.3). Thus, the diluted neutral PBS buffer can serve as a common electrolyte in simultaneously detecting multiple proteases with different optimal pH values. The HPLC results in Figure S12 further confirmed the effects of the buffer concentration on the proteolysis rate and cleavage site.
CONCLUSION
This study has demonstrated the development of an activity-based electrochemical method to detect cathepsin B, a protease as an important prognostic factor for cancer. The protruding VACNF NEAs functionalized with specific peptide substrates labeled with Fc tag show reduced steric hindrance to protease and give a reliable ac voltammetry signal. The catalytic activity can be accurately derived as the inverse of the exponential decay time constant by measuring the kinetic proteolysis curve with continuously repeated ac voltammetry. Different peptide lengths have been studied, revealing that the hexapeptide H2N─(CH2)4─CO─Pro-Leu-Arg-Phe-Gly-Ala─NH─CH2─Fc is the optimal substrate for measuring cathepsin B activity. The optimal ac frequency for ac voltammetry shifts to lower value as the peptide length is increased, consistent with the larger separation between the VACNF tip and the Fc tag due to the upstanding peptides. The temperature has a significant effect on the cathepsin B activity. The maximal cathepsin B activity is obtained at 38.6 °C, around the normal body temperature. Using this hexapeptide under the optimized conditions, the LOD of cathepsin B activity and concentration have been determined to be 2.49 × 10⁻⁴ s−1 and 0.32 nM. This peptide substrate appears to be highly specific to cathepsin B and shows negligible cross-reactions with two other cancer-related proteases, i.e., ADAM10 and ADAM17. The results demonstrate the promising potential for a multiplex electronic chip for rapid profiling of the activity of multiple proteases in cancer diagnosis and treatment monitoring.
Supplementary Material
ACKNOWLEDGMENTS
Research reported in this publication was supported by the National Cancer Institute of the National Institutes of Health under Award Number R01CA217657. The content is solely the responsibility of the authors and does not necessarily represent the official views of the National Institutes of Health. SEM imaging acquisition was made possible by NASA Ames Research Center in collaboration with USRA Science and Technology Innovation Laboratories. We thank Kaimin Jia and Professor Ping Li for providing high-resolution mass spectra of the synthesized peptides.
Footnotes
Supporting Information
The Supporting Information is available free of charge on the ACS Publications website at DOI: 10.1021/acs.analchem.8b05189.
Materials and instruments, fabrication, passivation and functionalization of the VACNF NEA, storage and activation of the proteases, derivation of kinetic model, fluorescence validation, selectivity tests, determination of cleavage sites with HPLC, effects of the pH value and ionic strength of the assay buffers, and peptide synthesis/characterization (PDF)
The authors declare no competing financial interest.
REFERENCES
- (1).Koblinski JE; Ahram M; Sloane BF Clin. Chim. Acta 2000, 291, 113–135. [DOI] [PubMed] [Google Scholar]
- (2).Bogyo M Proc. Natl. Acad. Sci. U. S. A. 2010, 107, 2379–2380. [DOI] [PMC free article] [PubMed] [Google Scholar]
- (3).Turk B Nat. Rev. Drug Discovery 2006, 5, 785–799. [DOI] [PubMed] [Google Scholar]
- (4).Mason SD; Joyce JA Trends Cell Biol. 2011, 21, 228–237. [DOI] [PMC free article] [PubMed] [Google Scholar]
- (5).Wan XS; Meyskens FL; Armstrong WB; Taylor TH; Kennedy AR Cancer Epidemiol., Biomarkers Prev. 1999, 8, 601–608. [PubMed] [Google Scholar]
- (6).Ullah MF; Aatif M Cancer Treat. Rev. 2009, 35, 193–200. [DOI] [PubMed] [Google Scholar]
- (7).López-Otín C; Matrisian LM Nat. Rev. Cancer 2007, 7, 800–808. [DOI] [PubMed] [Google Scholar]
- (8).Sanman LE; Bogyo M Annu. Rev. Biochem. 2014, 83, 249–273. [DOI] [PubMed] [Google Scholar]
- (9).De Duve C Eur. J. Biochem. 1983, 137, 391–397. [DOI] [PubMed] [Google Scholar]
- (10).Koike M; Shibata M; Ohsawa Y; Nakanishi H; Koga T; Kametaka S; Waguri S; Momoi T; Kominami E; Peters C; von Figura K; Saftig P; Uchiyama Y Mol. Cell. Neurosci. 2003, 22, 146–161. [DOI] [PubMed] [Google Scholar]
- (11).Nakagawa T; Roth W; Wong P; Nelson A; Farr A; Deussing J; Villadangos JA; Ploegh H; Peters C; Rudensky AY Science 1998, 280, 450–453. [DOI] [PubMed] [Google Scholar]
- (12).Nakanishi H; Zhang J; Koike M; Nishioku T; Okamoto Y; Kominami E; Von Figura K; Peters C; Yamamoto K; Saftig P; Uchiyama Y J. Neurosci 2001, 21, 7526–7533. [DOI] [PMC free article] [PubMed] [Google Scholar]
- (13).Chambers AF; Matrisian LM J. Natl. Cancer Inst. 1997, 89, 1260–1270. [DOI] [PubMed] [Google Scholar]
- (14).Hopsu-Havu VK; Järvinen M; Kirschke H Proteolysis in Cell Functions; IOS Press: Amsterdam, Netherlands, 1997; Vol. 13. [Google Scholar]
- (15).Jacquemier J; Ginestier C; Rougemont J; Bardou VJ; Charafe-Jauffret E; Geneix J; Adelaide J; Koki A; Houvenaeghel G; Hassoun J; Maraninchi D; Viens P; Birnbaum D; Bertucci F Cancer Res. 2005, 65, 767–779. [PubMed] [Google Scholar]
- (16).Harbeck N; Kates RE; Gauger K; Willems A; Kiechle M; Magdolen V; Schmitt M Thromb. Haemostasis 2004, 91, 450–456. [DOI] [PubMed] [Google Scholar]
- (17).de Cremoux P; Grandin L; Dieras V; Savignoni A; Degeorges A; Salmon R; Bollet MA; Reyal F; Sigal-Zafrani B; Vincent-Salomon A; Sastre-Garau X; Magdelenat H; Mignot L; Fourquet A Anticancer Res. 2009, 29, 1475–1482. [PubMed] [Google Scholar]
- (18).Leelawat K; Sakchinabut S; Narong S; Wannaprasert J BMC Gastroenterol. 2009, 9, 30. [DOI] [PMC free article] [PubMed] [Google Scholar]
- (19).Ong ILH; Yang K-L Analyst 2017, 142, 1867–1881. [DOI] [PubMed] [Google Scholar]
- (20).Puiu M; Bala C Bioelectrochemistry 2018, 120, 66–75. [DOI] [PubMed] [Google Scholar]
- (21).Kanchi S; Sabela MI; Mdluli PS; Inamuddin; Bisetty K Biosens. Bioelectron. 2018, 102, 136–149. [DOI] [PubMed] [Google Scholar]
- (22).Liu G; Wang J; Wunschel DS; Lin Y J. Am. Chem. Soc 2006, 128, 12382–12383. [DOI] [PubMed] [Google Scholar]
- (23).Ohtsuka K; Maekawa I; Waki M; Takenaka S Anal. Biochem. 2009, 385, 293–299. [DOI] [PubMed] [Google Scholar]
- (24).Adjemian J; Anne A; Cauet G; Demaille C Langmuir 2010, 26, 10347–10356. [DOI] [PubMed] [Google Scholar]
- (25).Biyani M; Kawai K; Kitamura K; Chikae M; Biyani M; Ushijima H; Tamiya E; Yoneda T; Takamura Y Biosens. Bioelectron. 2016, 84, 120–125. [DOI] [PubMed] [Google Scholar]
- (26).Zhang J-J; Zheng T-T; Cheng F-F; Zhu J-J Chem. Commun. 2011, 47, 1178–1180. [DOI] [PubMed] [Google Scholar]
- (27).Swisher LZ; Syed LU; Prior AM; Madiyar FR; Carlson KR; Nguyen TA; Hua DH; Li J J. Phys. Chem. C 2013, 117, 4268–4277. [DOI] [PMC free article] [PubMed] [Google Scholar]
- (28).Swisher LZ; Prior AM; Shishido S; Nguyen TA; Hua DH; Li J Biosens. Bioelectron. 2014, 56, 129–136. [DOI] [PMC free article] [PubMed] [Google Scholar]
- (29).Madiyar FR; Bhana S; Swisher LZ; Culbertson CT; Huang X; Li J Nanoscale 2015, 7, 3726–3736. [DOI] [PubMed] [Google Scholar]
- (30).Swisher LZ; Prior AM; Gunaratna MJ; Shishido S; Madiyar F; Nguyen TA; Hua DH; Li J Nanomedicine 2015, 11, 1695–1704. [DOI] [PMC free article] [PubMed] [Google Scholar]
- (31).Li J; Ng HT; Cassell A; Fan W; Chen H; Ye Q; Koehne J; Han J; Meyyappan M Nano Lett. 2003, 3, 597–602. [Google Scholar]
- (32).Li J; Koehne JE; Cassell AM; Chen H; Ng HT; Ye Q; Fan W; Han J; Meyyappan M Electroanalysis 2005, 17, 15–27. [Google Scholar]
- (33).Arumugam PU; Chen H; Siddiqui S; Weinrich JAP; Jejelowo A; Li J; Meyyappan M Biosens. Bioelectron. 2009, 24, 2818–2824. [DOI] [PubMed] [Google Scholar]
- (34).Melechko AV; Merkulov VI; McKnight TE; Guillorn MA; Klein KL; Lowndes DH; Simpson ML J. Appl Phys. 2005, 97, 041301. [DOI] [PubMed] [Google Scholar]
- (35).Li J; Pandey GP Annu. Rev. Phys. Chem. 2015, 66, 331–356. [DOI] [PubMed] [Google Scholar]
- (36).Arumugam PU; Chen H; Cassell AM; Li J J. Phys. Chem. A 2007, 111, 12772–12777. [DOI] [PubMed] [Google Scholar]
- (37).Madiyar FR; Haller SL; Farooq O; Rothenburg S; Culbertson C; Li J Electrophoresis 2017, 38, 1515–1525. [DOI] [PubMed] [Google Scholar]
- (38).Madiyar FR; Syed LU; Culbertson CT; Li J Electrophoresis 2013, 34, 1123–1130. [DOI] [PMC free article] [PubMed] [Google Scholar]
- (39).Monacell JT; Carbone I Bioinformatics 2014, 30, 1488–1490. [DOI] [PMC free article] [PubMed] [Google Scholar]
Associated Data
This section collects any data citations, data availability statements, or supplementary materials included in this article.