Abstract
Human factors' aim is to understand and evaluate the interactions between people and tasks, technologies, and environment. Among human factors, it is possible then to include the subjective reaction to external stimuli, due to individual's characteristics and states of mind. These processes are also involved in the perception of antismoking public service announcements (PSAs), the main tool for governments to contrast the first cause of preventable deaths in the world: tobacco addiction. In the light of that, in the present article, it has been investigated through the comparison of different electroencephalographic (EEG) indices a typical item known to be able of influencing PSA perception, that is gender. In order to investigate the neurophysiological underpinnings of such different perception, we tested two PSAs: one with a female character and one with a male character. Furthermore, the experimental sample was divided into men and women, as well as smokers and nonsmokers. The employed EEG indices were the mental engagement (ME: the ratio between beta activity and the sum of alpha and theta activity); the approach/withdrawal (AW: the frontal alpha asymmetry in the alpha band); and the frontal theta activity and the spectral asymmetry index (SASI: the ratio between beta minus theta and beta plus theta). Results suggested that the ME and the AW presented an opposite trend, with smokers showing higher ME and lower AW than nonsmokers. The ME and the frontal theta also evidenced a statistically significant interaction between the kind of the PSA and the gender of the observers; specifically, women showed higher ME and frontal theta activity for the male character PSA. This study then supports the usefulness of the ME and frontal theta for purposes of PSAs targeting on the basis of gender issues and of the ME and the AW and for purposes of PSAs targeting on the basis of smoking habits.
1. Introduction
Smoking is the first cause of preventable deaths in the world [1]. It has been proved that tobacco companies specifically target women and children through their advertising, marketing, and promotion activities [2]. The main tool that governments can use to contrast such global emergency is constituted by antismoking public service announcements (PSAs). In relation to this, the possible gender differences in the response to antismoking measures, such as antismoking PSAs, are extremely worthy to be investigated. It has been previously highlighted how men and women respond differently to advertising [3, 4] and in particular to antismoking advertising [5–7]. In addition, it was seen a different modulation operated by the transportability within each sex [8] in response to advertising. Focusing on the gender effect in the reaction to smoking cue in antismoking advertisements, fMRI studies identified higher activation in women in several brain regions in comparison to male smokers, male exsmokers, and nonsmokers [6]. Furthermore, other fMRI research studies found a greater bilateral hippocampal/amygdala activation in males exposed to smoking cue in comparison to nonsmoking cues [7].
The mental engagement (ME) index was developed by Pope and colleagues [9] for its application in cognitive tasks, such as a closed-loop system to modulate task allocation. It was based on several evidences that the increases in beta activity would reflect a higher degree of alertness and greater engagement in the task, while increases in alpha and/or theta activity were supposed to reflect less alertness and decreased task engagement/information processing [10–16]. Concerning the ME application, for instance, it has been measured an improvement in performances during a vigilance task when this index was used as a criterion for switching between manual and automated piloting mode [17]. Subsequently, it has been applied to the assessment of the emotional influence on learning in an educational setting, resulting as predictive of the performance [18]. Also due to the emotional content often present in antismoking PSAs, we decided to apply such index to this study.
The approach/withdrawal (AW) index and the frontal theta index have been already applied to the study of antismoking PSAs, in relation to the investigation of neurophysiological correlates of effectiveness in such kind of advertising [19–22]. The AW was based on the theory of the frontal alpha asymmetry introduced by Davidson [23] and further adopted in several studies [24–27]. According to this theory, the prefrontal cortex (PFC) plays a crucial role in the circuitry that mediates both positive and negative motivation. In particular, various studies evidenced a relative increase in the left PFC activation in correspondence of the positive motivation, while an augmented right-sided anterior activation was observed during the negative motivation [28–32]. The application to advertising material of the frontal alpha asymmetry index, defined as the difference between the prefrontal right and left EEG power spectra alpha activity, has been already repeatedly reported [4, 33–36]. The frontal theta index was included among the assessed indices groups since its relation to the processing of the antismoking message of the PSA. In fact, higher values of frontal theta have been connected to higher levels of task difficulty [10, 37]. Moreover, it has been evidenced how the frontal theta activity represents a marker of cognitive processing during a visual task execution [11, 38]. The frontal theta as index of effort and processing has been already applied to a number of studies in different fields of research, such as neuroaesthetics [12, 39, 40]; advertising [40]; avionic [41–46] and car driving [16, 42, 47–49]; different challenging listening conditions both in normal hearing and in hearing impaired participants [50–52]; and human-computer interaction [53, 54] studies.
The spectral asymmetry index (SASI) was introduced by Hinrikus and colleagues with the aim of comparing the sensitivity of different electroencephalographic (EEG) indicators for the detection of depression [54]. Afterwards, it was applied to the reaction to emotional stimuli, providing evidence of the capability of discrimination of negative (SASI increase), positive (SASI decrease), and neutral stimuli [55]. SASI is based on the balance of EEG theta and beta frequency band powers, since evidences found a relation between EEG theta power and emotional activation. For example, Hu and colleagues [56] found evidence of a correlation between global theta power changes and “playfulness” emotions (amusement, interest, and joy) characterizing video stimuli. This evidence was also in accord with a previous study on videos by Aftanas and collaborators [57] who highlighted the major increase in theta power in response to video clips related to joy. On the other hand, beta power has been associated with high anxiety levels, especially in the right hemisphere [58], while decrease in beta activity with relaxation [59]. Therefore, SASI was expected to increase in the case of negatively perceived stimuli and to decrease in the case of positively perceived stimuli while compared to neutral pictures.
It is not clear how the gender and the previous smoking habit issues could interact with the observation of antismoking PSAs. Aim of this study was to compare the sensitivity of different EEG-based indices in detecting first gender issues and secondly smoking habit issues, in the reaction to antismoking PSAs. The final aim is to understand if such eventual cerebral patterns could be different in relation to some features of the employed PSAs in terms of characters and plot and in relation to some features of the experimental sample, that is, gender and tobacco use. If so, it could be explored in the future the possibility to evaluate the PSAs before their broadcast to understand if they could be successful (e.g., effective) or unsuccessful (e.g., ineffective) in generating appropriate healthy responses taking into account the particular gender and the smoking habit issues.
2. Materials and Methods
2.1. Participants
The experimental sample was composed of 46 participants (23 F and 23 M), divided in smokers (participants usually smoking at least 5 cigarettes per day) and nonsmokers. Smokers were 12 F and 11 M, while nonsmokers were 11 F and 12 M (Table 1). Participants were healthy volunteers aged between 25 and 55 years (mean age and standard deviation: F nonsmokers: 36.00 ± 12.05; F smokers: 36.25 ± 9.92; M nonsmokers: 33.50 ± 8.67; M smokers: 38.63 ± 10.58) and received a small compensation for their participation. All participants were given of detailed information about the study and signed informed consent. The experiment was performed in accord to the principles outlined in the Declaration of Helsinki of 1975, as revised in 2000, and it was approved by the Sapienza University of Rome Ethical Committee in charge for the Department of Molecular Medicine.
Table 1.
The table reports the number of cigarettes per week smoked by participants.
| Female participants | Cigarettes/week | Male participants | Cigarettes/week |
|---|---|---|---|
| F1 | 0 | M1 | 0 |
| F2 | 0 | M2 | 0 |
| F3 | 0 | M3 | 0 |
| F4 | 0 | M4 | 0 |
| F5 | 0 | M5 | 0 |
| F6 | 0 | M6 | 0 |
| F7 | 0 | M7 | 0 |
| F8 | 0 | M8 | 0 |
| F9 | 0 | M9 | 0 |
| F10 | 0 | M10 | 0 |
| F11 | 0 | M11 | 0 |
| F12 | 42 | M12 | 0 |
| F13 | 42 | M13 | 40 |
| F14 | 50 | M14 | 40 |
| F15 | 50 | M15 | 50 |
| F16 | 50 | M16 | 55 |
| F17 | 56 | M17 | 60 |
| F18 | 85 | M18 | 65 |
| F19 | 100 | M19 | 75 |
| F20 | 100 | M20 | 85 |
| F21 | 100 | M21 | 100 |
| F22 | 140 | M22 | 100 |
| F23 | 140 | M23 | 105 |
Note. Those who smoked zero cigarettes per week were included in the nonsmoker group.
2.2. Protocol
During the execution of the test, participants were sitting on a comfortable chair in front of a computer screen, and they were not instructed with any particular task, just to be relaxed and to restrict head and body movements as much as possible. Participants were asked to watch a video composed by a train of ten randomly delivered antismoking PSAs, with a total length of 9 minutes, preceded and followed by a documentary (neutral in respect to gender; in fact it was about constellations) lasting 1 minute, and already used as baseline [19]. The target stimuli were two of the ten PSAs, and participants were exposed once to each stimulus (both target and distracting stimuli) (Figure 1):
One male character antismoking PSA: CDC Roosevelt (USA, 2012–2015). The video displays a young man telling how he got a heart attack when he was just 45 years old and all the consequences of that event, beginning from the scar on his chest to the limitations in his everyday life, for instance, in climbing the stairs or playing with his son (retrievable at https://www.youtube.com/watch?v=OdmI35elnCQ).
One female character antismoking PSA: Baby Love (Finland, 2013). The video displays a young pregnant woman at first apparently preparing the room for the baby she is waiting, but as long as the video develops, it turns out that she actually does horrible actions, like hanging knives instead of toys in the carillon over the cradle, or putting a snake into it. The video ends with the young woman lighting a cigarette and smoking with an ashtray placed on her pregnant belly (retrievable at https://www.youtube.com/watch?v=SPBQII5c9fw).
Figure 1.
Structure of the protocol employed in the study. Each of the target stimuli could randomly appear in one of the ten possible PSA positions. Distractor stimuli were randomly placed in the remaining positions. At the beginning and at the end of the PSA train, there was the 1-minute baseline video.
2.3. EEG Recordings and Signal Processing
For the recording of the EEG activity, it has been employed a portable 24-channel system (BEmicro, EBneuro, Italy) and an EEG frontal band with ten electrodes (Fpz, Fp1, Fp2, AFz, AF3, AF4, AF5, AF6, AF7, and AF8). Impedances were kept below 10 kΩ, and signals were acquired at a sampling rate of 256 Hz. EEG traces were digitally bandpass filtered by a 5th order Butterworth filter ([2 ÷ 30] Hz), so as to reject the continuous component and high-frequency interferences.
At this point, the independent component analysis (ICA) was employed on cleaned EEG data, so as to identify and remove blinks activity contribution. For this purpose, the signal has been decomposed in 10 ICA components (the same number of EEG channels), but only the component related to blinks activity has been selected [60].
Moreover, specific procedures of the EEGLAB toolbox have been adopted [61], in order to remove further sources of artifacts (e.g., muscular activity and bioamplifier saturation). First of all, EEG signal has been segmented in epochs of 1 second, shifted of 0.5 seconds. Three epoch rejection criteria have been applied as follows:
Threshold criterion: when amplitudes in the EEG signal were equal to or greater than 100 μV, the corresponding epoch was labeled as artifact
Trend criterion: in the aim to check the slope of the trend within the considered epochs, EEG epochs were interpolated, and if the slope of an epoch was higher than 10 μV/s, it was labeled as artifact
Sample-to-sample difference criterion: cases in which the amplitude difference between consecutive EEG samples was higher than 25 μV, representing an abrupt nonphysiological variation, the corresponding EEG epoch was labeled as artifact
Specifically, all the adopted numeric values just mentioned were chosen accordingly to the guidelines reported in Delorme and Makeig [61].
After the application of the just mentioned epoch rejection criteria, in order to have an artifact-free EEG signal from which estimating the brain variations along the different conditions, all the EEG epochs labeled as artifact were rejected from the EEG dataset.
For each participant, the individual alpha frequency (IAF) was calculated over a 60-second long open eyes segment, recorded before the beginning of the experimental task. IAF was computed in order to define the EEG bands of interest according to the method suggested in the current scientific literature, i.e., each band is defined as “IAF ± x,” where IAF is the individual alpha frequency, in Hertz, and x an integer in the frequency domain [37]. Consequently, the EEG activity was divided in three main frequency bands: theta [IAF − 6 ÷ IAF − 2 Hz], alpha [IAF − 2 ÷ IAF + 2 Hz], and beta [IAF + 2 ÷ IAF + 14 Hz]. To summarize the activity of the cortical areas of interest in a specific frequency band, the global field power (GFP) [62] was then computed. The GFP summarizes the synchronization level of the brain activity over the scalp surface, and its measure corresponds to the spatial standard deviation. GFP estimates the quantity of activity at each time point in the field, simultaneously considering data from all recording electrodes, resulting in a reference-independent descriptor of the potential field [63]. The main concept of GFP is that scalp fields presenting high activity reflect the synchronous activation of a large number of intracranial neuronal elements, while fields with few field lines would contain little information. The GFP was already employed in studies of perceptual, attentional, and cognitive processing [64–66] as well as in clinical studies [67–69]. The GFP represents an index for the temporal determination of information from cognitive studies; moreover, it constitutes a parameter for the time-domain analysis of EEG (as in the present work), as it allows the identification of the maps of maximal electric field strength (hilliness).
Specifically, in this study, the GFP was calculated from a specific set of electrodes (the set depends on the investigated brain area, and for each index it will be specified later in the study) by performing the sum of squared values of EEG potential at each electrode, averaged for the number of involved electrodes, resulting in a time-varying waveform related to the increase or decrease of the global power in the analysed EEG. The GFP formula is specified in the following equation:
| (1) |
where ϑ is the considered EEG band, Frontal is the considered cortical area, N is the number of electrodes included in the area of interest (in this example the Frontal area), i is the electrodes' index, and x represents the specific EEG sample at time (t), filtered within the related EEG band (i.e., ϑ) and for the specific channel i.
It was calculated then the average GFP value on all the GFP values estimated over 1 second of EEG signal. According to the following paragraphs, EEG indices were calculated and normalized for each second by using the mean and the standard deviation of the same neurometrics calculated on the baseline:
| (2) |
2.4. Mental Engagement
The mental engagement (ME) index has been defined as the ratio between the activity in the beta band and the sum of alpha and theta activity (equation (3)), as defined by Pope and colleagues [9]:
| (3) |
2.5. Approach Withdrawal
The approach/withdrawal (AW) index has been defined according to Davidson and colleagues [23] as the frontal alpha asymmetry as reported in the following formula:
| (4) |
where the GFPα_right and GFPα_left stand for the GFP calculated among right (Fp2, AF4, and AF8) and left (Fp1, AF3, and AF7) electrodes, respectively, in the alpha (α) band. Higher AW values, reported by the subjects, stood for an approach motivation toward the stimulus, while lower AW values for a withdrawal motivation [70, 71].
2.6. Frontal Theta
The EEG activity in the theta band over all the frontal electrodes has been considered for the estimation of the mental effort/processing processes. An increase in the frontal theta (i.e., mental effort/processing) would imply an increase in the task difficulty [38, 49] and therefore in the attendance to the antismoking content of the PSA, as also already evidenced by studies in which the frontal theta activity has been investigated during the exposure to antismoking advertising [19–22].
2.7. Spectral Asymmetry Index
The spectral asymmetry index (SASI) has been defined by previous studies where it was calculated for each EEG electrode [54] and for groups of electrodes corresponding to cerebral regions [55], and here calculated, over all the frontal electrodes, according to the following equation:
| (5) |
2.8. Statistical Analysis
ANOVA test has been performed on all the considered indices. The first between-variable was the “Smoking Habit,” with 2 levels: smokers and nonsmokers; the second between-variable was the participants “Gender,” with two levels: men and women; the within variable was the “PSA kind,” with two levels: male character PSA and female character PSA. Duncan's post hoc comparisons have been performed on the statistically significant interactions. Logistic regression analysis was also performed on the indices, considering as dichotomic variables the participants' gender. Simple regression analysis has been performed in order to investigate the correlation between the number of smoked cigarettes by participants and the neurophysiological response indexed by the selected indices.
3. Results and Discussion
3.1. Mental Engagement Results
Concerning the mental engagement (ME), results showed a statistically significant increase for ME values in smokers in comparison to nonsmokers (F(1, 42) = 4.207, p=0.046) (Figure 2). Furthermore, ANOVA test reported a statistically significant interaction between the factor PSA and the factor Gender (F(1, 42) = 5.225, p=0.027). Post hoc analysis did not show any statistically significant difference in the pairwise comparisons (Figure 3).
Figure 2.
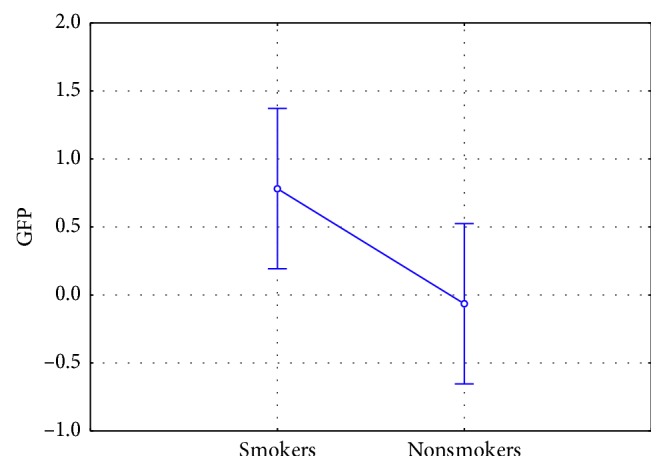
Mental engagement index: comparison among smokers and nonsmokers (n=46). Smokers showed a statistically significant increase in ME values in comparison to nonsmokers (F(1, 42) = 4.207, p=0.046). Vertical bars denote 0.95 confidence intervals.
Figure 3.
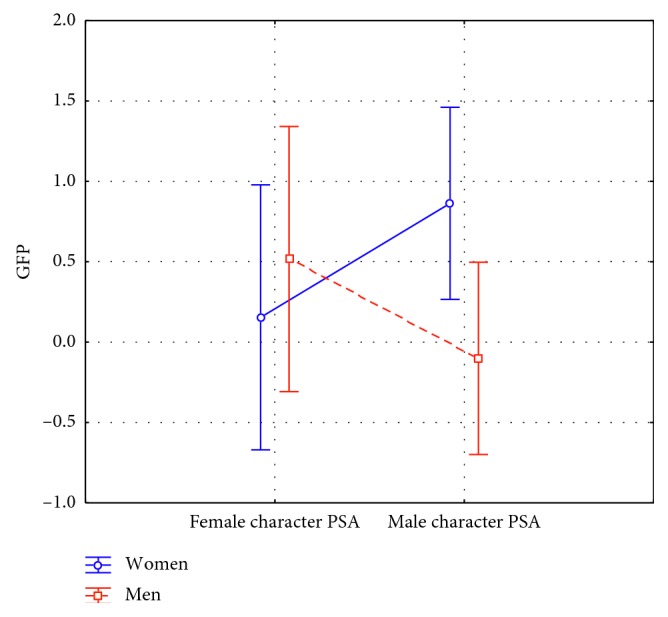
Mental engagement index: interaction between PSA kind and Gender (n=46). The statistical analysis reported a statistically significant interaction between the factor PSA and the factor Gender (F(1, 42) = 5.225, p=0.027). Post hoc analysis did not show any statistically significant difference in the pairwise comparisons. Vertical bars denote 0.95 confidence intervals.
In addition, ME results evidenced a statistical significance in the logistic regression between the values obtained in response to the male character PSA and the Gender of participants (p=0.015) (Figure 4).
Figure 4.
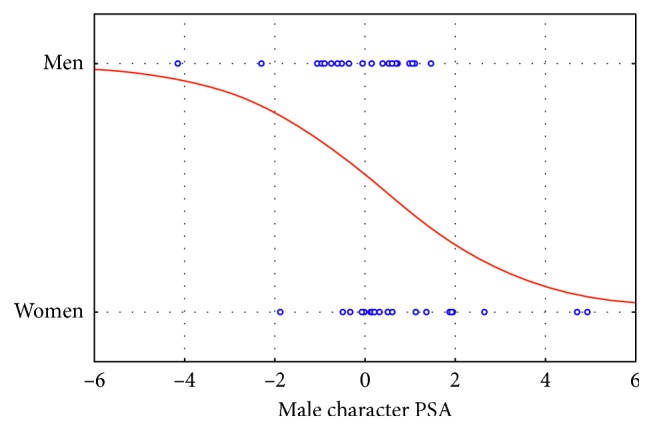
Mental engagement index: plot of the logistic regression between the male character PSA and Gender (n=46). The statistical analysis reported a statistical significance for such correlation (p=0.015) suggesting that men reported lower ME values in comparison to women in correspondence of the exposure to the male character PSA.
Finally, ME results provided evidence of a correlation between the number of cigarettes per week smoked by participants and the ME values obtained in correspondence of the exposure to the male character PSA (p=0.044) (Figure 5).
Figure 5.
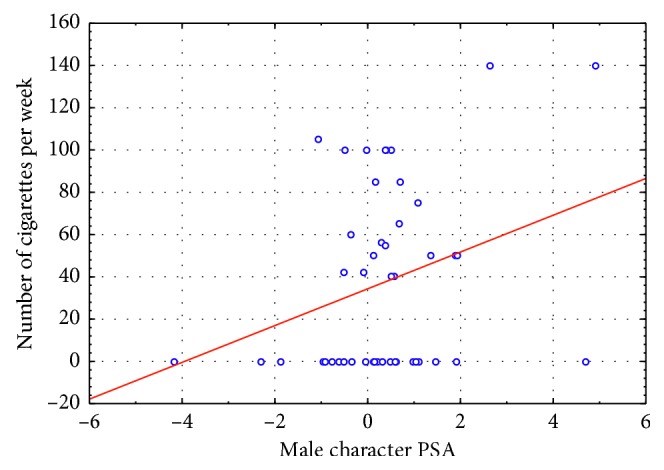
Mental engagement index: plot of the linear regression between the male character PSA and the number of cigarettes per week smoked by participants (n=46). The statistical analysis reported a statistical significance for such correlation (p=0.044) suggesting that heavy smokers reported higher ME values in correspondence of the exposure to the male character PSA.
3.2. Approach/Withdrawal Results
Results evidenced increased AW values for the nonsmokers in comparison to smokers (F(1, 42) = 4.413, p=0.042) (Figure 6). It is also interesting to note that nonsmokers presented positive AW values and therefore an approach tendency toward the antismoking PSAs, while smokers showed negative AW values and therefore a withdrawal tendency.
Figure 6.
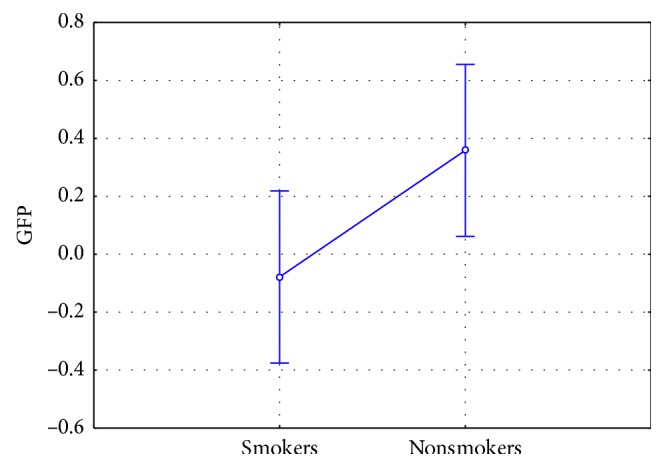
Approach/withdrawal index: comparison among smokers and nonsmokers (n=46). Nonsmokers showed a statistically significant increase in AW values in comparison to smokers (F(1, 42) = 4.413, p=0.042). Vertical bars denote 0.95 confidence intervals.
3.3. Frontal Theta Results
Concerning frontal theta activity, it has been found a statistically significant effect for the kind of the PSA (F(1, 42) = 19.981, p < 0.001). In particular, the male character PSA showed higher frontal theta values (Figure 7). Furthermore, it has been found a statistically significant interaction between the variables PSA kind and Gender of the participants (F(1, 42) = 5.150, p=0.028) (Figure 8). The post hoc analysis highlighted also an increase of the frontal theta values reported by women participants in response to the male character PSA in comparison to the response of both women (p < 0.001) and men (p=0.040) to the exposure to the female character PSA.
Figure 7.
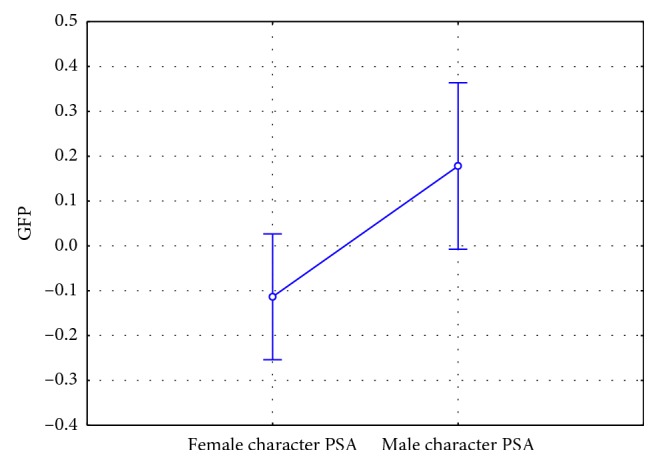
Frontal theta index: comparison between the kind of PSA (n=46). The male character PSA showed higher frontal theta values (F(1, 42) = 19.981, p < 0.001). Vertical bars denote 0.95 confidence intervals.
Figure 8.
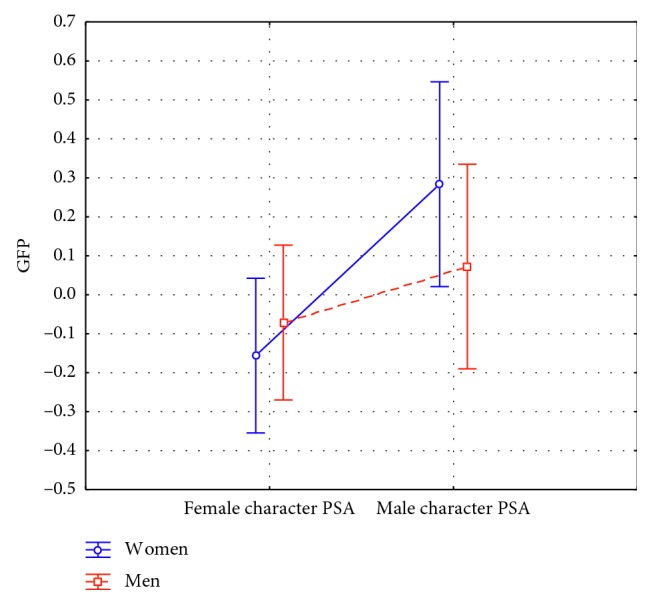
Frontal theta index: interaction between the kind of PSA and the Gender of the participants (F(1, 42) = 5.150, p=0.028) (n=46). The male character PSA showed higher frontal theta values in women in comparison to the female character PSA both in men (p=0.040) and women (p < 0.001). Vertical bars denote 0.95 confidence intervals.
3.4. Spectral Asymmetry Index Results
Concerning the SASI, the statistical analysis performed on the collected data did not provide any statistical significance.
4. Discussion
The higher ME values, the logistic regression results, and the higher frontal theta activity showed by women in response to the male character PSA (narrating the story of a man who had an heart attack at a very young age due to smoking) could be explained by the evidence that women in comparison to men have been found to be more influenced by advertisements that emphasize the negative effects of smoking on health [5].
The significant correlation between the number of cigarettes per week smoked by participants and the ME values stated that as long as the number of cigarettes increased, the relative ME values also increased. It is interesting to note that this was true only for the male character PSA, again, the one showing the negative health effects of smoking (heart attack and its consequences on the everyday life). This would be explained by the fact that smokers would feel more involved by such content, possibly resulting in higher ME values.
The tendency of approach showed by nonsmokers during the exposure to the antismoking PSAs could be explained by the perceived higher effectiveness by nonsmokers in response to advertisements eliciting strong negative emotions (sadness and fear) [72], like the PSAs included in this study.
The higher frontal theta levels reported for the male character PSA in comparison to the female character PSA were probably due to the complexity of the narrated story, in accord to a previous study providing evidence that the presence of a narrative structure in video commercials resulted in higher theta power of the left frontal area [73].
The lack of significant results obtained by the analysis employing the SASI could be explained by the fact that both PSAs would be negatively perceived due to the frightening and worrying nature of their content. However, it must also be considered the method of investigating the SASI index at the level of a region in the present article and not at the level of each single electrode or small area (grouping the electrodes by 3), as in previous studies [54, 55].
5. Conclusions
This study, through the comparison among EEG indices, showed the sensitivity of the ME and the frontal theta index in evidencing gender influences (both of the PSA characters and of the participants) on the neurophysiological response. The ME presented also the advantage of pointing out also a difference based on the smoking habit of the participants, an aspect highlighted also by the AW index. The frontal theta on the other hand highlighted the significant effect of the PSA character gender. This study then supports the usefulness of the ME and frontal theta for purposes of PSAs targeting on the basis of gender issues and of the ME and the AW and for purposes of PSAs targeting on the basis of smoking habits.
Acknowledgments
This work was funded by the European Commission by Horizon2020 project HCO-06-2015, “SmokeFreeBrain,” GA n. 681120.
Data Availability
The data relative to the study could be obtained by sending an e-mail to fabio.babiloni@uniroma1.it. Prof. Babiloni will return directly the excel file related to the data gathered by the study.
Conflicts of Interest
The authors declare that there are no conflicts of interest regarding the publication of this paper.
Authors' Contributions
Giulia Cartocci, Enrica Modica, and Dario Rossi equally contributed to this article.
References
- 1.WHO. WHO Report on the Global Tobacco Epidemic 2008. Geneva, Switzerland: WHO; 2018. http://www.who.int/tobacco/mpower/2008/en/ [Google Scholar]
- 2.WHO. WHO Report on the Global Tobacco Epidemic 2013. Geneva, Switzerland: WHO; 2018. http://www.who.int/tobacco/global_report/2013/en/ [Google Scholar]
- 3.Cartocci G., Cherubino P., Rossi D., et al. Gender and age related effects while watching TV advertisements: an EEG study. Computational Intelligence and Neuroscience. 2016;2016:10. doi: 10.1155/2016/3795325.3795325 [DOI] [PMC free article] [PubMed] [Google Scholar]
- 4.Vecchiato G., Maglione A. G., Cherubino P., et al. Neurophysiological tools to investigate consumer’s gender differences during the observation of TV commercials. Computational and Mathematical Methods in Medicine. 2014;2014:12. doi: 10.1155/2014/912981.912981 [DOI] [PMC free article] [PubMed] [Google Scholar]
- 5.Yom-Tov E., Muennig P., El-Sayed A. M. Web-based antismoking advertising to promote smoking cessation: a randomized controlled trial. Journal of Medical Internet Research. 2016;18(11):p. e306. doi: 10.2196/jmir.6563. [DOI] [PMC free article] [PubMed] [Google Scholar]
- 6.Zanchi D., Brody A., Borgwardt S., Haller S. Sex effects on smoking cue perception in non-smokers, smokers, and ex-smokers: a pilot study. Frontiers in Psychiatry. 2016;7 doi: 10.3389/fpsyt.2016.00187. [DOI] [PMC free article] [PubMed] [Google Scholar]
- 7.Wetherill R. R., Young K. A., Jagannathan K., et al. The impact of sex on brain responses to smoking cues: a perfusion fMRI study. Biology of Sex Differences. 2013;4(1):p. 9. doi: 10.1186/2042-6410-4-9. [DOI] [PMC free article] [PubMed] [Google Scholar]
- 8.Wonderlich-Tierney A. L., Wenzel K. R., Vander Wal J. S., Wang-Hall J. Food-related advertisements and food intake among adult men and women. Appetite. 2013;71:57–62. doi: 10.1016/j.appet.2013.07.009. [DOI] [PubMed] [Google Scholar]
- 9.Pope A. T., Bogart E. H., Bartolome D. S. Biocybernetic system evaluates indices of operator engagement in automated task. Biological Psychology. 1995;40(1-2):187–195. doi: 10.1016/0301-0511(95)05116-3. [DOI] [PubMed] [Google Scholar]
- 10.Streitberg B., Röhmel J., Herrmann W. M., Kubicki S. COMSTAT rule for vigilance classification based on spontaneous EEG activity. Neuropsychobiology. 1987;17(1-2):105–117. doi: 10.1159/000118347. [DOI] [PubMed] [Google Scholar]
- 11.Offenloch K., Zahner G. Computer aided physiological assessment of the functional state of pilots during simulated flight. NATO Advisory Group for Aerospace Research and Development Conference Proceedings. 1990;490:1–9. [Google Scholar]
- 12.O’Hanlon J. F., Beatty J. Concurrence of electroencephalographic and performance changes during a simulated radar watch and some implications for the arousal theory of vigilance. In: Mackie R. R., editor. Vigilance: Theory, Operational Performance, and Physiological Correlates. New York, NY, USA: Plenum Publishing; 1979. pp. 189–201. [Google Scholar]
- 13.Lubar J. F. Discourse on the development of EEG diagnostics and biofeedback for attention-deficit/hyperactivity disorders. Biofeedback and Self-Regulation. 1991;16(3):201–225. doi: 10.1007/bf01000016. [DOI] [PubMed] [Google Scholar]
- 14.Lubar J. F., Swartwood M. O., Swartwood J. N., O’Donnell P. H. Evaluation of the effectiveness of EEG neurofeedback training for ADHD in a clinical setting as measured by changes in T.O.V.A. scores, behavioral ratings, and WISC-R performance. Biofeedback and Self-Regulation. 1995;20(1):83–99. doi: 10.1007/bf01712768. [DOI] [PubMed] [Google Scholar]
- 15.Borghini G., Aricò P., Flumeri G. D., et al. EEG-based cognitive control behaviour assessment: an ecological study with professional air traffic controllers. Scientific Reports. 2017;7(1) doi: 10.1038/s41598-017-00633-7. [DOI] [PMC free article] [PubMed] [Google Scholar]
- 16.Maglione A., Borghini G., Aricò P., et al. Evaluation of the workload and drowsiness during car driving by using high resolution EEG activity and neurophysiologic indices. Proceedings of the 36th Annual International Conference of the IEEE Engineering in Medicine and Biology Society; August 2014; Chicago, IL, USA. pp. 6238–6241. [DOI] [PubMed] [Google Scholar]
- 17.Freeman F. G., Mikulka P. J., Prinzel L. J., Scerbo M. W. Evaluation of an adaptive automation system using three EEG indices with a visual tracking task. Biological Psychology. 1999;50(1):61–76. doi: 10.1016/s0301-0511(99)00002-2. [DOI] [PubMed] [Google Scholar]
- 18.Chaouachi M., Chalfoun P., Jraidi I., Frasson C. Affect and mental engagement: towards adaptability for intelligent systems. Proceedings of the 23rd International FLAIRS Conference; May 2010; Daytona Beach, FL, USA. AAAI Press; [Google Scholar]
- 19.Cartocci G., Modica E., Rossi D., et al. A pilot study on the neurometric evaluation of “effective” and “ineffective” antismoking public service announcements. Proceedings of the 38th Annual International Conference of the IEEE Engineering in Medicine and Biology Society (EMBC); August 2016; Orlando, FL, USA. pp. 4597–4600. [DOI] [PubMed] [Google Scholar]
- 20.Modica E., Rossi D., Maglione A. G., et al. Neuroelectrical indices evaluation during antismoking public service announcements on a young population. Proceedings of the IEEE 3rd International Forum on Research and Technologies for Society and Industry (RTSI); September 2017; Modena, Italy. pp. 1–5. [Google Scholar]
- 21.Cartocci G., Caratù M., Modica E., et al. Electroencephalographic, heart rate, and galvanic skin response assessment for an advertising perception study: application to antismoking public service announcements. Journal of Visualized Experiments. 2017;(126):p. e55872. doi: 10.3791/55872. [DOI] [PMC free article] [PubMed] [Google Scholar]
- 22.Modica E., Rossi D., Cartocci G., et al. Neurophysiological profile of antismoking campaigns. Computational Intelligence and Neuroscience. 2018;2018:11. doi: 10.1155/2018/9721561.9721561 [DOI] [PMC free article] [PubMed] [Google Scholar]
- 23.Davidson R. J. What does the prefrontal cortex “do” in affect: perspectives on frontal EEG asymmetry research. Biological Psychology. 2004;67(1-2):219–234. doi: 10.1016/j.biopsycho.2004.03.008. [DOI] [PubMed] [Google Scholar]
- 24.Coan J. A., Allen J. J. B. Frontal EEG asymmetry as a moderator and mediator of emotion. Biological Psychology. 2004;67(1-2):7–49. doi: 10.1016/j.biopsycho.2004.03.002. [DOI] [PubMed] [Google Scholar]
- 25.Harmon-Jones E., Gable P. A. On the role of asymmetric frontal cortical activity in approach and withdrawal motivation: an updated review of the evidence. Psychophysiology. 2017;55(1) doi: 10.1111/psyp.12879.e12879 [DOI] [PubMed] [Google Scholar]
- 26.Harmon-Jones E., Gable P. A., Peterson C. K. The role of asymmetric frontal cortical activity in emotion-related phenomena: a review and update. Biological Psychology. 2010;84(3):451–462. doi: 10.1016/j.biopsycho.2009.08.010. [DOI] [PubMed] [Google Scholar]
- 27.Smith E. E., Reznik S. J., Stewart J. L., Allen J. J. B. Assessing and conceptualizing frontal EEG asymmetry: an updated primer on recording, processing, analyzing, and interpreting frontal alpha asymmetry. International Journal of Psychophysiology. 2016;111:98–114. doi: 10.1016/j.ijpsycho.2016.11.005. [DOI] [PMC free article] [PubMed] [Google Scholar]
- 28.Davidson R. J., Hugdahl K. Brain Asymmetry. Cambridge, MA, USA: MIT Press; 1996. [Google Scholar]
- 29.Davidson R. J., Ekman P., Saron C. D., Senulis J. A., Friesen W. V. Approach-withdrawal and cerebral asymmetry: emotional expression and brain physiology: I. Journal of Personality and Social Psychology. 1990;58(2):330–341. doi: 10.1037/0022-3514.58.2.330. [DOI] [PubMed] [Google Scholar]
- 30.Sutton S. K., Davidson R. J. PREFRONTAL brain asymmetry: a biological substrate of the behavioral approach and inhibition systems. Psychological Science. 1997;8(3):204–210. doi: 10.1111/j.1467-9280.1997.tb00413.x. [DOI] [Google Scholar]
- 31.Reznik S. J., Allen J. J. B. Frontal asymmetry as a mediator and moderator of emotion: an updated review. Psychophysiology. 55(1) doi: 10.1111/psyp.12965.e12965 [DOI] [PubMed] [Google Scholar]
- 32.Cacioppo J. T. Feelings and emotions: roles for electrophysiological markers. Biological Psychology. 2004;67(1-2):235–243. doi: 10.1016/j.biopsycho.2004.03.009. [DOI] [PubMed] [Google Scholar]
- 33.Vecchiato G., Astolfi L., De Vico Fallani F., et al. Changes in brain activity during the observation of TV commercials by using EEG, GSR and HR measurements. Brain Topography. 2009;23(2):165–179. doi: 10.1007/s10548-009-0127-0. [DOI] [PubMed] [Google Scholar]
- 34.Vecchiato G., Toppi J., Astolfi L., et al. Spectral EEG frontal asymmetries correlate with the experienced pleasantness of TV commercial advertisements. Medical & Biological Engineering & Computing. 2011;49(5):579–583. doi: 10.1007/s11517-011-0747-x. [DOI] [PubMed] [Google Scholar]
- 35.Vecchiato G., Maglione A. G., Scorpecci A., et al. EEG frontal asymmetry related to pleasantness of music perception in healthy children and cochlear implanted users. Proceedings of the Annual International Conference of the IEEE Engineering in Medicine and Biology Society (EMBC); August 2012; San Diego, CA, USA. pp. 4740–4743. [DOI] [PubMed] [Google Scholar]
- 36.Silberstein R. B., Nield G. E. Measuring emotion in advertising research: prefrontal brain activity. IEEE Pulse. 2012;3(3):24–27. doi: 10.1109/mpul.2012.2189172. [DOI] [PubMed] [Google Scholar]
- 37.Klimesch W. EEG alpha and theta oscillations reflect cognitive and memory performance: a review and analysis. Brain Research Reviews. 1999;29(2-3):169–195. doi: 10.1016/s0165-0173(98)00056-3. [DOI] [PubMed] [Google Scholar]
- 38.Wascher E., Rasch B., Sänger J., et al. Frontal theta activity reflects distinct aspects of mental fatigue. Biological Psychology. 2014;96:57–65. doi: 10.1016/j.biopsycho.2013.11.010. [DOI] [PubMed] [Google Scholar]
- 39.Cartocci G., Maglione A. G., Modica E., et al. The “neurodante project”: neurometric measurements of participant’s reaction to literary auditory stimuli from dante’s “divina commedia”. Proceedings of the 5th International Workshop on Symbiotic Interaction; September 2016; Padua, Italy. pp. 52–64. [Google Scholar]
- 40.Vecchiato G., Di Flumeri G., Maglione A. G., et al. An electroencephalographic Peak Density Function to detect memorization during the observation of TV commercials. Proceedings of the 36th Annual International Conference of the IEEE Engineering in Medicine and Biology Society; August 2014; Chicago, IL, USA. IEEE; pp. 6969–6972. [DOI] [PubMed] [Google Scholar]
- 41.Vecchiato G., Borghini G., Aricò P., et al. Investigation of the effect of EEG-BCI on the simultaneous execution of flight simulation and attentional tasks. Medical & Biological Engineering & Computing. 2016;54(10):1503–1513. doi: 10.1007/s11517-015-1420-6. [DOI] [PubMed] [Google Scholar]
- 42.Di Flumeri G., Borghini G., Aricò P., et al. On the use of cognitive neurometric indexes in aeronautic and air traffic management environments. Proceedings of the International Workshop on Symbiotic Interaction; October 2015; Berlin, Germany. Springer; pp. 45–56. [Google Scholar]
- 43.Aricò P., Reynal M., Imbert J. P., et al. Human-machine interaction assessment by neurophysiological measures: a study on professional air traffic controllers. Proceedings of the 40th Annual International Conference of the IEEE Engineering in Medicine and Biology Society (EMBC); July 2018; Honolulu, HI, USA. IEEE; pp. 4619–4622. [DOI] [PubMed] [Google Scholar]
- 44.Di Flumeri G., Borghini G., Aricò P., et al. EEG-based mental workload neurometric to evaluate the impact of different traffic and road conditions in real driving settings. Frontiers in Human Neuroscience. 2018;12:p. 509. doi: 10.3389/fnhum.2018.00509. [DOI] [PMC free article] [PubMed] [Google Scholar]
- 45.Aricò P., Borghini G., Di Flumeri G., N Sciaraffa, Colosimo A., Babiloni F. Passive BCI in operational environments: insights, recent advances, and future trends. IEEE Transactions on Biomedical Engineering. 64(7):1431–1436. doi: 10.1109/tbme.2017.2694856. [DOI] [PubMed] [Google Scholar]
- 46.Aricò P., Borghini G., Graziani I., et al. Towards a multimodal bioelectrical framework for the online mental workload evaluation. Proceedings of the 36th Annual International Conference of the IEEE Engineering in Medicine and Biology Society; August 2014; Chicago, IL, USA. pp. 3001–3004. [DOI] [PubMed] [Google Scholar]
- 47.Borghini G., Arico P., Ferri F., et al. A neurophysiological training evaluation metric for air traffic management. Proceedings of the 36th Annual International Conference of the IEEE Engineering in Medicine and Biology Society; August 2014; Chicago, IL, USA. pp. 3005–3008. [DOI] [PubMed] [Google Scholar]
- 48.Borghini G., Arico P., Astolfi L., et al. Frontal EEG theta changes assess the training improvements of novices in flight simulation tasks. Proceedings of the 35th Annual International Conference of the IEEE Engineering in Medicine and Biology Society (EMBC); July 2013; Osaka, Japan. pp. 6619–6622. [DOI] [PubMed] [Google Scholar]
- 49.Wisniewski M. G., Thompson E. R., Iyer N., Estepp J. R., Goder-Reiser M. N., Sullivan S. C. Frontal midline θ power as an index of listening effort. Neuroreport. 2015;26(2):94–99. doi: 10.1097/wnr.0000000000000306. [DOI] [PubMed] [Google Scholar]
- 50.Wisniewski M. G. Indices of effortful listening can be mined from existing electroencephalographic data. Ear and Hearing. 2017;38(1):e69–e73. doi: 10.1097/aud.0000000000000354. [DOI] [PubMed] [Google Scholar]
- 51.Cartocci G., Maglione A. G., Vecchiato G., et al. Mental workload estimations in unilateral deafened children. Proceedings of the 37th Annual International Conference of the IEEE Engineering in Medicine and Biology Society (EMBC); August 2015; Milano, Italy. pp. 1654–1657. [DOI] [PubMed] [Google Scholar]
- 52.Gevins A., Smith M. E. Neurophysiological measures of cognitive workload during human-computer interaction. Theoretical Issues in Ergonomics Science. 2003;4(1-2):113–131. doi: 10.1080/14639220210159717. [DOI] [Google Scholar]
- 53.Aricò P., Aloise F., Schettini F., Salinari S., Mattia D., Cincotti F. Influence of P300 latency jitter on event related potential-based brain-computer interface performance. Journal of Neural Engineering. 2014;11(3) doi: 10.1088/1741-2560/11/3/035008.035008 [DOI] [PubMed] [Google Scholar]
- 54.Hinrikus H., Suhhova A., Bachmann M., et al. Electroencephalographic spectral asymmetry index for detection of depression. Medical & Biological Engineering & Computing. 2009;47(12):1291–1299. doi: 10.1007/s11517-009-0554-9. [DOI] [PubMed] [Google Scholar]
- 55.Orgo L., Bachmann M., Lass J., Hinrikus H. Effect of negative and positive emotions on EEG spectral asymmetry. Proceedings of the 37th Annual International Conference of the IEEE Engineering in Medicine and Biology Society (EMBC); August 2015; Milano, Italy. pp. 8107–8110. [DOI] [PubMed] [Google Scholar]
- 56.Hu X., Yu J., Song M., et al. EEG correlates of ten positive emotions. Frontiers in Human Neuroscience. 2017;11 doi: 10.3389/fnhum.2017.00026. [DOI] [PMC free article] [PubMed] [Google Scholar]
- 57.Aftanas L. I., Reva N. V., Savotina L. N., Makhnev V. P. Neurophysiological correlates of induced discrete emotions in humans: an individually oriented analysis. Neuroscience and Behavioral Physiology. 2006;36(2):119–130. doi: 10.1007/s11055-005-0170-6. [DOI] [PubMed] [Google Scholar]
- 58.Aftanas L. I., Pavlov S. V. Trait anxiety impact on posterior activation asymmetries at rest and during evoked negative emotions: EEG investigation. International Journal of Psychophysiology. 2005;55(1):85–94. doi: 10.1016/j.ijpsycho.2004.06.004. [DOI] [PubMed] [Google Scholar]
- 59.Jacobs G. D., Benson H., Friedman R. Topographic EEG mapping of the relaxation response. Biofeedback and Self-Regulation. 1996;21(2):121–129. doi: 10.1007/bf02284691. [DOI] [PubMed] [Google Scholar]
- 60.Flumeri G. D., Aricó P., Borghini G., Colosimo A., Babiloni F. A new regression-based method for the eye blinks artifacts correction in the EEG signal, without using any EOG channel. Proceedings of the 38th Annual International Conference of the IEEE Engineering in Medicine and Biology Society (EMBC); August 2016; Orlando, FL, USA. pp. 3187–3190. [DOI] [PubMed] [Google Scholar]
- 61.Delorme A., Makeig S. EEGLAB: an open source toolbox for analysis of single-trial EEG dynamics including independent component analysis. Journal of Neuroscience Methods. 2004;134(1):9–21. doi: 10.1016/j.jneumeth.2003.10.009. [DOI] [PubMed] [Google Scholar]
- 62.Lehmann D., Michel C. M. Intracerebral dipole source localization for FFT power maps. Electroencephalography and Clinical Neurophysiology. 1990;76(3):271–276. doi: 10.1016/0013-4694(90)90022-c. [DOI] [PubMed] [Google Scholar]
- 63.Skrandies W. Global field power and topographic similarity. Brain Topography. 1990;3(1):137–141. doi: 10.1007/bf01128870. [DOI] [PubMed] [Google Scholar]
- 64.Skrandies W. Contrast and stereoscopic visual stimuli yield lateralized scalp potential fields associated with different neural generators. Electroencephalography and Clinical Neurophysiology. 1991;78(4):274–283. doi: 10.1016/0013-4694(91)90181-3. [DOI] [PubMed] [Google Scholar]
- 65.Rodin E. P3 latency determination by global field power in normal subjects. Journal of Clinical Neurophysiology. 1991;8(1):88–94. doi: 10.1097/00004691-199101000-00011. [DOI] [PubMed] [Google Scholar]
- 66.Ahonen L., Huotilainen M., Brattico E. Within- and between-session replicability of cognitive brain processes: an MEG study with an N-back task. Physiology & Behavior. 2016;158:43–53. doi: 10.1016/j.physbeh.2016.02.006. [DOI] [PubMed] [Google Scholar]
- 67.Giroud N., Lemke U., Reich P., Matthes K. L., Meyer M. The impact of hearing aids and age-related hearing loss on auditory plasticity across three months—an electrical neuroimaging study. Hearing Research. 2017;353:162–175. doi: 10.1016/j.heares.2017.06.012. [DOI] [PubMed] [Google Scholar]
- 68.Iannilli E., Stephan L., Hummel T., Reichmann H., Haehner A. Olfactory impairment in Parkinson’s disease is a consequence of central nervous system decline. Journal of Neurology. 2017;264(6):1236–1246. doi: 10.1007/s00415-017-8521-0. [DOI] [PubMed] [Google Scholar]
- 69.Maurer K., Dierks T., Strik W. K., Frölich L. P3 topography in psychiatry and psychopharmacology. Brain Topography. 1990;3(1):79–84. doi: 10.1007/bf01128864. [DOI] [PubMed] [Google Scholar]
- 70.Harmon-Jones E. Contributions from research on anger and cognitive dissonance to understanding the motivational functions of asymmetrical frontal brain activity. Biological Psychology. 2004;67(1-2):51–76. doi: 10.1016/j.biopsycho.2004.03.003. [DOI] [PubMed] [Google Scholar]
- 71.Coan J. A., Allen J. J. B. Frontal EEG asymmetry and the behavioral activation and inhibition systems. Psychophysiology. 2003;40(1):106–114. doi: 10.1111/1469-8986.00011. [DOI] [PubMed] [Google Scholar]
- 72.Biener L., McCallum-Keeler G., Nyman A. L. Adults’ response to Massachusetts anti-tobacco television advertisements: impact of viewer and advertisement characteristics. Tobacco Control. 2000;9(4):401–407. doi: 10.1136/tc.9.4.401. [DOI] [PMC free article] [PubMed] [Google Scholar]
- 73.Wang R. W. Y., Chang Y.-C., Chuang S.-W. EEG spectral dynamics of video commercials: impact of the narrative on the branding product preference. Scientific Reports. 2016;6(1) doi: 10.1038/srep36487. [DOI] [PMC free article] [PubMed] [Google Scholar]
Associated Data
This section collects any data citations, data availability statements, or supplementary materials included in this article.
Data Availability Statement
The data relative to the study could be obtained by sending an e-mail to fabio.babiloni@uniroma1.it. Prof. Babiloni will return directly the excel file related to the data gathered by the study.


