Abstract
Purpose.
To improve cytometric phenotyping abilities and better understand a cell population with high interindividual variability, a novel Raman-based microanalysis was developed to characterize pulmonary alveolar macrophages on the basis of chemical composition, specifically to measure and characterize intracellular drug distribution and phase separation in relation to endogenous cellular biomolecules.
Methods.
The microanalysis was developed for the commercially-available WiTec alpha300R confocal Raman microscope. Alveolar macrophages were isolated and incubated in the presence of pharmaceutical compounds nilotinib, chloroquine, or etravirine. A Raman data processing algorithm was specifically developed to acquire the Raman signals emitted from single-cells and calculate the signal contributions from each of the major molecular components present in cell samples.
Results.
Our methodology enabled analysis of the most abundant biochemicals present in typical eukaryotic cells and clearly identified “foamy” lipid-laden macrophages throughout cell populations, indicating feasibility for cellular lipid content analysis in the context of different diseases. Single-cell imaging revealed differences in intracellular distribution behavior for each drug; nilotinib underwent phase separation and self-aggregation while chloroquine and etravirine accumulated primarily via lipid partitioning.
Conclusions.
This methodology establishes the foundation for quantitative high-content cytometric analyses requiring small numbers of cells with foreseeable applications in toxicology, disease pathology, and drug discovery.
Keywords: confocal Raman microscopy, intracellular drug bioaccumulation, single-cell chemical imaging, lipid-laden foamy macrophages, pulmonary alveolar macrophages
INTRODUCTION
Serving as the frontline of the mammalian inflammatory immune response, macrophages play a pivotal role in the defense and maintenance of all organ systems. At the gas-air interface of the lungs reside alveolar macrophages. Within the alveoli, these cells sequester inhaled particulate matter while pulmonary blood flow through the lung also exposes them to systemically circulating drug compounds.(1–3) Small molecules with high lipophilicity and weakly basic amines groups may passively diffuse through cellular membranes, becoming protonated and positively charged within the acidic lysosomal compartments.(4–7) The electrostatically-charged form of the molecule has a much lower membrane permeability which prevents its exit by passive diffusion, causing intracellular accumulation of the compound. Bioaccumulation of small molecules has been reported for a multitude of drug compounds and in many cases has been linked with the concurrent accumulation of lipids within various organs and cell types.(8–10) In many cases, these foreign chemical compounds have been reported to accumulate within alveolar macrophages.(11, 12) To date, there is no direct association with toxicity but in terms of drugs, regulatory agencies (FDA and corresponding administrations in Europe and Japan) generally consider it a potentially adverse reaction and as such, are hesitant to grant such compounds market-approval.(13) Despite an abundance of research endeavors over the past 30 years, the relationship between drug exposure, lipid accumulation, and observed organ toxicity has yet to be firmly established.(14–16) The presence of “foamy” lipid-laden macrophages has historically served as the histopathological hallmark with transmission electron microscopy providing the gold standard for diagnosis.(17, 18) Though robust and adaptable, perhaps macrophages have a quantifiable limit to how much foreign material they can stably carry. As such, we believe quantitative characterization of this system and its limits would surely serve to improve our understanding of the risk-benefit properties for a multitude of clinically-effective drugs.
Confocal Raman micro-spectroscopy offers a novel approach for the quantitative study of bioaccumulation phenomena at the microscopic level, allowing direct chemical analysis of single cells without the need for radiolabels or fluorescent tags.(19–23) In short, an excitation laser is coupled to a confocal microscope via fiber optic cable and focused into a 3D voxel which then scans the sample. A portion of the laser light is absorbed by the sample, inducing molecular vibrations, while the remaining energy is scattered as light of different wavelengths. Scattered light is separated by a diffraction grating and the number of emitted photons at each wavelength is detected across a CCD detector array. The change in wavelength relative to the laser is referred to as the Raman shift and is measured in wavenumbers (cm−1); the number of photons detected at each wavenumber form the basis of Raman spectra which serve as molecular “fingerprints” and can be interpreted to characterize the chemical composition of the analyzed sample. Advantages of Raman-based techniques include minimal sample preparation, non-destructive analysis, and potential identification of unknown chemical species present within a sample of interest. While conventional methods such as flow cytometry, immunostaining, and fluorescent dyes provide only relative measurements, Raman enables the direct measurement of unadulterated cellular samples. Wielding submicron spatial resolution capabilities, confocal Raman micro-spectroscopy enables chemical composition analysis at the subcellular and cell population levels.(24–26)
In an effort to improve cytometric phenotyping abilities and better understand a cell population that is highly variable between individuals, a novel Raman-based microanalysis was developed and employed to characterize pulmonary alveolar macrophages on the basis of chemical composition, specifically to measure and characterize intracellular drug distribution and phase separation in relation to proteins, lipids, and nucleic acids. Although Raman-based measurements of intracellular drug accumulation have been reported previously, to the best of our knowledge this study represents the first report of drug distribution mapped at the subcellular level in relation to the most abundant endogenous molecular species comprising typical eukaryotic cells.(4, 27, 28) Additionally, we introduce a novel analytical approach for the screening of bioaccumulation phenomena throughout cell populations, thereby establishing the analytical foundations for a robust quantitative high-content cytometric methodology that only requires a small number of cells. This makes the approach feasible for use in the clinical setting which will permit a more accurate cellular phenotypic analysis than ever before possible. Overall, this study demonstrates the feasibility of our novel sample preparation and Raman-based chemical characterization methodology for the purposes of alveolar macrophage compositional phenotyping and intracellular drug accumulation measurements.
MATERIALS AND METHODS
BAL Cell Isolation, Culture, and Preparation
C57BL/6 mice (4-week old males; Jackson Laboratory, Bar Harbor, ME) were acclimatized for 1 week in a pathogen-free animal facility prior to euthanasia via CO2 asphyxiation. The tracheae were surgically isolated, cannulated, and alveolar cells were procured via bronchoalveolar lavage (BAL) with sterile phosphate-buffered saline (DPBS; Gibco Life Technologies, Carlsbad, CA) containing 0.5mM EDTA (Sigma). BAL cell suspensions were centrifuged and cell pellets were resuspended in RPMI 1640 medium (Gibco Life Technologies, Carlsbad, CA) at ~300 cells/μL and 15μL of suspension was transferred to surface of sterilized silicon chips (5×5mm; Ted Pella, Inc., Redding, CA) within a 24-well plate (1 chip per well); cells were incubated (37oC, 5% CO2) for 1 hour to allow for adherence of macrophages. RPMI 1640 medium (750μL), blank or containing drug at the indicated concentration, was added to each well and cells were incubated for specified amounts of time (37oC, 5% CO2). Following drug incubation, culture medium was removed via vacuum and silicon chips were rinsed via brief submersion in isotonic saline (0.9% NaCl wt/wt) then deionized water to remove salt; the residual water was wicked away immediately with a Kimwipe to prevent cell lysis. Samples were air-dried, depositing the non-volatile cellular components as dry dispersions on the surface of silicon chips.
Reagents and Reference Components
To generate representative reference sample spectra, the chemical components of interest were dissolved in an appropriate solvent and an aliquot was transferred to the surface of a silicon chip. The solvent evaporated at room temperature leading to deposition of reference material in the form of thin dispersions on the surface of the chip. Protein, lipid, and nucleic acid reference spectra were acquired from dispersions of bovine albumin (MP Biomedicals, Solon, OH), 1,2-dipalmitoyl-sn-glycero-3-phosphocholine (DPPC; Avanti Polar Lipids, Inc., Alabaster, AL), and DNA (from salmon sperm; AmResco Inc., Solon, OH), respectively. The following drug compounds were procured from various sources: nilotinib (free base; LC laboratories, Woburn, MA), chloroquine (diphosphate salt; Sigma-Aldrich Inc., St. Louis, MO), and etravirine (Advanced ChemBlocks Inc., Burlingame, CA). Drugs were dissolved in methanol, spotted on silicon chips and allowed to dry; reference spectra were obtained from each dry dispersion.
Stoichiometric Calibration Methodology
Formulated as stoichiometric mixtures of drug and DPPC dissolved in a solution of methanol and water (5:1 respective volumetric ratio), a known volume was transferred to the surface of a silicon chip and the solvent was allowed to air-dry. Calibration samples were intelligently designed to result in thin dispersions of drug and phospholipid (in known mass ratios) that most closely represented the dimensions and conditions of the drug-treated cell samples under investigation. Additionally, stoichiometric mixtures of protein and DNA were dissolved in water, deposited onto silicon chips, and allowed to air-dry. Reference and calibration samples were analyzed using large area scan methodology and average spectra with standard deviations from each scan are reported herein. Least squares regression modelling was used to quantitatively interpret the acquired calibration spectra and extract the % signal for each component (i.e. phospholipid and drug). Linear correlation of % drug signal with the actual mass ratio of drug in phospholipid enabled inferring the extent of drug accumulation in discrete lipid inclusions.
Raman Measurements
All Raman spectra and images were acquired by the WiTec alpha300R confocal Raman microscope equipped with the 532nm solid-state sapphire excitation laser (0–55 mW, tunable intensity range) and a 100x air objective (Zeiss Epiplan-NEOFLUAR, N.A. = 0.9) coupled to CCD detector via a multi-mode fiber of 100μm diameter, serving as the confocal pinhole. Single-cell Raman imaging was performed via continuous area scan across entire sample region. Each Raman image consisted of 90 × 90 spectra with exposure time of 0.3 seconds each, resulting in 8100 spectra with a total acquisition time of approximately 45 minutes per cell. Point spectra were acquired by focusing laser on nuclei or cytoplasmic inclusions and averaging Raman signal for 25 seconds. Integrated Raman spectra were acquired via continuous scan of a 20 × 20μm area using a 50x air objective lens (Zeiss Epiplan-NEOFLUAR, N.A. = 0.75) with pixel dimensions of 1μm2; the integration time was set to 0.1 seconds per spectrum, yielding 400 spectra with an acquisition time of ~1 minute per cell.
Algorithmic Data Preprocessing
Unless noted otherwise, all Raman spectral data were preprocessed using equivalent algorithm parameters. Initial data preprocessing was performed in WiTec Project FOUR software to remove cosmic ray interference and perform spectral smoothing. The data were then exported to Matlab® (Natick, MA USA) and the remainder of preprocessing and analysis were performed using algorithms developed in-house. The spectral regions of interest were excised from the dataset between the wavenumbers 1200–3200 (cm−1) and used for all subsequent preprocessing. Background subtraction was performed via baseline estimation within multiple shifted windows across the spectra followed by regression of the varying baseline to window points via spline approximation. The spectra were then normalized by the standard deviation (yielding a standard deviation of 1 for all spectra). Spectral regions of interest, 1200–1800 and 2700–3200 cm−1 (including 2100–2300 cm−1 for etravirine-treated samples), were then interpreted via statistical analysis. Each pixel of integrated area scans was preprocessed individually and the spectral signals were summed across the entire scanned area, yielding a single Raman spectrum for each cell analyzed.
Statistical Interpretation of Raman Hyperspectral Datasets
To extract relevant chemical information from the acquired hyperspectral datasets, non-negative least squares regression modelling was employed; using pure component reference spectra, measured Raman spectra were deconvoluted to determine the relative signal contributions from each component of interest according to the following model:
Where:
relative wavenumber or Raman shift (cm−1)
measured sample spectrum
component “n” reference spectrum
component “n” regression estimate
residual spectrum
The relative signal contribution for each component was calculated using the regression estimators; the following example calculation was provided for clarity:
To assess model accuracy, the coefficient of determination (R2) was calculated by comparing the variance initially present in the measured sample spectrum with the remaining variance (calculated across the residual spectrum) after regression analysis and subsequently used to determine the fraction of information contained within the measured Raman spectrum that is unexplained by the reference component library as follows:
For single cell imaging, the algorithm was applied on a per-pixel basis to every spectrum of cell image and pseudo-color Raman maps were generated using the relative signal contributions from each of the reference components. The coefficient of determination (R2) was calculated for each pixel and used to determine the relative percent of Raman signal unexplained by the reference library spectra; 3D surface plots were generated to indicate specific subcellular regions that deviated from the reference library components. For drug-treated cell samples, a four-component regression model was applied and the relative drug signal contribution was translated into relative drug mass according to the stoichiometric calibration curve. To assess subcellular drug distribution, single-cell Raman images were acquired and 3D surface plots were generated with the relative drug mass plotted on the z-axis.
RESULTS AND DISCUSSION
Experimental Setup and Raman Microanalysis
Herein a silicon chip served as robust and reliable sample substrate; despite being exceptionally economical, they are often overlooked as a candidate-substrate for Raman microanalysis of single cells.(19) Sample preparation on silicon enabled isolation of adherent BAL cells from healthy mice, presumably alveolar macrophages, as thin dry dispersions on the surface of the chip. Upon reflected brightfield inspection, the cells exhibited a rainbow-colored appearance which was attributed to the thin-film interference of light passing through the sample and reflection from the silicon surface; indicating the vertical thickness of each cell was in the submicron range. Assuming the sample thickness to be less than 1.5 microns (equal to the theoretical height of the confocal voxel) Raman images acquired across a single z-plane were representative of the total cellular contents. Single-cell Raman imaging methodology was employed to acquire Raman hyperspectral datasets for 36 individual cells, which were then used to develop a robust computational algorithm (Figure 1B). The automated spectral pre-processing parameters, which included cosmic ray removal, a moving average smoothing matrix, baseline correction, and normalization, were optimized to extract the pure sample Raman spectra on a per-pixel-basis.
Figure 1.
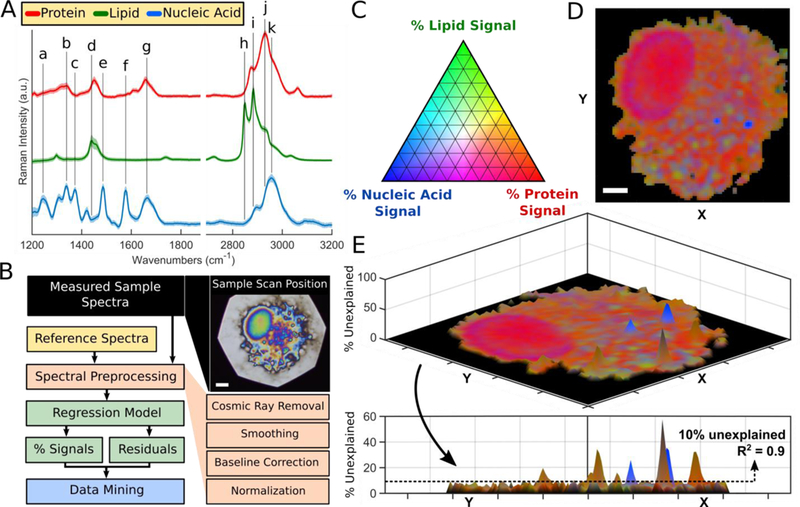
Raman imaging reveals spatial distribution and relative abundance of major biochemical components throughout single cells. (A) Regression model reference spectra with tentative vibrational assignments as indicated (a-k). (B) Computational algorithm outline for Raman data processing and interpretation methodology; reflected brightfield image of scan position. Scale bar: 5 μm. (C) Pseudo-color ternary scale for visualization of component signals (%) throughout Raman images. (D) Compiled Raman image results for a single cell; spectra were processed and interpreted on a per-pixel basis as described in the methods. Scale bar: 5 μm. (E) 3D surface plot with unexplained signals (%) on the z-axis; calculated R2>0.9 for most pixels of cell image (R2 = 0.9 is equivalent to 10% unexplained).
Statistical Modelling and Single-Cell Imaging
To translate the acquired Raman signals into chemically relevant information, a least squares regression model was employed.(29, 30) Although more sophisticated statistical approaches are commonly utilized (i.e. principal component analysis(31, 32)), least squares regression is most appropriate because it allows for direct quantitative measurement of specific phenotypic/compositional changes in macrophages that occur in response to drug exposure or lung injury, thereby providing direct extraction of biologically-relevant information from the acquired spectra. Utilizing the most abundant biochemical components present within a typical eukaryotic cell (i.e. protein, lipid, and nucleic acid) as reference spectra (Figure 1A), the measured sample spectra were deconvoluted into the relative signal contribution from each component, yielding R2 values of >0.9 for most pixels of each Raman image – image pixels with R2 <0.75 were used to identify cell edges and assign silicon substrate to black. A pseudo-color ternary scale (Figure 1C) was used to visualize the relative signal contributions from each component across the entirety of each measured cell, thereby generating Raman chemical images of individual cells (Figure 1D). Furthermore, regression analysis residuals were utilized to calculate the percent of unexplained spectral variance at each pixel of the Raman images (Figure 1E). Punctate patterns were detected throughout the cytoplasm which gave rise to Raman signals unaccounted for by the reference spectra library; the most notable spectral deviations, revealed by the residual spectra, occurred around 1593 cm−1 (Figure S-1). The Raman band consistently observed at 1585 cm−1 likely represents mitochondrial cytochrome c; further studies are required to understand the relationship between this Raman signal and metabolic activity in eukaryotic cells.(33, 34) The presence of the cytochrome c peak in a punctate pattern associated with the cytoplasm of cells suggests cells remained viable during the course of drug treatment and confirms that cytochrome c did not leak out of mitochondria into the cytosol, before or during Raman image data acquisition. Within single cells, the cytoplasm could be clearly distinguished from the protein-rich nuclei; cytoplasmic inclusions gave rise to heterogeneous Raman signals which we attributed to the presence of lipid-rich inclusions (e.g. lamellar bodies, lysosomes, other membranous organelles, etc.) and nucleic acid-rich regions (e.g. mitochondria, stress granules, P bodies, etc.). Our Raman imaging methodology successfully revealed compositional heterogeneity on a per-cell basis and identified “foamy” lipid-laden macrophages throughout, indicating the feasibility of cell population phenotyping on a compositional basis (Figure 2A).
Figure 2.
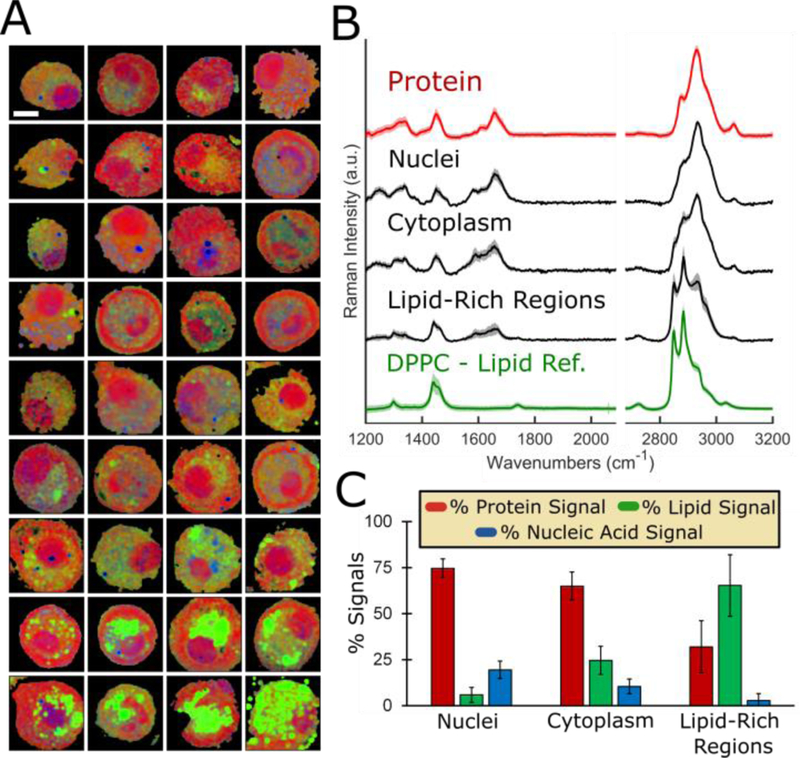
Alveolar macrophages exhibit heterogeneous composition on a per-cell basis. (A) Gallery of 36 cells analyzed with Raman imaging methodology. Scale bar: 10 μm. (B) Extracted average spectra (S.D. shown by shadow) from nuclei, cytoplasmic regions, and lipid-rich regions overlaid with protein and lipid (DPPC) reference spectra (n=25 spectra each group). (C) Regression modelling results for shown extracted spectra (average ± S.D.).
To more thoroughly explore the intracellular structure of cells and confirm the validity of our statistical model, 1.5 × 1.5μm area average spectra corresponding with specific subcellular compartments were extracted from single-cell Raman images; the three regions of interest were nuclei, cytoplasm, and lipid-rich cytoplasmic regions which were respectively assigned visually as the large red circular spots (~10% cell volume), yellow-orange cytoplasmic regions, and bright-green cytoplasmic regions (Figure 2B). 25 spectra were extracted from each of the specified regions of interest and deconvoluted via regression modelling to estimate the relative signal contribution from each major component of interest (Figure 2C). The lipid-rich regions emitted Raman spectra which closely matched that of the phospholipid reference spectra DPPC, the primary chemical component of pulmonary surfactant.(35) Additionally, point spectra were acquired from the nuclei and corresponding cytoplasmic inclusion regions for 120 individual cells (Figure S-3). As evidenced by the averaged point spectra from 120 cytoplasmic inclusions, the unexplained band at 1585 cm−1 was absent from the most spectra, presumably because the entirety of each cell was not scanned. The calculated difference spectra revealed wavenumbers at which the most pronounced spectral differences occurred, which closely corresponded with the tentative vibrational assignments for the major Raman peaks of the most abundant biochemical species present in a typical eukaryotic cell (Table S-I). Cytoplasmic regions and the nuclei of untreated cells primarily yielded Raman signals most closely matching that of protein with less apparent contributions from lipid and nucleic acid. This was consistent with the following theoretical relative masses reported for a typical eukaryotic cell (dry weight): 65% protein, 15% lipid, 5% nucleic acid (15% heterogeneous mixture of small molecular metabolites and ions).(36) Regression modelling estimated relative Raman signal contributions within the nuclei were 78.7 ± 5.64% protein signal and 14.8 ± 5.26% nucleic acid signal with a negligible lipid signal of 6.46 ± 4.03% (average ± S.D., n=120 cells). Quantitation via stoichiometric calibration with protein-to-DNA mixtures measured nucleic acid content at 20.6 ± 5.14% of total dry mass within nuclei (Figure S-4) which was consistent with expected theoretical nucleic acid content for a typical eukaryotic cell nucleus.
Screening Cell Populations for Intracellular Drug Accumulation
For characterization of drug sequestration and accumulation within alveolar macrophages, three test compounds were chosen based on physicochemical properties and previous reports of intracellular accumulation (Table S-II).(4, 10, 37) Reference spectra were acquired for each and characteristic peaks were identified to confirm each compound emitted a spectrally-unique Raman signal (Figure S-5). The tyrosine kinase inhibitor nilotinib was chosen as the model compound for initial algorithm and quantitative method development purposes because it yields a relatively strong Raman signal and its intracellular accumulation has been reported by previous studies.(4) Stoichiometric calibration mixtures were generated, diluting the drug into lipid at known ratios, and the acquired Raman spectra were deconvoluted via regression modelling to extract the % nilotinib signal for each (Figure 3A). This methodology defined the linear range by correlating % drug signal with the actual relative mass (% wt/wt) in each calibration sample (Figure 3B); the linear range was experimentally determined to be 3.5% - 100% nilotinib (wt/wt).
Figure 3.
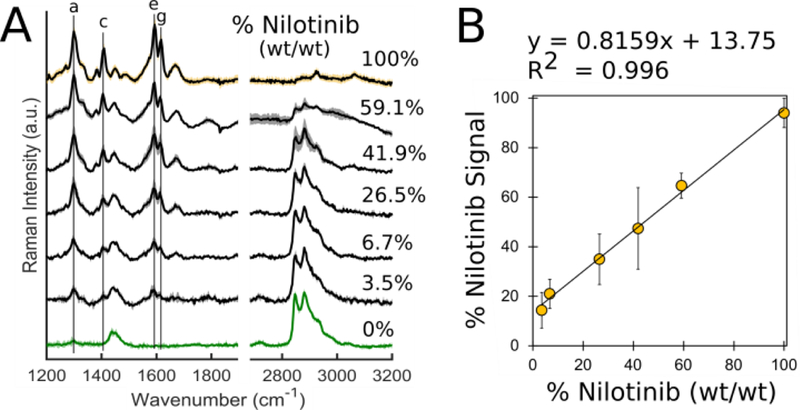
(A) Average Raman spectra (S.D. shown by shadow) acquired from area scans of each calibration standard. (B) Calibration curve showing strong correlation between % nilotinib signal acquired from regression modelling and actual % nilotinib (wt/wt) present in standard.
We then tested our methodology’s ability to detect temporal accumulation of sequestered drug compounds by isolating and incubating alveolar macrophages in the presence of 8 μM nilotinib for 24 and 48 hours. Samples were collected at appropriate time points, washed, dried, and analyzed via integrated Raman area scans (Figure 4A). The resulting “integrated” spectra represented the entirety of a cell’s chemical components because Raman signals were acquired across each entire cell and were summed into the total Raman signal, yielding a single “integrated” spectrum for each cell analyzed.(38) 20 individual cells were analyzed from each of the populations and their integrated spectra were algorithmically processed and interpreted via regression modelling (Figure 4B). Difference spectra were calculated by subtracting the average integrated spectrum of untreated control cells from each treated cell’s integrated spectrum; the calculated difference spectra matched closely with the pure nilotinib reference spectrum and the observed spectral differences were attributed to temporal accumulation of nilotinib within the alveolar macrophages.
Figure 4.
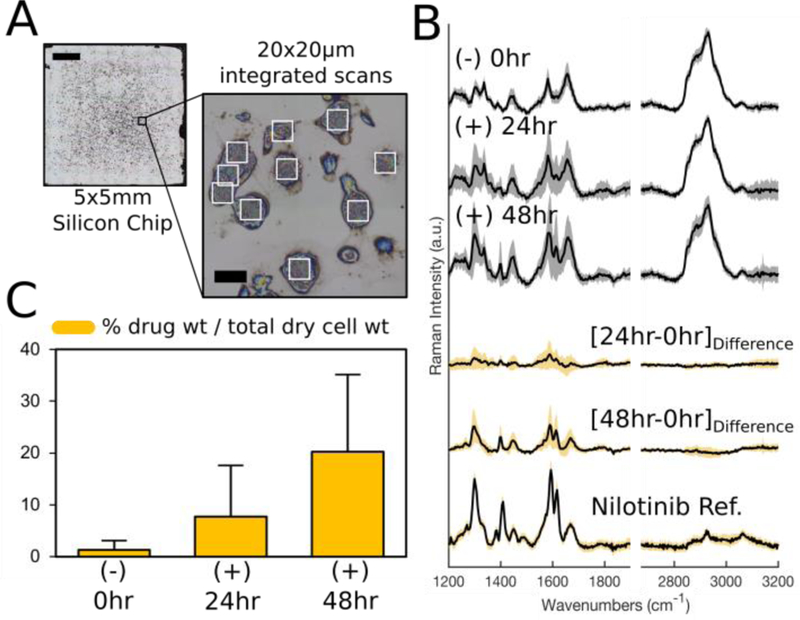
(A) Representative reflected brightfield image of alveolar macrophages prepared on silicon chip, illustrating the integrated scan areas for a group of cells. Scale bars: 1000 μm and 30 μm. (B) The average integrated Raman spectra (S.D. shown by shadow) for each cell population (n=20 cells each group); difference spectra reveal spectral contributions which closely match characteristic peaks of nilotinib reference spectra. (C) Quantitative measurements of nilotinib accumulation for each cell population (average ± S.D.).
By deconvoluting the integrated spectra via regression modelling and employing the calibration curve, the mass % of drug accumulation relative to each cell’s total dry weight was determined for cell populations (Figure 4C). Our results indicated that after 48 hours nilotinib represented 20% of an exposed cell’s total chemical composition on average. This suggests nilotinib becomes one of the most abundant chemical species present within alveolar macrophages after 48-hour exposure, exceeding theoretical estimates for typical lipid content of 15%.(36) It should be noted that differential accumulation was observed throughout the population with some cells sequestering noticeably more drug than others. It is quite likely that differences in drug sequestering ability and/or phenotype exist on a cell-by-cell basis throughout each macrophage population, as this has been reported for other compounds.(12) Since integrated area scans summed the Raman signals from across the entirety of each cell, the unknown band at 1585 cm−1, attributed to mitochondrial cytochrome c, was clearly present in untreated cell spectra. Spectral overlap of this Raman signal with nilotinib’s characteristic Raman peak resulted in minimal spectral interference: an average of 1.29% nilotinib (wt/wt) was reported in untreated cells (which was below nilotnib’s limit of quantitation) and false-positives for drug detection occurred in <50% of the population. To verify method feasibility for the study of small molecules other than nilotinib, the test compounds chloroquine and etravirine were utilized. Stoichiometric calibration mixtures were utilized to experimentally determine the quantitative range of regression modelling for both compounds (Figure S-6).
We then incubated isolated alveolar macrophages in the presence of 50 μM chloroquine or etravirine for 4 hours, before preparation and analysis via integrated Raman scans. The average untreated cell spectrum was subtracted from each of the processed spectra acquired from treated cells and difference spectra were generated for each treatment group (Figure S-7). Spectral overlay revealed clear matches between each drug’s reference spectrum and the calculated difference spectra, indicative of chemical bioaccumulation within exposed cells. Quantitative modelling estimated total cellular chloroquine content at 19.8 ± 13.9% (wt/wt) for the 20 cells analyzed; no false-positives were detected among the untreated population. Etravirine accumulation was measured at 6.40 ± 3.47% (wt/wt) of the total cellular contents for 20 cells analyzed, suggesting method feasibility for detection and screening of differential drug bioaccumulation in cell populations. The accumulation of drug molecules inside cells can be attributed to ion trapping of weakly basic molecules within the acidic lysosomes of cells, which is an important phenomenon with significant pharmacokinetic implications that is typically underrecognized but has been reported for many compounds.(4, 12, 39)
Single-Cell Raman Imaging for Quantitative Characterization of Intracellular Drug Distribution
Our Raman imaging algorithm was coupled with the stoichiometric calibration curve to quantitatively characterize intracellular accumulation and distribution of drug compounds in relation to subcellular compartments and endogenous biomolecules of interest. Drug incubation concentrations and exposure time were selected based on similar experimental studies that have also explored drug distribution inside cells, so our observations can be compared with the previous reports.4,10 First, the single-cell Raman imaging methodology was utilized to acquire datasets for individual macrophages incubated in the presence of 20 μM nilotinib for 8 hours. Four-component regression modelling extracted % component signals on the per-pixel basis with the pseudo-color ternary scale indicating the relative signal contribution from endogenous biomolecules; the % drug signal was plotted on the z-axis so that the biological color intensity was contingent on signal contribution: accordingly fading to black as the drug’s signal contribution increased (Figure 5A). On the x-y plane, Raman imaging enabled clear distinction between nucleus and cytoplasm and revealed the presence of lipid-rich regions, presumably lamellar bodies, throughout the cytoplasm (Figure 5B). Translation of nilotinib signals to relative mass (wt/wt) and subsequent generation of 3D surface plots revealed distinct cytoplasmic inclusions, each approximately 2–3 microns in diameter and consisting of 30–65% nilotinib (wt/wt) in each of the specified regions (Figure 5C). Nilotinib was below its limit of quantitation (3.5% wt/wt) for most pixels of the cell image. Extraction of average spectra from indicated regions of interest allowed for clear visual matching of the major signal-contributing components throughout different regions of the cell (Figure 5D). Considering the physical dimensions of the confocal voxel and the resolution of these images, our results strongly suggest that nilotinib is phase separating and potentially precipitating intracellularly, presumably from within the acidic lysosomal compartments also known to accumulate lipids. Perhaps this explains why nilotinib self-aggregates were observed in close proximity to lipid-rich cytoplasmic regions.(40)
Figure 5.
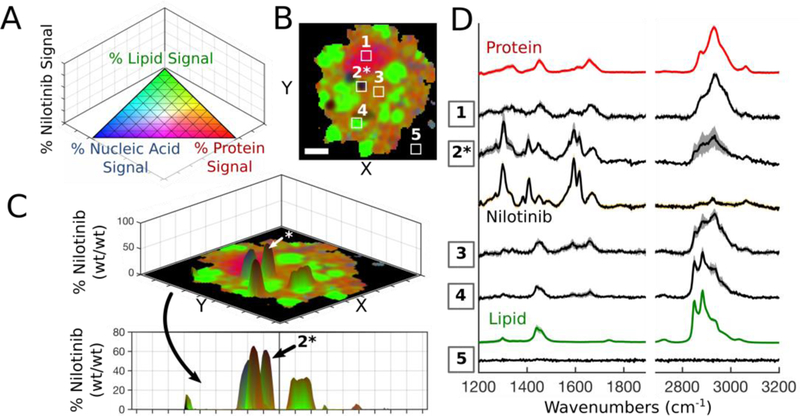
(A) 3D pseudo-color ternary scale with % nilotinib on z-axis; colors fade to black as % nilotinib approaches 100. (B) Compiled Raman image results for a single treated cell. (C) The relative nilotinib mass plotted on the z-axis of 3D surface plot. Scale bar: 5 μm. (D) Extracted average spectra (S.D. shown by shadow) from indicated regions of interest (panel B) overlaid with relevant reference spectra.
We then characterized the intracellular distribution patterns of chloroquine and etravirine accumulation in alveolar macrophages to show feasibility for quantitative chemical imaging of other compounds. Single-cell Raman images were acquired for cells from each treatment group and the datasets were algorithmically processed and interpreted using four-component regression modelling with respective drug reference spectra; the 3D pseudo-color scale was applied to each pixel of the processed datasets with the compound of interest plotted on the z-axis (Figure 6A, 6B, 7A, 7B) to visualize signal contributors. Utilizing stoichiometric calibration curves for chloroquine and etravirine (Figure S-6), the % drug signal was translated to relative mass (% wt/wt) for each pixel of the Raman images and 3D surface plots were generated to reveal the intracellular distribution of each compound. We detected chloroquine throughout the entire cell: nucleus and cytoplasm measured 10–15% (wt/wt), periphery regions of the cell were 15–20%, while the central lipid-rich region measured only 1–3% (Figure 6C). Representative spectra were extracted from regions of interest and overlaid to match the Raman signals throughout the cell with those of the reference components and verify spectral contributions from chloroquine (Figure 6D). In contrast to chloroquine behavior, etravirine was practically absent from the cellular nucleus (Figure 7C). The compound’s signal varied throughout the cytoplasm, with many regions showing clear spectral contribution while others, specifically near the cell periphery, yielded drug-free Raman spectra (Figure 7D). Note the characteristic etravirine Raman peak at 2220 cm−1, attributed to the compound’s dual nitrile groups, was clearly detectable within treated cells.
Figure 6.
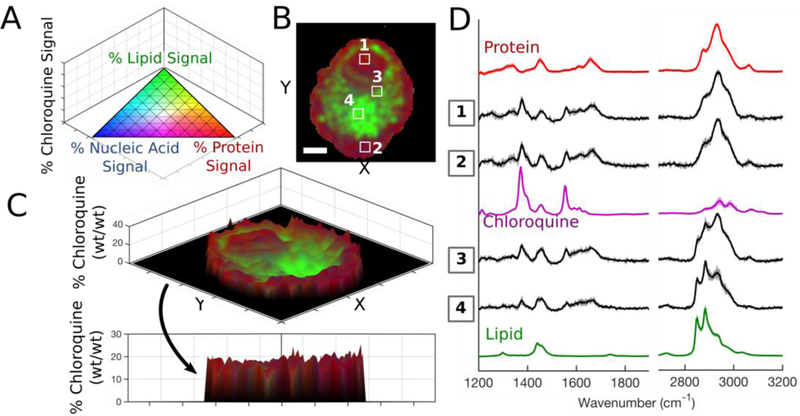
(A) 3D pseudo-color ternary scale with % chloroquine on z-axis; colors fade to black as % chloroquine approaches 100. (B) Compiled Raman image results for a single treated cell. (C) The relative chloroquine mass plotted on the z-axis of 3D surface plot. Scale bar: 5 μm. (D) Extracted average spectra (S.D. shown by shadow) from indicated regions of interest (panel B) overlaid with relevant reference spectra.
Figure 7.
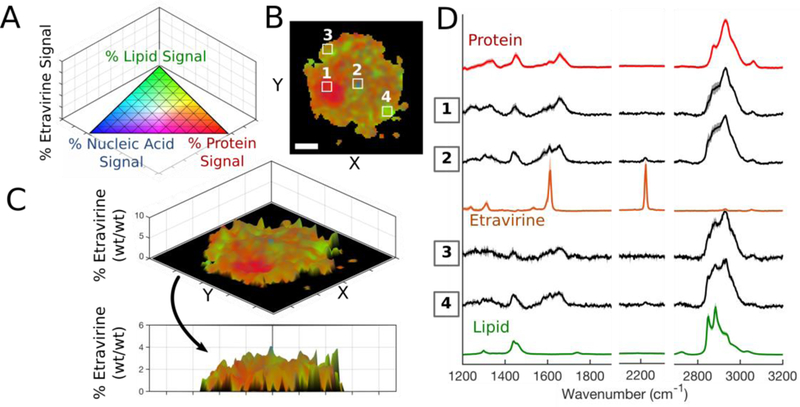
(A) 3D pseudo-color ternary scale with % etravirine on z-axis; colors fade to black as % etravirine approaches 100. (B) Compiled Raman image results for a single treated cell. (C) The relative etravirine mass was plotted on the z-axis of 3D surface plot. Scale bar: 5 μm. (D) Extracted average spectra (S.D. shown by shadow) from indicated regions of interest (panel B) overlaid with relevant reference spectra.
To the best of our knowledge, this study represents the first report of Raman-based measurements for quantitation of intracellular distribution of small molecule drugs in relation to the endogenous biomolecules of typical eukaryotic cells. Differential distribution behavior is attributable to the physicochemical properties of each drug compound. High logP (>3) of enabled drug partitioning into lipid membranes while the weakly basic amines of nilotinib and chloroquine also enabled lysosomal ion-trapping accumulation. The low solubility of nilotinib facilitated phase separation and self-aggregation from within the lysosomes, creating a solubility-equilibrium which greatly enhances intracellular accumulation. Our methodology offers a novel approach to quantitatively study intracellular drug accumulation and the corresponding phenotypic changes (i.e. phospholipid accumulation, “foam” cell formation, etc.) that are often associated with drug exposure and accumulation. Our results directly demonstrate the ability to monitor changes in the biochemical composition of alveolar macrophages that occur in response to drug exposure; more importantly, changes in the lipid and/or drug content of these cells have been heavily implicated in the pathogenesis of a multitude of lung injuries (i.e. drug exposure, idiopathic pulmonary fibrosis, etc.) for this cell population which can feasibly be obtained in the clinical setting.
CONCLUSION
This study presents the foundation for a robust sample preparation and microanalysis methodology for Raman-based characterization of alveolar macrophages, specifically in the context of intracellular drug accumulation. Herein, we have demonstrated the ability to distinguish subcellular compartments based on chemical composition and identify “foamy” lipid-laden macrophages throughout cell populations; regression modelling coupled with our novel quantitative calibration enabled direct Raman measurements of cellular drug accumulation and intracellular distribution. Although future technological advances will enable faster, more reliable measurements, our proposed methodology will remain relevant. The broader implications and future directions of this work surround the mysterious and poorly understood role of “foamy” lipid-laden macrophages in the pathogenesis of a multitude of diseases such as drug-induced phopsholipidosis and associated organ toxicity, idiopathic pulmonary fibrosis, and aspiration-induced lung injury including acute respiratory distress syndrome.(11, 41, 42) Direct quantitation of total lipid content per cell is the next logical step in method development and will facilitate elucidation of the mysterious interplay between the lipid-laden macrophage phenotype and health status of the individual, specifically in the context of drug exposure and accumulation. Since airway and alveolar macrophages are readily accessible in humans, we believe this cell population and our proposed methodology could provide a unique opportunity for the direct study of drug accumulation in patients, thereby enabling personalized therapies in the clinical setting. As humanity moves toward a future fraught with widespread drug use and greater overall exposure to xenobiotic small molecules, there exists an increasing need for the analysis of our absolute (bio)chemical composition in an effort to establish a reliable cytometric baseline profile for the idealized healthy individual.
Supplementary Material
ACKNOWLEDGEMENTS & DISCLOSURES
Financial support of NIH R01GM078200 to Gus R. Rosania and University of Michigan M-Cubed to Kathleen A. Stringer, Theodore J. Standiford, and Krishnan Raghavendran. We also thank Ashirvad Varma and Jason M. Albert for insight regarding Matlab data processing scripts. The authors declare the following competing interest(s): Dr. Gus R. Rosania is a consultant for Bristol-Myers Squibb.
REFERENCES
- 1.Fels AO, Cohn ZA. The alveolar macrophage. Journal of Applied Physiology. 1986;60(2):353–69. [DOI] [PubMed] [Google Scholar]
- 2.Hocking WG, Golde DW. The pulmonary-alveolar macrophage. New England Journal of Medicine. 1979;301(11):580–7. [DOI] [PubMed] [Google Scholar]
- 3.Hussell T, Bell TJ. Alveolar macrophages: plasticity in a tissue-specific context. Nat Rev Immunol. 2014;14(2):81–93. [DOI] [PubMed] [Google Scholar]
- 4.Fu D, Zhou J, Zhu WS, Manley PW, Wang YK, Hood T, et al. Imaging the intracellular distribution of tyrosine kinase inhibitors in living cells with quantitative hyperspectral stimulated Raman scattering. Nature chemistry. 2014;6(7):614–22. [DOI] [PMC free article] [PubMed] [Google Scholar]
- 5.Antonini JM, Reasor MJ. Accumulation of amiodarone and desethylamiodarone by rat alveolar macrophages in cell culture. Biochemical Pharmacology. 1991;42:S151–S6. [DOI] [PubMed] [Google Scholar]
- 6.Logan R, Kong AC, Krise JP. Time-Dependent Effects of Hydrophobic Amine-Containing Drugs on Lysosome Structure and Biogenesis in Cultured Human Fibroblasts. Journal of Pharmaceutical Sciences. 2014;103(10):3287–96. [DOI] [PubMed] [Google Scholar]
- 7.Kaufmann AM, Krise JP. Lysosomal sequestration of amine-containing drugs: Analysis and therapeutic implications. Journal of Pharmaceutical Sciences. 2007;96(4):729–46. [DOI] [PubMed] [Google Scholar]
- 8.Anderson N, Borlak J. Drug-induced phospholipidosis. FEBS Letters. 2006;580(23):5533–40. [DOI] [PubMed] [Google Scholar]
- 9.Halliwell WH. Cationic Amphiphilic Drug-Induced Phospholipidosis. Toxicologic Pathology. 1997;25(1):53–60. [DOI] [PubMed] [Google Scholar]
- 10.Zheng N, Zhang X, Rosania GR. Effect of phospholipidosis on the cellular pharmacokinetics of chloroquine. Journal of Pharmacology and Experimental Therapeutics. 2011;336(3):661–71. [DOI] [PMC free article] [PubMed] [Google Scholar]
- 11.Martin WJ, Standing JE. Amiodarone pulmonary toxicity: biochemical evidence for a cellular phospholipidosis in the bronchoalveolar lavage of human subjects. Journal of Pharmacology and Experimental Therapeutics. 1988;244(2):774–9. [PubMed] [Google Scholar]
- 12.Rzeczycki P, Yoon GS, Keswani RK, Sud S, Stringer KA, Rosania GR. Detecting ordered small molecule drug aggregates in live macrophages: a multi-parameter microscope image data acquisition and analysis strategy. Biomed Opt Express. 2017;8(2):860–72. [DOI] [PMC free article] [PubMed] [Google Scholar]
- 13.Sadrieh N The Regulatory Challenges of Drug-Induced Phospholipidosis - Presented in part at the FDA Advisory Committee for Pharmaceutical Science and Clinical Pharmacology meeting 2010. [Google Scholar]
- 14.Garg J, Agrawal N, Marballi A, Agrawal S, Rawat N, Sule S, et al. Amiodarone induced pulmonary toxicity: An unusual response to steroids. The American journal of case reports. 2012;13:62. [DOI] [PMC free article] [PubMed] [Google Scholar]
- 15.Yoneda KY, Hardin KA, Gandara DR, Shelton DK. Interstitial Lung Disease Associated with Epidermal Growth Factor Receptor Tyrosine Kinase Inhibitor Therapy in Non–Small-Cell Lung Carcinoma. Clinical Lung Cancer. 2006;8:S31–S5. [DOI] [PubMed] [Google Scholar]
- 16.Chatman LA, Morton D, Johnson TO, Anway SD. A Strategy for Risk Management of Drug-Induced Phospholipidosis. Toxicologic Pathology. 2009;37(7):997–1005. [DOI] [PubMed] [Google Scholar]
- 17.Reasor MJ, Hastings KL, Ulrich RG. Drug-induced phospholipidosis: issues and future directions. Expert opinion on drug safety. 2006;5(4):567–83. [DOI] [PubMed] [Google Scholar]
- 18.Reasor MJ, Kacew S. Drug-induced phospholipidosis: are there functional consequences? Experimental Biology and Medicine. 2001;226(9):825–30. [DOI] [PubMed] [Google Scholar]
- 19.Bocklitz TW, Guo S, Ryabchykov O, Vogler N, Popp J. Raman Based Molecular Imaging and Analytics: A Magic Bullet for Biomedical Applications!? Analytical Chemistry. 2016;88(1):133–51. [DOI] [PubMed] [Google Scholar]
- 20.Fu D, Lu F-K, Zhang X, Freudiger C, Pernik DR, Holtom G, et al. Quantitative chemical imaging with multiplex stimulated Raman scattering microscopy. Journal of the American Chemical Society. 2012;134(8):3623–6. [DOI] [PMC free article] [PubMed] [Google Scholar]
- 21.Hosokawa M, Ando M, Mukai S, Osada K, Yoshino T, Hamaguchi H-o, et al. In vivo live cell imaging for the quantitative monitoring of lipids by using Raman microspectroscopy. Analytical chemistry. 2014;86(16):8224–30. [DOI] [PubMed] [Google Scholar]
- 22.Ho S-H, Shimada R, Ren N-Q, Ozawa T. Rapid in vivo lipid/carbohydrate quantification of single microalgal cell by Raman spectral imaging to reveal salinity-induced starch-to-lipid shift. Biotechnology for biofuels. 2017;10(1):9. [DOI] [PMC free article] [PubMed] [Google Scholar]
- 23.Lu F-K, Basu S, Igras V, Hoang MP, Ji M, Fu D, et al. Label-free DNA imaging in vivo with stimulated Raman scattering microscopy. Proceedings of the National Academy of Sciences. 2015;112(37):11624–9. [DOI] [PMC free article] [PubMed] [Google Scholar]
- 24.Konorov SO, Schulze HG, Atkins CG, Piret JM, Aparicio SA, Turner RF, et al. Absolute quantification of intracellular glycogen content in human embryonic stem cells with Raman microspectroscopy. Analytical chemistry. 2011;83(16):6254–8. [DOI] [PubMed] [Google Scholar]
- 25.Stiebing C, Matthäus C, Krafft C, Keller A-A, Weber K, Lorkowski S, et al. Complexity of fatty acid distribution inside human macrophages on single cell level using Raman micro-spectroscopy. Analytical and bioanalytical chemistry. 2014;406(27):7037–46. [DOI] [PubMed] [Google Scholar]
- 26.Galler K, Requardt RP, Glaser U, Markwart R, Bocklitz T, Bauer M, et al. Single cell analysis in native tissue: Quantification of the retinoid content of hepatic stellate cells. Scientific reports. 2016;6. [DOI] [PMC free article] [PubMed] [Google Scholar]
- 27.El-Mashtoly SF, Petersen D, Yosef HK, Mosig A, Reinacher-Schick A, Kötting C, et al. Label-free imaging of drug distribution and metabolism in colon cancer cells by Raman microscopy. The Analyst. 2014;139(5):1155–61. [DOI] [PubMed] [Google Scholar]
- 28.Meister K, Niesel J, Schatzschneider U, Metzler-Nolte N, Schmidt DA, Havenith M Label‐Free Imaging of Metal–Carbonyl Complexes in Live Cells by Raman Microspectroscopy. Angewandte Chemie International Edition. 2010;49(19):3310–2. [DOI] [PubMed] [Google Scholar]
- 29.Ong YH, Lim M, Liu Q. Comparison of principal component analysis and biochemical component analysis in Raman spectroscopy for the discrimination of apoptosis and necrosis in K562 leukemia cells. Optics express. 2012;20(20):22158–71. [DOI] [PubMed] [Google Scholar]
- 30.Bergholt MS, Zheng W, Lin K, Ho KY, Teh M, Yeoh KG, et al. Characterizing variability in in vivo Raman spectra of different anatomical locations in the upper gastrointestinal tract toward cancer detection. BIOMEDO. 2011;16(3):037003−−10. [DOI] [PubMed] [Google Scholar]
- 31.Morita S-i, Takanezawa S, Hiroshima M, Mitsui T, Ozaki Y, Sako Y. Raman and Autofluorescence Spectrum Dynamics along the HRG-Induced Differentiation Pathway of MCF-7 Cells. Biophysical Journal. 2014;107(10):2221–9. [DOI] [PMC free article] [PubMed] [Google Scholar]
- 32.Ichimura T, Chiu L-d, Fujita K, Machiyama H, Kawata S, Watanabe TM, et al. Visualizing the appearance and disappearance of the attractor of differentiation using Raman spectral imaging. Scientific Reports. 2015;5:11358. [DOI] [PMC free article] [PubMed] [Google Scholar]
- 33.Hamada K, Fujita K, Smith NI, Kobayashi M, Inouye Y, Kawata S, editors. Raman microscopy for dynamic molecular imaging of living cells 2008: SPIE. [DOI] [PubMed] [Google Scholar]
- 34.Okada M, Smith NI, Palonpon AF, Endo H, Kawata S, Sodeoka M, et al. Label-free Raman observation of cytochrome c dynamics during apoptosis. Proceedings of the National Academy of Sciences. 2012;109(1):28–32. [DOI] [PMC free article] [PubMed] [Google Scholar]
- 35.Goerke J Pulmonary surfactant: functions and molecular composition. Biochimica et Biophysica Acta (BBA) - Molecular Basis of Disease. 1998;1408(2):79–89. [DOI] [PubMed] [Google Scholar]
- 36.Lodish H, Berk A, Zipursky SL, Matsudaira P, Baltimore D, Darnell J. Molecular cell biology 4th edition National Center for Biotechnology InformationÕs Bookshelf; 2000. [Google Scholar]
- 37.Ter Heine R, Mulder JW, Van Gorp ECM, Wagenaar JFP, Beijnen JH, Huitema ADR. Intracellular and plasma steady-state pharmacokinetics of raltegravir, darunavir, etravirine and ritonavir in heavily pre-treated HIV-infected patients. British Journal of Clinical Pharmacology. 2010;69(5):475–83. [DOI] [PMC free article] [PubMed] [Google Scholar]
- 38.Schie IW, Kiselev R, Krafft C, Popp J. Rapid acquisition of mean Raman spectra of eukaryotic cells for a robust single cell classification. Analyst. 2016;141(23):6387–95. [DOI] [PubMed] [Google Scholar]
- 39.Baik J, Stringer KA, Mane G, Rosania GR. Multiscale distribution and bioaccumulation analysis of clofazimine reveals a massive immune system-mediated xenobiotic sequestration response. Antimicrobial agents and chemotherapy. 2013;57(3):1218–30. [DOI] [PMC free article] [PubMed] [Google Scholar]
- 40.van Manen H-J, Kraan YM, Roos D, Otto C. Single-cell Raman and fluorescence microscopy reveal the association of lipid bodies with phagosomes in leukocytes. Proceedings of the National Academy of Sciences of the United States of America. 2005;102(29):10159–64. [DOI] [PMC free article] [PubMed] [Google Scholar]
- 41.Raghavendran K, Nemzek J, Napolitano LM, Knight PR. Aspiration-Induced lung injury. Critical care medicine. 2011;39(4):818–26. [DOI] [PMC free article] [PubMed] [Google Scholar]
- 42.Romero F, Shah D, Duong M, Penn RB, Fessler MB, Madenspacher J, et al. A Pneumocyte–Macrophage Paracrine Lipid Axis Drives the Lung toward Fibrosis. American Journal of Respiratory Cell and Molecular Biology. 2015;53(1):74–86. [DOI] [PMC free article] [PubMed] [Google Scholar]
Associated Data
This section collects any data citations, data availability statements, or supplementary materials included in this article.


