Abstract
Volta Phase Plate (VPP) has become an invaluable tool for cryo-EM structural determination of small protein complexes by increasing image contrast. Currently, the standard protocol of VPP usage periodically changes the VPP position to a fresh spot during data collection. Such a protocol was to target the phase shifts to a relatively narrow range (around 90°) based on the observations of increased phase shifts and image blur associated with more images taken with a single VPP position. Here, we report a 2.87 Å resolution structure of apoferritin reconstructed from a dataset collected using only a single position of VPP. The reconstruction resolution and map density features are nearly identical to the reconstruction from the control dataset collected with periodic change of VPP positions. Further experiments have verified that similar results, including a 2.5 Å resolution structure, could be obtained with a full range of phase shifts, different spots of variable phase shift increasing rates, and at different ages of the VPP post-installation. Furthermore, we have found that the phase shifts at low resolutions, probably related to the finite size of the Volta spots, could not be correctly modeled by current CTF model using a constant phase shift at all frequencies. In dataset III, severe beam tilt issue was identified but could be computationally corrected with iterative refinements. The observations in this study may provide new insights into further improvement of both the efficiency and robustness of VPP, and to help turn VPP into a plug-and-play device for high-resolution cryo-EM.
Keywords: cryo-EM, Volta phase plate, phase shift, beam tilt, near-atomic resolution, apoferritin
1. Introduction
Transmission electron microscope (TEM) images of biological samples are known to have low contrast due to the weak scattering of the electron beam. Traditionally, the phase contrast in TEM is realized by collecting under-focused images. A phase plate that can increase the image contrast has been a long-sought device in the cryo-EM field. While the physical principle of phase plates has been well-established since 1942 (Zernike, 1942) and its application to light microscopy succeeded quickly, the implementation for TEM has proven to be very difficult. Several different approaches, such as the Zernike phase plate with a small hole in a thin carbon film (Danev and Nagayama, 2001) and the Boersch phase plate with an electrostatic lens (Schultheiß et al., 2006), were explored to generate the 90° phase shift between the scattered and unscattered beam. However, these approaches were hampered by contaminations, short-lifetime spans, low resolutions, etc.
The Volta Phase Plate (VPP) (Danev et al., 2014) is the first phase plate design that has demonstrated both high-resolution and robustness, and it has quickly become a popular commercial product since its invention in 2014. It is also made of a thin layer of amorphous carbon but without a hole in the center. VPP utilizes the phase shifts to the central, unscattered beam based on the Volta potential of the spot on carbon film where the intense central beam passes. The mechanism of the Volta potential self-induced by the central beam has not been fully understood, although it was hypothesized to be caused by the beam-induced desorption of the water molecules from the carbon surface (Danev et al., 2014; Hettler et al., 2018). Despite the quick success of VPP as demonstrated by several near-atomic resolution structures solved using VPP data (Danev et al., 2017; Fan et al., 2017; Liang et al., 2017), it is also recognized that VPP is currently still challenging to set up and far from a plug-and-play device. Efforts are still being made to improve its performance and user experience.
The current VPP workflow changes VPP position periodically during image acquisition and limits the phase shifts to a relatively narrow range around 90°. Such a procedure was based on the observations of increased phase shifts associated with accumulating dose (Danev et al., 2014) and increased image blur associated with accumulating dose and phase shifts (Danev et al., 2017). Furthermore, the power-spectra based CTF fitting methods currently used in the cryo-EM field cannot distinguish a phase shift ϕ from ϕ+180°. Large phase shifts are thus considered undesirable for image collection and the procedure employing a periodic change of VPP position has been widely adopted. In this study, we investigated the correlations of phase shifts and image/3D reconstruction quality, with a varying number of movies imaged using a single VPP spot, to test if it is feasible to obtain high-resolution 3D reconstructions using a single VPP position. Surprisingly, these tests have consistently resulted in 3D reconstructions at near-atomic resolutions even with phase shifts larger than 180° and more than 400 movies taken using a single VPP position. This study may lead to a better understanding of VPP phase shifts and suggest the potential of using a single VPP position to image a large number of movies for more efficient data collection with VPP.
2. Material and Methods
2.1. Sample preparation and grid screening
The human ferritin light chain (FLT) was expressed in Escherichia coli, purified, and assembled into ferritin homopolymers (24-mers) as described previously (Baraibar et al., 2009). Protein concentration was determined with Bradford assay with bovine serum albumin (BSA) as a standard. The recombinant ferritin sample was incubated with 1% thioglycollic acid, pH 5.5, and 2,2’-bipyridine to remove iron. It was further dissolved in 100 mM Hepes buffer (pH 7.4) that was treated with Chelex ion exchange resin (Bio-Rad) to remove transition metals often found in aqueous buffers as contaminants. Subsequently, a 3 μl aliquot sample of 0.05 mg/ml concentration was applied to a holey UltraAufoil grid (R1.2/1.3, 300 mesh) (for dataset I, II and III) that was precoated with graphene oxide and 0.01% chitosan (Sigma). For dataset IV, Quantifoil holey carbon grid (R0.6/1, 400 mesh) coated with graphene oxide was used. Cryo-EM grids were prepared using a CP3 plunger (Gatan, CA, USA) with 80% humidity, ashless filter paper and blotting time 7–9 s. The cryo-grids were screened using a CM200 microscope or Talos F200 microscope.
2.2. Cryo-EM data collection
The grids prepared with the optimized freezing condition were then imaged using a Titan Krios electron microscope (Thermo Fisher Scientific) equipped with a VPP. The on-plane alignment of VPP was performed after correcting objective lens astigmatism and coma-free alignment. Images were recorded using a Gatan K2 Summit detector in super-resolution mode. The images were collected using Leginon software (Suloway et al., 2005) with a constant intended underfocus of 500 nm. To minimize the changing of objective lens current, eucentric Z-height was corrected once at SQ mode and twice at HL mode, then further corrected at each of the Focus node in Leginon. The magnifications were calibrated using the 2.13 Å resolution diffractions of graphene oxide substrate as the internal standard. Detailed imaging conditions for the four datasets are listed in Table 1. For dataset I and dataset II, every time after the VPP had advanced to a new position, the VPP was charged for 120 s to build up an initial phase shift of ~20 degrees. For dataset III and IV, precharging was not performed. All four datasets are available from the EMPIAR database (EMPIAR-10263).
Table1.
Refinement and model statistics
| Dataset I | Dataset II | Dataset III | Dataset IV | |
|---|---|---|---|---|
| Data Collection | ||||
| Voltage (kV) | 300 | 300 | 300 | 300 |
| Dose (e/Å2) | 35 | 35 | 30 | 30 |
| Nominal Magnification | 22,500 | 22,500 | 130,000 | 130,000 |
| Energy filter | − | − | + | + |
| VPP age post-installation (months) | 6 | 6 | 12 | 14 |
| # VPP Positions | 18 | 1 | 6 | 1 |
| # of Movies | 629 | 164 | 735 | 461 |
| Particles picked | 642,775 | 159,409 | 500,613 | 279,190 |
| Particles after 2D classification | 155,639 | 96,631 | 375,811 | 193,853 |
| Particles after 3D classification | 72,521 | 96,631 | 304,638 | 73,314 |
| Pixel Size (Å) | 0.658 | 0.658 | 0.535 | 0.535 |
| Intended Defocus (μm) | 0.5 | 0.5 | 0.5 | 0.5 |
| Beam size (μm) | 0.966 | 0.966 | 0.931 | 0.801 |
| Electric charge per movie (nC) | 0.41 | 0.41 | 0.33 | 0.24 |
| Refinement | ||||
| Resolution (Å) | 2.94 | 2.87 | 2.51 | 2.93 |
| Map CC | 0.82 | 0.79 | 0.80 | 0.79 |
| All-atom clashscore | 3.97 | 3.61 | 3.47 | 2.31 |
| Rotamer outliers (%) | 2.05 | 2.05 | 0 | 0.72 |
| Ramachandran plot | ||||
| Favored (%) | 95.71 | 95.71 | 100 | 99.35 |
| Outliers (%) | 0 | 0 | 0 | 0 |
Dataset I and II:
The datasets I and II were collected using the same imaging condition and the same sample grid except that the VPP position was set to change every 30 movies in dataset I, while the VPP position remained the same in dataset II. Both datasets were imaged about six months after the installation of the VPP.
Dataset III and IV:
These datasets were collected in two separate sessions, after about six and eight months respectively after datasets I and II using the same Titan Krios electron microscope but with the K2 camera now mounted on a GIF Quantum LS Imaging Filter with 20 eV slit width and the nominal mag at 130k. Dataset III was collected with the VPP position changed every 90 to 144 movies. All 461 movies in dataset IV were collected with a single VPP position.
2.3. Image processing
Dataset I:
The 629 raw movies were aligned and dose-weighted with Motioncor2/1.0.5 (Zheng et al., 2017). Subsequently, Gctf-v1.18 (Zhang, 2016) and CTFFIND4 (Rohou and Grigorieff, 2015) were used to determine the CTF parameters using the movie averages without dose weighting. Figure S1A shows the CTFFIND4 estimated phase shift and maximum resolution of each micrographs. 642,775 particles were selected with RELION/2.1 autopicking (Scheres, 2012). After the first round of 2D classification, 328,691 particles were retained. Another round of 2D classification was applied to remove more junk particles with 155,639 good particles selected. 72,521 particles were retained after 3D classification and were used in the final reconstruction. The number of particles in different phase shift ranges before and after 2D/3D classification are shown in Figure S2A. The RELION/2.1 result at 3 Å was further refined to 2.9 Å using JSPR (Guo and Jiang, 2013) that includes refinement of defocus, astigmatism, beam tilt, magnification, and magnification distortion (Liu et al., 2016; Yu et al., 2016).
A subset of 164 micrographs with phase shift in the range of 72 to 108 degree were selected as the “around 90 subset” from the dataset I. After 2D classification, 102,353 of 131,689 particles were retained. 71,732 particles in the class with correct ferritin structure were selected after 3D classification and were used in the final reconstruction. The RELION/2.1 refined result at 3.2 Å resolution was further refined to 2.94 Å using JSPR.
A random subset of 164 micrographs were also selected from dataset I. The total number of particles after autopicking was 136,697. After 2D classification, 106,718 particles were retained. 89,376 particles in the 3D class with correct structure were refined to 3.33 Å with RELION/2.1 and further refined to 2.9 Å with JSPR.
Dataset II:
The image processing procedures of the dataset II are the same as that for the dataset I. The difference is that dataset II has 164 movies from which 159,409 particles were auto-picked using RELION/2.1. After two rounds of 2D classification in RELION/2.1, 96,631 particles were retained. After 3D classification, all the 3D classes contain the correct structure. Thus, all of the 96,631 particles were further refined to 3.27 Å resolution with RELION/2.1. The same set of particles were further refined to 2.87 Å with JSPR. In the second round of image processing with bin-2 particles, the total number of 142,079 particles were subjected to two rounds of 2D classification which resulted in 110,347 particles in retained classes. After 3D classification, the two classes with the correct structure were combined (90,813 particles) and refined to 3.3 Å with Relion/2.1 and further refined to 2.88 Å with JSPR (Fig. S3).
Dataset III:
After aligning the movies with Motioncor2/1.0.5, the dose-weighted movie averages were imported to cisTEM (Grant eFt al., 2018) to perform CTF fitting using CTFFIND4. 500,613 particles were automatically picked. After two rounds of 2D classification in cisTEM, 375,811 particles were retained and exported to RELION/2.1 for 3D classification. Two classes of 304,638 particles with correct structure were selected and refined to ~6 Å with RELION/2.1. The Fourier shell correlation (FSC) curve showed severe CTF artifacts that was later found to be caused by a large degree of beam tilt. After refining beam tilt and other parameters using JSPR, the final resolution was significantly improved to 2.51 Å.
Dataset IV:
The motion correction and CTF estimation were performed with Motioncor2 and CTFFIND4 respectively. To correct the 180° errors of phase shift assignments for the second half of the 461 movies taken using a single VPP spot when the phase shifts have increased beyond 180 degree, we manually added 180° to the CTFFIND4 determined values of these micrographs to unwrap the phase shifts. 279,190 particles were selected and then subjected to 2D classification using cryoSPARC/v2 (Punjani et al., 2017). A total of 79,226 particles was then exported to RELION/3.0 for 3D classification and auto-refinement that resulted in 4.25 Å resolution. After JSPR refinement, the reconstruction was improved to 3.12 Å resolution. We then reprocessed this dataset by high-pass filtering all the particles at 90 Å using EMAN2 (Tang et al., 2007) e2proc2d.py and the filter.highpass.gauss processor. The 2D and 3D classification steps were repeated for the high-pass filtered particles in RELION/3.0. 193,853 particles were retained after 2D classification of high-pass filtered particles. Using 73,314 particles retained after 3D classification, we got 3.94 Å resolution with RELION 3D autorefine which was then improved to 2.93 Å resolution with JSPR refinement.
2.4. Model refinement
The initial atomic model of FTL PDB: 2ffx (Wang et al., 2006) was fitted into the cryo-EM maps using Chimera (Pettersen et al., 2004) and refined using Phenix real space refinement (Afonine et al., 2012). The phenix.mtriage program was used to calculate the FSC of the atomic model and the density maps. All maps and models were displayed with Chimera.
3. Results
3.1. A single position of Volta phase plate is able to acquire enough data for high-resolution reconstruction
Here we used the apoferritin particles as the test sample for all the datasets presented in this paper (Table 1). Dataset I of 629 movies was collected with VPP advanced to a new spot after every 30 movies, while dataset II of 164 movies only used a single spot on VPP. Since the two datasets were imaged with the same sample grid in the same image condition, the particle distribution and particle density are about the same for the two datasets. Using the same single particle reconstruction procedure, the dataset II and the dataset I both produced a 3D reconstruction at ~2.9 Å resolution.
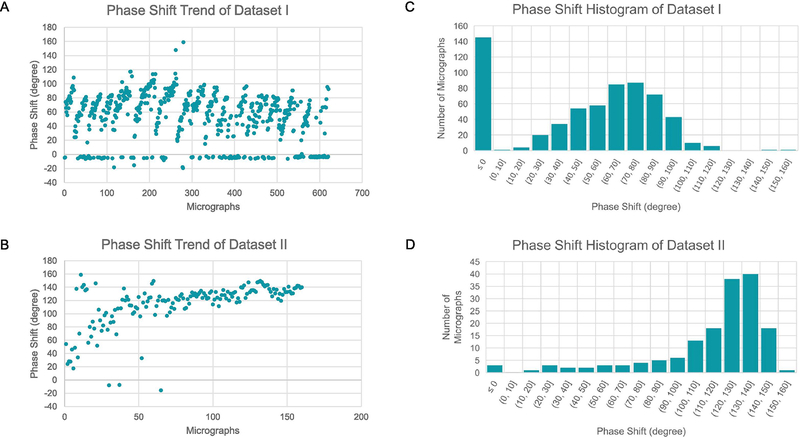
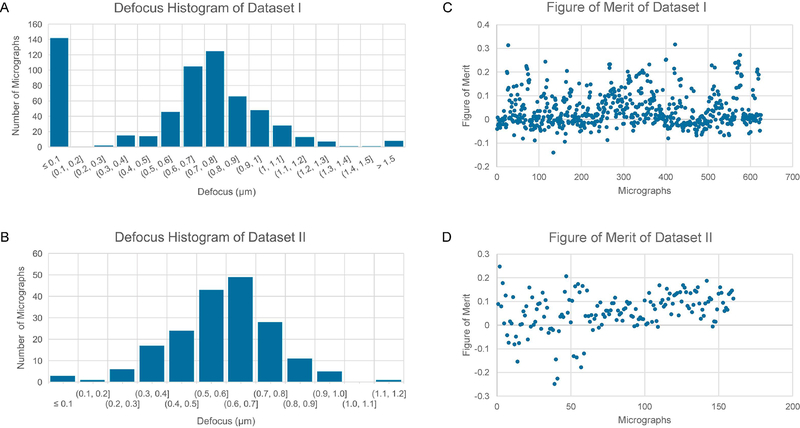
The trajectory of Gctf-measured phase shifts as a function of time in dataset I is shown in Figure 1A. Since the VPP was programed to advance to a new position after collecting 30 movies, a large number of cycles of phase shift increments were observed. In contrast, the phase shifts of dataset II show a very different trajectory (Fig. 1B). The phase shifts kept increasing with two regions of different slopes. The trajectory began with a fast increase region until the phase shifts have reached ~110 degrees and then the phase shifts increased at a much reduced rate. Such a biphasic increase is consistent with previous observations (Danev et al., 2014). The phase shift histograms clearly showed the dramatically different distributions of phase shifts of these two datasets. While the phase shifts are mostly less than 110 degrees for the dataset I (Fig. 1C), the phase shifts of dataset II are dominated by a peak around 130 degrees (Fig. 1D), a range that is not recommended by the standard VPP protocol. The histograms of defocus distributions of both datasets are shown in Figure 2A,B. It is obvious that the two distributions are similar with both having a peak at ~0.6–0.7 μm defocus although the histogram of dataset II is skewed to larger defocuses (Fig. 2B) compared to that of dataset I (Fig. 2A). The CTFFIND4-estimated figure of merit distribution of the two datasets are presented in Fig. 2C and Fig. 2D. Dataset II has a comparable mean value and the spread of figure of merit values as those of dataset I.
Figure 1. Statistics of phase shifts.
(A,B) The time-course of GCTF-determined phase shifts for dataset I (A) and dataset II (B). (C,D) The phase shift distribution of the micrographs of dataset I (C) and dataset II (D).
Figure 2. Statistics of defocuses.
(A, B) The defocus distribution of dataset I (A) and dataset II (B). (C,D) The CTFFIND4-measured figure of merit distribution of dataset I (C) and dataset II (D).
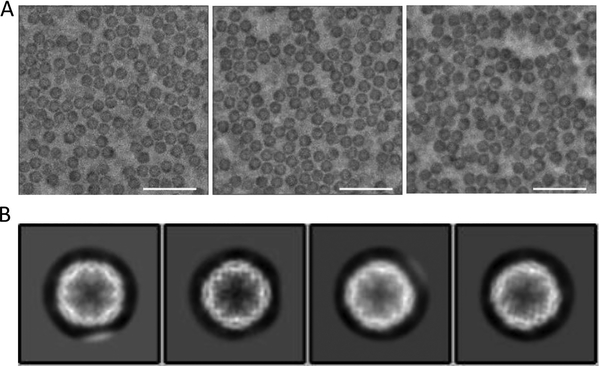
Large phase shifts caused by large accumulated dose on one VPP spot were previously found to strongly correlate with increased CTF artifacts and increased image blur (Danev et al., 2017). However, such an effect was not obvious for the micrographs in dataset II. The micrographs with phase shifts ranging from 72 to 144 degrees have comparable visual quality (Fig. 3A). The 2D class averages of the particles showed fine structural features (Fig. 3B). Since image “blur” is rather subjective, we used the high-resolution limit reported by CTF fitting to quantitatively represent image blur - lower resolution limit means more blurring (Fig. S1). From the plot of the CTFFIND4-determined maximum resolution as a function of the phase shift of dataset II (Fig. S1B), except for a small number of outliers probably due to fitting errors, there was no obvious correlation between image blur and increased phase shifts.
Figure 3. 2D and 3D classification results of the dataset II.
(A) Representative micrographs with phase shift of 72, 99 and 144 degree, and the same defocus (0.5 μm). The scale bar represents 500 nm in length. (B) 2D class averages showing clear structural features.
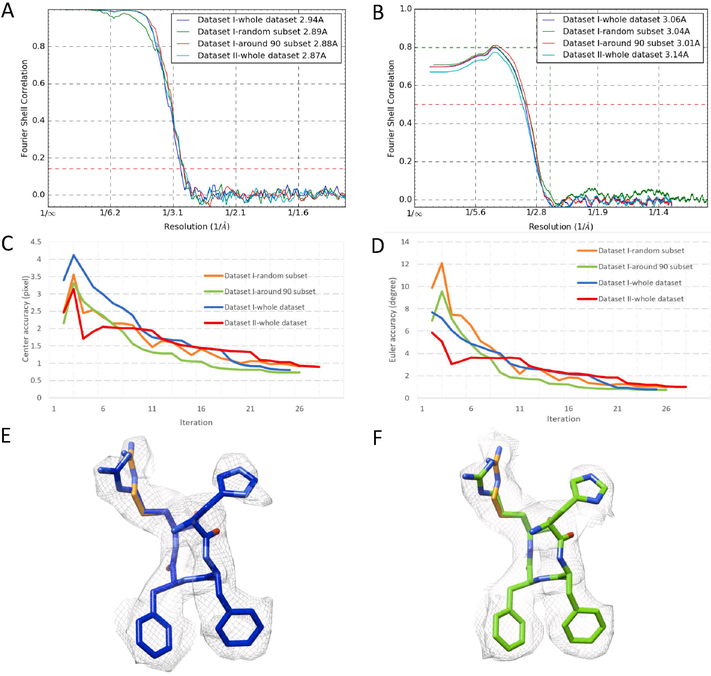
The reconstruction of dataset II reached a resolution of 2.85 Å according to the “gold-standard” Fourier shell correlation (FSC) 0.143 criterion (Fig. 4A), essentially the same as that of dataset I (Fig. 4A). Both the random subset and around 90 degree phase shift subset of dataset I also reached similar resolution of that of the whole dataset I (Fig. 4A). The density maps of both datasets are also very consistent as shown by the FSC of the atomic model and the four maps (Fig. 4B). The RELION-estimated accuracies of the center positions and euler angles of the different datasets in each iteration were plotted in Fig. 4C and 4D, respectively. Dataset II thus has similar quality with dataset I according to the FSC curves and the euler angle/position accuracy profile through the iterations. In the close-up view of the densities, the side-chains were clearly resolved and the atomic model visually fits well in the densities of both datasets (Fig. 4E,F). The high quality of the density maps is also indicated by the validation statistics of the atomic models derived from the maps (Table 1).
Figure 4. Comparison of the 3D structures reconstructed from dataset I and dataset II.
(A) Noise-substitution corrected FSC curves of the dataset I and the dataset II. (B) The phenix.mtriage calculated model-map FSC curve of the three maps of dataset I and the map of dataset II. (C,D) The estimated accuracy of center (C) and Euler angles positions (D) in each iteration of 3D refinements reported by RELION/2.0. (E,F) Close-up view of the densities and the atomic model of the an alpha-helical segment (a.a. 53–56) for dataset I (E) and dataset II (F).
3.2. Particles with phase shifts in the full range have similar quality
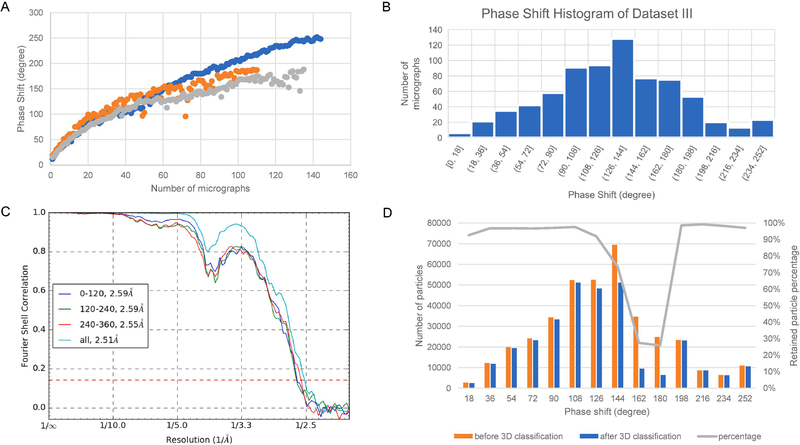
As the VPP was installed in the microscope only for about six months when datasets I and II were collected, we thus collected more datasets after an additional six to eight months to probe the variability of VPP and test if the results of datasets I and II could be reproduced. Figure 5A shows the phase shift trends of three of the six Volta spots included in dataset III. It is apparent that different Volta spots have different phase shift increasing rates, which is probably due to the intrinsic randomness of Volta potential generation process. The phase shift increasing rates are also much larger than the rates of datasets I and II and lack the clear biphasic profile seen in dataset II, which suggests that the age and/or the column environment can significantly influence the VPP and cause the variability from spot to spot and time tot time. The phase shift histogram (Fig. 5B) shows that dataset III has micrographs in the phase shift range of 0–250 degrees with the peak at 126–144 degrees. We could obtain a 3D reconstruction at 2.51 Å resolution using dataset III (Fig. 5C) after overcoming an unusual level of beam tilt issues (discussed below). To further investigate the relationship of phase shift and image quality, we divided the refined particles of dataset III into three subsets based on the JSPR-refined phase shift values: 0–120, 120–240, 240–360 degrees. The latter contains the least number of particles of 6,719. To ensure fair comparison, we randomly selected 6,719 particles from the first two ranges as the representative subsets of these phase shift ranges. The refinement results of the three subsets of particles (Fig. 5C) showed that all three subsets could be refined to similar resolutions, 2.59 Å for 0–120, 2.59 Å for 120–240, and 2.55 Å for 240–360 degree phase shifts. There is no systematic quality difference for either of these phase shift ranges.
Figure 5. Image processing results of dataset III.
(A) The time-courses of phase shifts of three different Volta phase plate spots showing different phase shift increment rates. (B) The phase shift histogram of dataset III determined by CTFFIND4. (C) The FSC curve of the half maps reconstructed with all particles and with particles in the phase shift range of 0–120, 120–240 and 240–360 degree. (D) The distribution of the number of particles before and after 3D classification using RELION and the percentage of retained particles after 3D classification as a function of phase shift.
The fraction of retained particles after 3D classification was shown in Fig. 5D for the entire range of phase shifts. Except for the particles in the phase shift range of 160–180 degree, most particles in all other phase shift ranges were retained (>80%). Similar particle retention ratios were also observed for 2D classification of the particles (Fig. S2C). We suspect that the drop in the 160–180 degree range was due to the low image phase contrast as the image condition for phase shifts in this range is essentially equivalent to VPP-free condition and the low resolution signals important for 2D alignment have been suppressed by the CTF.
3.3. Computational refinement and correction of beam tilt
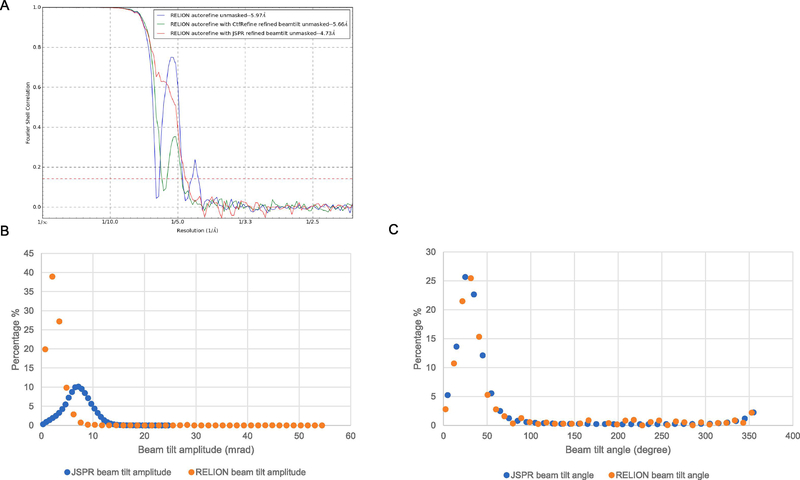
Due to unknown reason(s), there was a large amount of beam tilt in dataset III. After RELION/2.1 3D autorefine, two strong oscillations were seen in the FSC curve (blue curve in Fig. 6A) of the unmasked maps, which indicates severe CTF artifacts. To identify the source of such CTF artifacts, we used JSPR (Guo and Jiang, 2013; Liu et al., 2016) to refine multiple parameters individually including defocus, astigmatism, beam tilt, magnification and distortion, and eventually found that beam tilt was the major cause. After iterative refinements using JSPR, the FSC oscillations were significantly reduced and the resolution was improved to ~2.5 Å (Fig. 5C). After the release of RELION/3-beta, we also used its CtfRefine function to refine beam tilt, astigmatism, phase shift (per micrograph) and defocus (per particle). Although the refinement could noticeably reduce the FSC oscillations (green curve in Fig. 6A), the remaining strong oscillation in the FSC curve suggests that the beam tilt effects were only partially corrected. Comparing the refined beam tilt parameters generated by JSPR and RELION/3-beta, the tilt angles are very consistent (Fig. 6C) but the tilt magnitudes are different by about 3-fold (Fig. 6B). By replacing the RELION beam tilt parameters with that of JSPR, the FSC was improved and the remaining FSC oscillation could be eliminated (red curve in Fig. 6A).
Figure 6. Beamtilt refinement results of dataset III.
(A) The FSC of unmasked maps reconstructed using the parameters of RELION/2.1 3D autorefine job (blue), RELION/3 CtfRefine job output star file (green), and the RELION/3 CtfRefine job output star file with beam tilt parameters replaced by JSPR refined beam tilt parameters (red). The dataset III was first refined with RELION/3 3D autorefine, which was limited to ~6 Å resolution based on the unmasked map FSC (blue). After running CtfRefine with one beam tilt group per micrograph in RELION/3, relion_reconstruct_mpi was used to reconstruct the half maps respectively (green). The rlnBeamTiltX and rlnBeamTiltY value of all particles were then replaced by the JSPR refined beam tilt parameters and half maps were reconstructed with relion_reconstruct_mpi (red). (B,C) Comparison of the beam tilt magnitudes (B) and angles (C) estimated by JSPR and RELION/3.
3.4. Incomplete CTF model for VPP at low resolutions
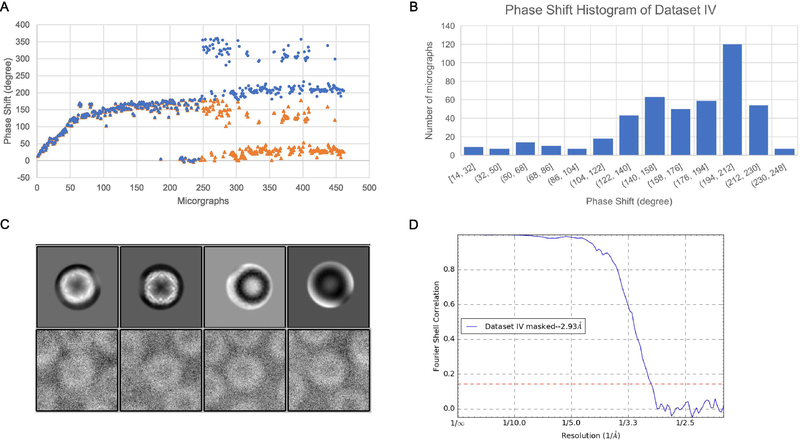
Although dataset II has already shown that a single VPP position allows sufficient amount of images for near-atomic resolution 3D reconstructions, the number (164) of images in dataset II was still relatively small. Dataset IV was thus collected to test if a much larger number (461) of images using a single VPP position can still allow high-resolution 3D reconstructions. Fig. 7A shows the phase shift profile of dataset IV with two regions (orange triangle). The first region is very similar to dataset II which has a biphasic profile. The second region with the phase shift larger than 180 degree were assigned to a value in the range of 0–180 degree by CTFFIND4. By adding 180 degree to the phase shifts in this region, we are able to unwrap the phase shift to the range of 0 to 360 degree (blue dots). We noticed that some data points do not follow the phase increasing trend, due to failed CTF fitting based on visual inspection of the power spectra of the micrograph and the power spectra computed with fitted CTF parameters. The incorrect CTF fitting was likely due to the lack of sufficient number of visible Thon rings for images of small defocuses. Although about half of the images had phase shifts larger than 180 degrees (Fig. 7A) and the phase shift distribution has a peak at 194–212 degrees (Fig. 7B), this dataset still allows high-resolution reconstruction at around 2.93 Å resolution (Fig. 7D).
Figure 7. Image processing results of dataset IV.
(A) The time-course of phase shifts determined by CTFFIND4 (orange triangles) and after manually adding 180 degree to the later micrographs (blue dots). (B) The phase shift histogram of dataset IV. (C) The white and black classes in the 2D classification results of dataset IV (top row) and representative particles in the black classes (bottom row). (D) The FSC curve for masked half maps.
During the image processing of dataset IV, we were initially puzzled by the observation of black classes in the 2D classification result of RELION/3.0 (Fig. 7C top row). However, the particles in the black classes all have white protein density (Fig. 7C bottom row) but their phase shifts are larger than 180 degrees. Based on our understanding of the current CTF model, a contrast inversion is expected for the particles with phase shifts in the range of 180–360 degrees. On the contrary, we didn’t observe such contrast inversion in the experimental data. It indicates that there is inconsistency between the current CTF model and the behaviour of images collected. Therefore, we began to realize that, when the Volta spot on the phase plate is not infinitely small, the phase shift at different spatial frequencies can be different as has been previously described (Danev et al., 2017) and the phase shifts at low resolutions should be smaller than 180 degrees as suggested by the lack of contrast inversion in the images. Such an understanding is corroborated by the observations of negative FSC at low resolutions of the maps reconstructed from the particles of phase shift larger than 180 degree and the particles with phase shifts less than 180 degree and the transition from negative to positive FSC at ~90 Å resolution for both dataset III (Fig. S4A) and dataset IV (Fig. S4B).
Discussion
In this work, we studied if a Volta phase plate position is intrinsically limited to a small number of images (a few tens) and a narrow range of phase shifts (around 90 degrees). By acquiring four datasets with different strategies of changing VPP positions, varying number of images for a single position, and across more than six months’ time period, we have shown that it is feasible to image a large number of images (>400) with full range of phase shifts (>180 degrees) using a single VPP position to obtain 3 Å and better resolution 3D reconstructions, and such results are reproducible despite noticeable variations among different VPP positions and different time periods.
Datasets I and II were collected with the same sample grid and imaging condition but with different VPP imaging strategies. Imaging on a single spot of VPP allowed us to collect enough data (dataset II) for high resolution structure determination. The apoferritin structure at 2.85 Å resolution obtained with dataset II is nearly identical to the structure reconstructed from the control (dataset I). This success with a single VPP position was initially surprising as it is at odds with the current understanding of VPP and the recommended data collection strategy involving VPP.
Datasets III and IV, which were collected more than six months later, further demonstrated that the “surprising” results of dataset II obtaining high-resolution 3D reconstruction from a large number of images with a wide range of phase shifts acquired using a single VPP position were indeed a reproducible outcome of VPP. Furthermore, the comparable resolutions achieved from equal number of particles in the three different phase shift ranges indicated that the increase of phase shift does not necessarily lead to the decrease of image quality.
Nevertheless, a large number of images using a single VPP position did result in particles of full range (>180 degrees) of phase shifts that require some modifications of the image processing tasks to address the shortcoming of current image processing methods. Current power spectrum-based CTF estimation methods cannot distinguish the phase shifts with 180 degree differences. However, the time-course of the phase shifts provides sufficient information to allow us to manually add 180 degrees to the fitted phase shift values of the later images and to obtain correct phase shifts. In the future, the CTF fitting methods should consider the time-course information and automatically detect and correct the 180 degree ambiguity. Furthermore, by posing the phase shift determination task as a generalized 2D alignment task similar to the refinement of Euler angles, defocus, beam tilt, etc. and using projection matching as implemented in JSPR (Guo and Jiang, 2013), the power-spectra based estimates of the phase shifts can be further refined to improve the reconstructions. Currently, the CTF model considers uniform phase shifts across the entire resolution range. However, our data with phase shifts larger than 180 degrees have indicated that the phase shifts in the low resolution range should be smaller. An analytic form or computationally optimized approximation of the resolution-dependent phase shifts should be developed in future studies to help reduce the associated adverse effects from the inaccurate phase shifts at low resolutions and improve the resolution of the 3D reconstruction.
We hope that the results in this study may provide new insights into further improvement of both efficiency and robustness of VPP, and to help turn VPP into a plug-and-play device for high resolution cryo-EM.
Supplementary Material
Figure S1. The CTFFIND4 estimated phase shift and maximum resolution of each micrograph of the four datasets.
Figure S2. The 2D and 3D classification retained particle percentage of the four datasets. The number of particles in different phase shift bins before 2D classification, after 2D classification, and after 3D classification are represented by the blue, orange and grey bars respectively. The retained particle percentages after 2D classification and 3D classification are shown as the yellow and blue lines respectively. The 2D and 3D classification plot for dataset II used the particle numbers of the second round of processing.
Figure S3. The FSC between the JSPR refined half maps of the second round reconstruction of dataset II.
Figure S4. The FSC between the full unmasked maps reconstructed from 0–120 degree phase shift particles and 180–360 degree phase shift particles in dataset III (A) and dataset IV (B) showing the negative FSC at low resolutions.
Acknowledgement
This work was supported in part by grants from NIGMS U24 GM116789 (W.J.), NIAID R01 AI111095 (W.J.), NINDS 1U01NS110437 (W.J. and R.V.), and NINDS R01 NS050227 (R.V.). We thank the Purdue Cryo-EM Facility (http://cryoem.bio.purdue.edu) for the use of the Titan Krios microscope.
Footnotes
Publisher's Disclaimer: This is a PDF file of an unedited manuscript that has been accepted for publication. As a service to our customers we are providing this early version of the manuscript. The manuscript will undergo copyediting, typesetting, and review of the resulting proof before it is published in its final citable form. Please note that during the production process errors may be discovered which could affect the content, and all legal disclaimers that apply to the journal pertain.
References
- Afonine PV, Grosse-Kunstleve RW, Echols N, Headd JJ, Moriarty NW, Mustyakimov M, Terwilliger TC, Urzhumtsev A, Zwart PH, Adams PD, 2012. Towards automated crystallographic structure refinement with phenix.refine. Acta Crystallogr. D Biol. Crystallogr 68, 352–367. [DOI] [PMC free article] [PubMed] [Google Scholar]
- Baraibar MA, Muhoberac BB, Garringer HJ, Hurley TD, Vidal R, 2009. Unraveling of the E-helices and Disruption of 4-Fold Pores Are Associated with Iron Mishandling in a Mutant Ferritin Causing Neurodegeneration. J. Biol. Chem 285, 1950–1956. [DOI] [PMC free article] [PubMed] [Google Scholar]
- Danev R, Buijsse B, Khoshouei M, Plitzko JM, Baumeister W, 2014. Volta potential phase plate for in-focus phase contrast transmission electron microscopy. Proc. Natl. Acad. Sci. U. S. A 111, 15635–15640. [DOI] [PMC free article] [PubMed] [Google Scholar]
- Danev R, Nagayama K, 2001. Transmission electron microscopy with Zernike phase plate. Ultramicroscopy 88, 243–252. [DOI] [PubMed] [Google Scholar]
- Danev R, Tegunov D, Baumeister W, 2017. Using the Volta phase plate with defocus for cryo-EM single particle analysis. Elife 6 10.7554/eLife.23006 [DOI] [PMC free article] [PubMed] [Google Scholar]
- Fan X, Zhao L, Liu C, Zhang J-C, Fan K, Yan X, Peng H-L, Lei J, Wang H-W, 2017. Near-Atomic Resolution Structure Determination in Over-Focus with Volta Phase Plate by Cs-Corrected Cryo-EM. Structure 25, 1623–1630.e3. [DOI] [PubMed] [Google Scholar]
- Grant T, Rohou A, Grigorieff N, 2018. cisTEM: User-friendly software for single-particle image processing. 10.1101/257618 [DOI] [PMC free article] [PubMed]
- Guo F, Jiang W, 2013. Single Particle Cryo-electron Microscopy and 3-D Reconstruction of Viruses, in: Methods in Molecular Biology. pp. 401–443. [DOI] [PMC free article] [PubMed] [Google Scholar]
- Hettler S, Kano E, Dries M, Gerthsen D, Pfaffmann L, Bruns M, Beleggia M, Malac M, 2018. Charging of carbon thin films in scanning and phase-plate transmission electron microscopy. Ultramicroscopy 184, 252–266. [DOI] [PubMed] [Google Scholar]
- Liang Y-L, Khoshouei M, Radjainia M, Zhang Y, Glukhova A, Tarrasch J, Thal DM, Furness SGB, Christopoulos G, Coudrat T, Danev R, Baumeister W, Miller LJ, Christopoulos A, Kobilka BK, Wootten D, Skiniotis G, Sexton PM, 2017. Phase-plate cryo-EM structure of a class B GPCR–G-protein complex. Nature 546, 118–123. [DOI] [PMC free article] [PubMed] [Google Scholar]
- Liu Z, Guo F, Wang F, Li T-C, Jiang W, 2016. 2.9 Å Resolution Cryo-EM 3D Reconstruction of Close-Packed Virus Particles. Structure 24, 319–328. [DOI] [PMC free article] [PubMed] [Google Scholar]
- Pettersen EF, Goddard TD, Huang CC, Couch GS, Greenblatt DM, Meng EC, Ferrin TE, 2004. UCSF Chimera--A visualization system for exploratory research and analysis. J. Comput. Chem 25, 1605–1612. [DOI] [PubMed] [Google Scholar]
- Punjani A, Rubinstein JL, Fleet DJ, Brubaker MA, 2017. cryoSPARC: algorithms for rapid unsupervised cryo-EM structure determination. Nat. Methods 14, 290–296. [DOI] [PubMed] [Google Scholar]
- Rohou A, Grigorieff N, 2015. CTFFIND4: Fast and accurate defocus estimation from electron micrographs. J. Struct. Biol 192, 216–221. [DOI] [PMC free article] [PubMed] [Google Scholar]
- Scheres SHW, 2012. RELION: implementation of a Bayesian approach to cryo-EM structure determination. J. Struct. Biol 180, 519–530. [DOI] [PMC free article] [PubMed] [Google Scholar]
- Schultheiß K, Pérez-Willard F, Barton B, Gerthsen D, Schröder RR, 2006. Fabrication of a Boersch phase plate for phase contrast imaging in a transmission electron microscope. Rev. Sci. Instrum 77, 033701. [Google Scholar]
- Suloway C, Pulokas J, Fellmann D, Cheng A, Guerra F, Quispe J, Stagg S, Potter CS, Carragher B, 2005. Automated molecular microscopy: the new Leginon system. J. Struct. Biol 151, 41–60. [DOI] [PubMed] [Google Scholar]
- Tang G, Peng L, Baldwin PR, Mann DS, Jiang W, Rees I, Ludtke SJ, 2007. EMAN2: an extensible image processing suite for electron microscopy. J. Struct. Biol 157, 38–46. [DOI] [PubMed] [Google Scholar]
- Wang Z, Li C, Ellenburg M, Soistman E, Ruble J, Wright B, Ho JX, Carter DC, 2006. Structure of human ferritin L chain. Acta Crystallogr. D Biol. Crystallogr 62, 800–806. [DOI] [PubMed] [Google Scholar]
- Yu G, Li K, Liu Y, Chen Z, Wang Z, Yan R, Klose T, Tang L, Jiang W, 2016. An algorithm for estimation and correction of anisotropic magnification distortion of cryo-EM images without need of pre-calibration. J. Struct. Biol 195, 207–215. [DOI] [PMC free article] [PubMed] [Google Scholar]
- Zernike F, 1942. Phase contrast, a new method for the microscopic observation of transparent objects. Physica 9, 686–698. [Google Scholar]
- Zhang K, 2016. Gctf: Real-time CTF determination and correction. J. Struct. Biol 193, 1–12. [DOI] [PMC free article] [PubMed] [Google Scholar]
- Zheng SQ, Palovcak E, Armache J-P, Verba KA, Cheng Y, Agard DA, 2017. MotionCor2: anisotropic correction of beam-induced motion for improved cryo-electron microscopy. Nat. Methods 14, 331–332. [DOI] [PMC free article] [PubMed] [Google Scholar]
Associated Data
This section collects any data citations, data availability statements, or supplementary materials included in this article.
Supplementary Materials
Figure S1. The CTFFIND4 estimated phase shift and maximum resolution of each micrograph of the four datasets.
Figure S2. The 2D and 3D classification retained particle percentage of the four datasets. The number of particles in different phase shift bins before 2D classification, after 2D classification, and after 3D classification are represented by the blue, orange and grey bars respectively. The retained particle percentages after 2D classification and 3D classification are shown as the yellow and blue lines respectively. The 2D and 3D classification plot for dataset II used the particle numbers of the second round of processing.
Figure S3. The FSC between the JSPR refined half maps of the second round reconstruction of dataset II.
Figure S4. The FSC between the full unmasked maps reconstructed from 0–120 degree phase shift particles and 180–360 degree phase shift particles in dataset III (A) and dataset IV (B) showing the negative FSC at low resolutions.


