Abstract
Background:
Use of electronic health records (EHRs) in health research may lead to the false assumption of complete event ascertainment. We present a systematic approach to estimate “observation windows” (OWs), defined as time periods within which the assumption of complete ascertainment of events is more likely to hold, as a quality control approach to reducing the likelihood of this false assumption. We demonstrate the impact of observation windows on estimating the rates of type 2 diabetes mellitus (diabetes) using EHR diagnosis, medication, and laboratory data from HIV clinical cohorts.
Methods:
Data contributed by 16 HIV clinical cohorts to the North American AIDS Cohort Collaboration on Research and Design (NA-ACCORD) were used to identify and evaluate OWs for an operationalized definition of diabetes occurrence as a case study. Procedures included: 1) gathering cohort-level data; 2) visualizing and summarizing gaps in observations; 3) systematically establishing start and stop dates during which complete ascertainment of diabetes events was reasonable; and 4) visualizing the diabetes OWs relative to the cohort open and close dates to identify periods of time during which immortal person time was accumulated and events were not fully ascertained. We estimated diabetes occurrence event rates and 95% confidence intervals ([,]) in the most recent decade that data were available (Jan 1, 2007 to Dec 31, 2016).
Results:
The number of diabetes events decreased by 17% with the use of the diabetes OWs; immortal person-time was removed decreasing total person-years by 23%. Consequently, the diabetes rate increased from 1.23 (95% confidence interval [1.20, 1.25]) per 100 person-years to 1.32 ([1.29, 1.35] per 100 person-years with the use of diabetes OWs.
Conclusions:
As the use of EHR-curated data for event-driven health research continues to expand, OWs have utility as a quality control approach to complete event ascertainment, helping to improve accuracy of estimates by removing immortal person-time when ascertainment is incomplete.
Keywords: Electronic medical records, health research, diabetes, HIV, immortal person time, quality control
INTROUCTION
Combining and harmonizing longitudinal data from medical records has become an important approach to health research. The most common sources of data have been administrative records and, more recently, electronic health records (EHRs). Administrative health data systems have been used for population-based research for decades.1–4 The Health Information Technology for Economic and Clinical Health (HITEC) Act of 2009 and the Affordable Care Act (ACA) implemented in 2014 have been stimuli for the adoption of EHR systems across the United States (US);5,6 however, some health care systems had EHRs in place prior to ACA implementation.7 Although many of these systems are focused on increasing efficiency of healthcare delivery,8 there was also the desire to use data from EHR systems for research purposes.
Although there are still barriers to using EHR data for health research purposes, many clinic-based, longitudinal cohort studies (i.e. clinical cohorts) are successful in extracting the necessary information from the EHR to answer research questions of interest.9–11 The North American AIDS Cohort Collaboration on Research and Design (NA-ACCORD) was established in 2007 to curate data from existing HIV cohort studies, thereby establishing a harmonized data platform for observational data from cohort-specific protocols for research questions that could not be as definitively answered in any single observational HIV cohort.12 Collaborative study designs exists in other fields as well.13 Recently, the Environmental Influences on Child Heath Outcomes (ECHO) study was established by the Director’s Office of the by the National Institutes of Health (NIH) to combine the approaches of creating a harmonized data platform from existing children’s cohort data as well as a platform for new data collection protocols by participating cohorts.14 The All of Us research program, a $130 million dollar initiative by the NIH, will access EHR data on 1 million adults in the United States.15
Cohort collaborations have proven to be powerful in answering important questions, however, there are numerous challenges to using clinical cohort data abstracted from EHR systems, let alone pooling the individual-level data across cohorts. One such challenge is the false assumption of complete event ascertainment when using EHR data. Complete event ascertainment is achieved when all events occurring are believed to be accurately captured and measured using EHR data. Identifying time periods when data are not ascertained must be done at a local level, that is, the individual contributing cohort. Falsely assuming complete ascertainment can result in inaccurate results, including underestimated incidence rates due to the inclusion of immortal person-time when the event is not fully ascertained.
To overcome this challenge in the NA-ACCORD, where almost 80% of the data contributed by its individual clinical cohort studies originates in EHR systems, we developed a quality control approach that identifies “observation windows” (OWs), which define the period of time during which it is reasonable to assume the events of interest have been completely ascertained. Given the potential impact of including person-time when event ascertainment is incomplete, OWs were developed using an epidemiologic perspective.
There are few published resources for understanding details of data curation and analytic methodology in EHR systems.16 The objectives of this study two-fold. First, we describe our systematic approach to estimating OWs as a quality control approach to ensure a greater likelihood of the complete event ascertainment assumption. Second, we demonstrate the impact of OWs on event rate estimates using the example of type 2 diabetes mellitus (henceforth referred to as diabetes) within the context of comprehensive HIV care. This example was selected because diabetes is not typically included in core data elements of HIV clinical care cohorts; however, the aging of adults with HIV (largely attributed to successful treatment) necessitates investigations of age-related disease in the context of HIV. Differential data curation of data elements (e.g. CD4 counts and HIV RNA measurements vs. hemoglobin A1c (HgbA1c) measurements in cohorts designed to investigate outcomes among adults with HIV) is one example where OWs can assist with improving the accuracy of estimates.
METHODS
Study population
The NA-ACCORD is a collaboration of >20 clinical and interval cohorts of adults with HIV in the US and Canada. The collaborative study design has allowed investigators to follow >180,000 adults living with HIV, accumulating >1.25 million person-years of follow-up (www.naaccord.org). It serves as the North American region of the International Epidemiology Databases to Evaluate AIDS (IeDEA) project, supported by various institutes of the National Institutes of Health (www.iedea.org). Details on this collaboration have been published previously.12
NA-ACCORD-contributing cohorts annually submit data from adults (≥18 years old) receiving HIV clinical care or participating in classical HIV cohort studies. Data are submitted to the Data Management Core (DMC, University of Washington, Seattle WA) where they undergo quality control, are harmonized across cohorts, and transmitted to the Epidemiology/Biostatistics Core (Johns Hopkins University, Baltimore, MD), which conducted the analyses presented here. The human subjects research activities of the NA-ACCORD and each of the participating cohort studies have been reviewed and approved by their respective local institutional review boards and by the Johns Hopkins University School of Medicine.
A subset of 16 clinical cohorts within the NA-ACCORD with access to outpatient EHRs contributed to the nested study we present.
Outcome
The NA-ACCORD uses an operationalized definition of diabetes17k that relies on laboratory, diagnosis, and medication data abstracted from EHRs and is measured as the first occurrence of:
hemoglobin A1c (HgbA1c) ≥6.5%, OR
diabetes-specific medication prescription, OR
a diabetes diagnosis recorded and a diabetes-related medication prescription.
We use the term diabetes “event” instead of “onset,” “diagnosis,” or “incidence.” Our definition does not observe the onset of disease, but rather the point in time when diabetes is recognized in a clinical setting and evidence is recorded in the EHR. We also avoid the term “diagnosis” as the data elements included in the definition are not restricted solely to a clinical diagnosis.
Step 1: Gather key meta-data to establish observation windows
Information on the following were needed to identify observation windows for diabetes events:
The smallest unit of measure for an observation window: In our example, an individual contributing clinical cohort study was the smallest unit for which an observation window was needed (henceforth referred to as cohort); if the cohorts were multi-site, it may be necessary to consider an individual site as the smallest unit of measure
Dates (in calendar time) corresponding to data element measurements, obtained at the person-level: The dates of HgbA1c laboratory measurements, diabetes diagnoses, and diabetes-specific and –related medication prescriptions were extracted from EHRs
The date a cohort was established (henceforth referred to as the cohort open date)
The date through which the cohort is contributing data (henceforth referred to as the cohort close date)
The date at which the cohort switched from paper medical records to an EHR system or made a change to their EHR system that could potentially impact data curation.
The information is collected at the cohort-level (as opposed to the individual-level) is referred to as “meta-data” (e.g. the cohort open and close dates, the date the cohort switched from paper medical records to an EHR system).
Step 2: Visualize and summarize potential gaps in ascertainment by year, for each cohort
Data visualization of the calendar dates at which a data element was measured within each cohort is an essential exploratory data analysis step that cannot be over looked. A histogram of the dates of measurement for each data element by cohort is the minimum visualization needed to identify potential gaps in measurement over time. Although important and powerful, it is unwieldy to harness visualized information from multiple plots stratified by data element and cohort.
We created a data visualization tool that transforms information from the histograms of the dates of measurements for each data element needed in the diabetes definition within each cohort. This tool summarizes visualized gaps in ascertainment across data elements. This tool is not intended to replace the data visualization that it attempts to summarize.
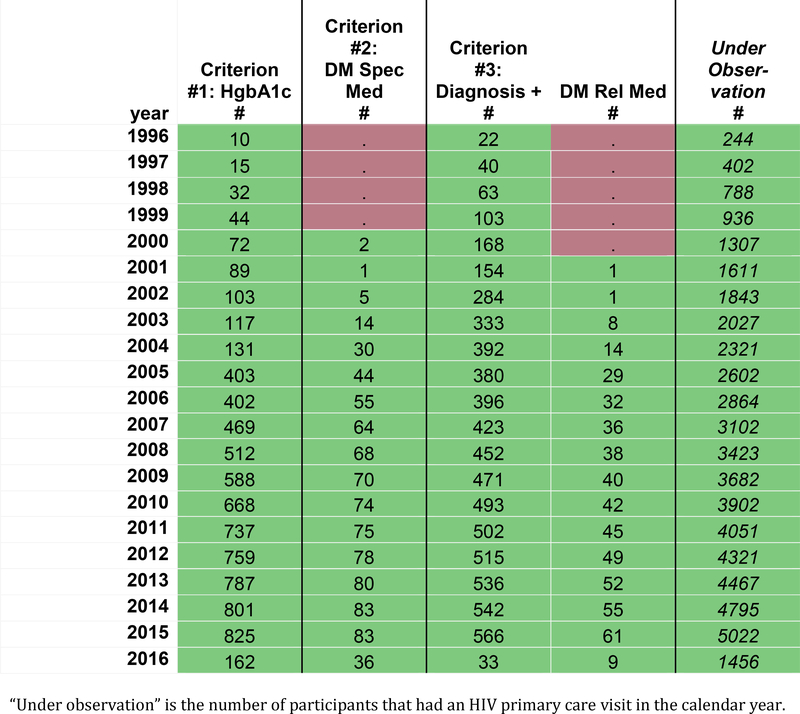
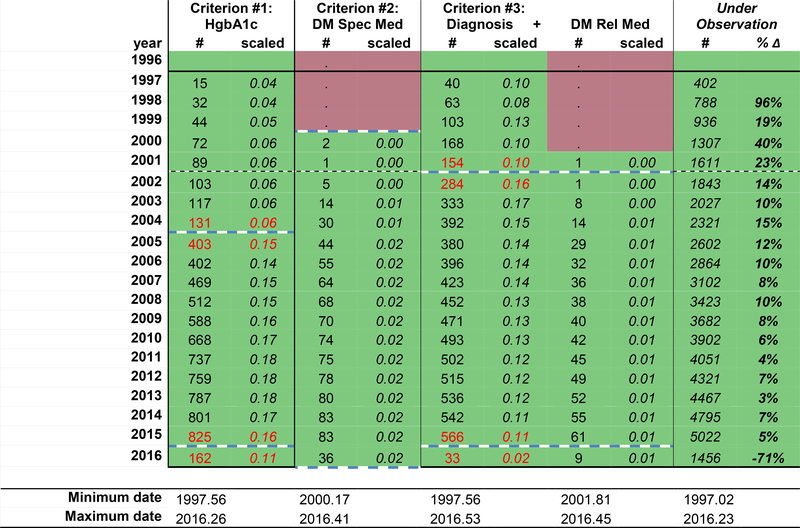
Figure 1a displays the frequency of observations for specific data elements (column headers) required by the diabetes definition within a hypothetical cohort, by calendar year (row headers). For the purposes of this demonstration, calendar time (in years) describes each row; however, this time metric and unit can be modified to fit the study context (e.g. calendar day, month, year, or life stage by day, month, year). Red signals years where no measurements were recorded, and green signals that ≥1 measurement of the data element was collected. Modification to this color scheme includes creating a heat map scaled by the largest number of measurements of the data element in a year.
Figure 1a:
Number of measurements of data elements in the diabetes definition within a hypothetical individual contributing cohort, by calendar year
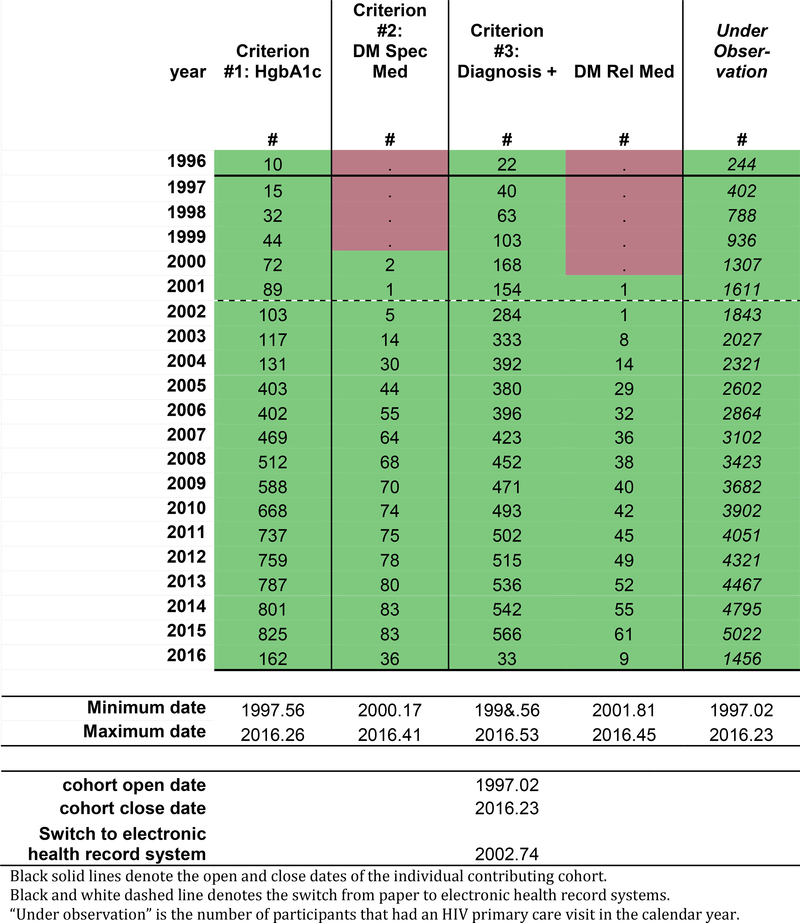
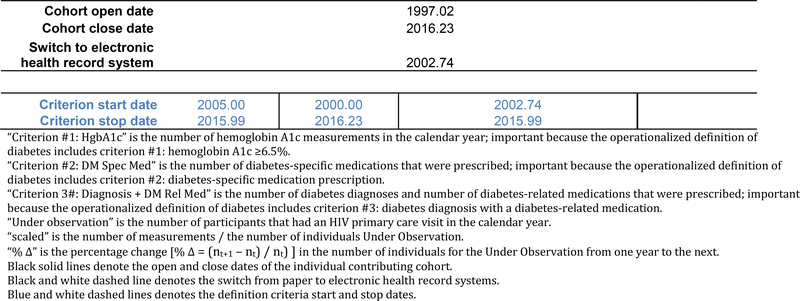
The black solid lines in Figure 1b represent the cohort open and close dates, which is the OW for the cohort; the cohort open and close dates are also presented as decimal years below the table. The NA-ACCORD requires all individual contributing cohorts to ascertain and contribute CD4 count and HIV RNA laboratory measurements, first AIDS-defining illness, ART prescriptions, and deaths. Cohort open and close dates are created using the observation windows approach for these required core data elements. Thus, the cohort open and close dates attempt to define the period of time of complete (or nearly complete) ascertainment of the core data elements within each cohort.
Figure 1b:
The hypothetical individual contributing cohort’s start and stop dates (solid black lines), the year of switch from paper to electronic health record systems (black and white dashed line), and the minimum and maximum observation dates for each data element.
Measurements occurring prior to the cohort open date may be present in data from the cohorts; we call these measurements “historical data.” These data reflect efforts made by the study staff when enrolling a participant to ascertain important events occurring prior to enrollment, such as (in the setting of an HIV clinical cohort) the date an individual initiated antiretroviral therapy or had their first AIDS-defining illness diagnosis. Because this data was not directly observed, but rather relied on self-report at the time of enrollment (sometimes followed by confirmation in the medical record if available), ascertainment of historical data is believed to be incomplete.
The black and white dotted line (Figure 1b) denotes the timing of a major change in the EHR system. A change from paper systems to an EHR system may have improved ascertainment by decreasing the impact of physically missing paper records and/or a decrease in data abstraction errors. Changes from one EHR system to another EHR system (which was not uncommon after the implementation of the Affordable Care Act in 2014 when community affiliates of major hospitals changed EHR systems to be compatible) are also important to note as roll-out of the new systems can take time and the new system may capture specific data elements with a different level of ascertainment.
In Figure 1b, the date of the oldest (minimum) measurement observed and the date of the most recent (maximum) measurement observed are added to the tool for each data element. This information becomes helpful guides and should allow for immediate recognition of egregious date errors (often related to data entry errors).
Identifying potential gaps in ascertainment of the date elements starts with a visual scan for changes in the number of observations from year to year that do not fit the expected pattern of the specific data element of interest. Expected patters are specific to the context and data and reflect true increases or decreases in the number of measurements, such as:
Increases in the number of measurements, due to gradual increases in the number of observations reflecting recruitment, consent, and enrollment;
Calendar time trends, for example in the late 1990s, when there was very little diabetes among adults with HIV as life expectancy was much lower, restricting the influence of age as a risk factor for diabetes; and
Decreases in the number of measurements in the most recent years, as there may be differences in the lags between when the data element is recorded in the EHR and when it is available for research purposes and/or the cohort was not able to observe the specific data element until the end of the calendar year (which may also be reflected in the maximum date of measurement).
Unexpected patterns in the data that are artifacts of data collection or ascertainment methods can uncover periods of under ascertainment, such as:
dramatic increases in the number of measurements in the early years that do not match the pace of enrollment of individuals into the cohort, as that may signal changes in data collection protocols that improved ascertainment, exposing potential under ascertainment in the prior years
increases or decreases in the number of measurements around the time of changes in EHR systems, that may signal improved ascertainment, exposing potential under ascertainment in the prior years (conversely, the opposite could also occur)
Because differentiating expected from unexpected changes in the number of measurements is highly dependent upon the underlying number of people under observation (which changes over timein dynamic cohorts), we recommend enlisting a summary statistic to better understand the changes in the number of measurements accounting for changes in the underlying population. One such statistic is the percent change from one year to the next (percent change = (nt+1 – nt) / nt). The percent change is most useful in the context of an expected number of measurements in each period of time, and when there are no changes in the underlying population, the risk factors for the outcome measured by the data elements, or guidelines that may impact the frequency of measurements). Other measurements. Other helpful summary statistics include the number of measurements per individual per year, or the proportion of individuals who have at least one measurement a year, particularly if there is a relevant clinical guideline with good adherence (e.g. at least once CD4 count measurement per person per year).
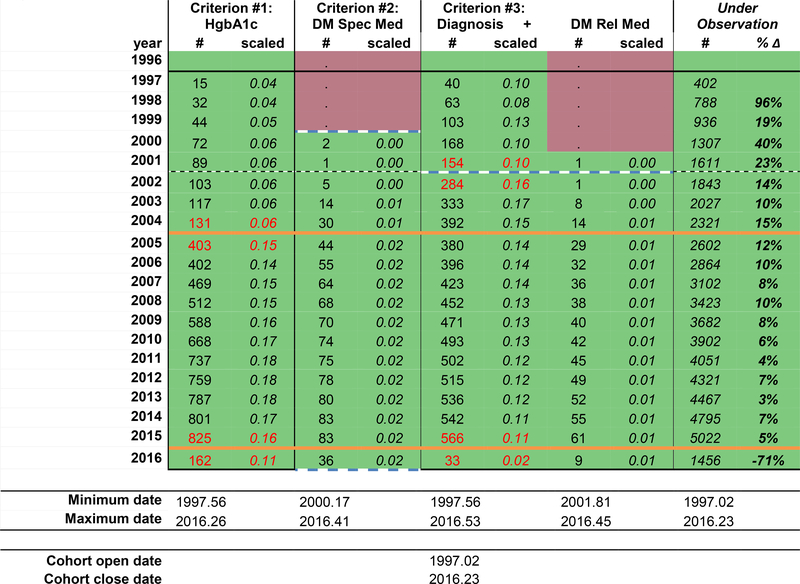
In this example using a dynamic clinical cohort, we chose to scale the number of measurements by the underlying number of patients under observation (the number of measurements of the data element / the number under observation, Figure 1d). Although this measure allows us to see changes in the number of measurements from one year to the next after crudely accounting for change in the total number under observation, this measure, is more stable and less variable with larger numbers under observation; the stability of the statistic when applied to a large number of measurements might mask potential gaps in ascertainment. We used a threshold +/− 0.05 scaled measurements to flag changes over time that may signal potential gaps in ascertainment (red text). We chose this cut-off that is more sensitive to even change from one year to the next because of the large total number under observation. We have also calculated the percent change in the number under observation from one year to the next to better depict changes in the size of the dynamic cohort over time because the number of measurements is scaled to the number under observation.
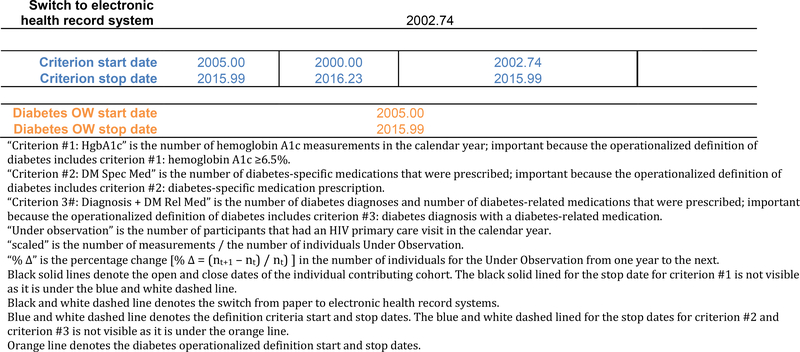
Figure 1d:
The hypothetical individual contributing cohort’s diabetes observation window start and stop dates (solid orange lines).
There are options for additional modification, including stratification into important subgroups and then estimating the summary statistic. For example, stratification of the number of diabetes diagnoses and the number under observation by decade of age group or body mass index may help to determine if unusual patterns exist and strengthen the evidence of the quality of the data when known patterns are observed (i.e. more diagnoses among older adults (vs. younger) adults and obese (vs. normal weight) individuals).
Step 3: Develop an algorithm to systematically establish the observation windows for diabetes across cohorts
The operationalized definition is the criteria used to classify someone as having the event, which may include combing data elements for a single criterion, such as a diabetes diagnosis and a diabetes-related medication prescription. “Start” and “stop” dates must be defined for each criterion in the definition of diabetes, which includes incorporating the objective measurements of unexpected patterns in the data and the subjective judgment of whether the cohort was completely ascertaining the data elements needed by the criterion (Figure 1c).
Figure 1c:
The hypothetical individual contributing cohort’s number of measurements scaled by the number under observation, the percent change in the number of individuals from one year to the next, the change of +/− 0.05 in scaled measurements from one year to the next (red text), and the start and stop dates for each diabetes definition criteria (dashed blue lines).
For diabetes definition criterion #1 (HgbA1c ≥6.5%) in our example, the scaled number of measurements increased from 0.06 in 2004 to 0.15 in 2005. As there were no changes in the recommendations for HgbA1c measurements, this is an unexpected change suggestive of a change in the EHR system or in the data curation protocol for the cohort that suggests under ascertainment prior to 2004. Thus, 2005.00 is the start date for criterion #1. HgbA1c scaled measurements decreased from 0.16 to 0.11 from 2015 to 2016, suggesting the hemoglobin A1c measurements were not completely ascertained from 2016.00 to the cohort close date of 2016.23; therefore, the criterion #1 stop date is set at 2015.99.
For diabetes definition criterion #2 (prescription of a diabetes-specific medication), there were no diabetes-specific medications prescribed prior to 2000; although this may be real, it is difficult to judge the completeness of the data when no measurements were ascertained. Thus, the criterion #2 start date is 2000.00. The scaled number of diabetes-specific medications measurements are consistent until the final year of data collection (2016). The number of measurements drops substantial from 83 in 2015 to 36 in 2016, but the cohort close date reminds us that the cohort did not collect data through 2016.99, but rather through 2016.23. Because the scaled number of measurements are similar in 2015.00–2015.99 and 2016.00–2016.23, the criterion #2 stop date is set at 2016.23.
For diabetes definition criterion #3 (diabetes diagnosis and prescription of a diabetes-related medication), the scaled number of diagnoses increased from 0.10 in 2001 to 0.16 in 2002, signaling potential gaps in ascertainment prior to the implementation of an EHR system in 2002.74. The scaled number of diabetes-related medications must also be scrutinized to complete the start date for criterion #3 because it involves both data elements. Although there was only 1 prescription of a diabetes-related medication in the data in 2001 and the same number in 2002, the scaled number of diabetes related medications is low, and consistent from 2001 to 2016. Thus, the start date for criterion #3 is 2002.74. The number of diabetes diagnoses drops dramatically from 2015 to 2016, with a corresponding drop in the scaled number of measurements from 0.11 to 0.02. The stop date for criterion #3 is 2015.99.
The start and stop dates for all three criteria are depicted in Figure 1c, by the blue dashed lines and the blue text at the bottom of the table.
Finally, we identified the time period overlap across the three criteria using the criterion-specific start and stop dates for each cohort. The start and stop dates for the diabetes observation window according to the specified definition is:
Diabetes OW start date = maximum [Criterion #1 HgbA1c start date, Criterion #2 diabetes-specific medication start date, Criterion #3 diagnosis + diabetes-related medication start date]
Diabetes OW stop date = minimum [Criterion #1 HgbA1c stop date, Criterion #2 diabetes-specific medication stop date, Criterion #3 diagnosis + diabetes-related medication stop date]
These diabetes OWs are denoted by the orange solid lines in Figure 1d.
For other event definitions, a less conservative approach may be appropriate, expanding the event observation window to the first and last year any of the criterion were ascertained (as opposed to restricting to the time period when the data for all three criterion were ascertained). We caution the use of this approach, as there is likely to be differential ascertainment across time and fluctuations in the event rate may be due to changes in the ascertainment of ≥1 criteria.
Step 4: Visualize the outcome observation window relative to the cohort open and close dates
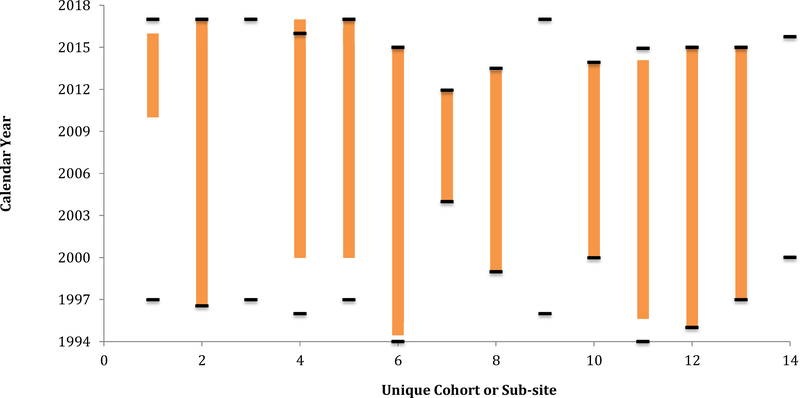
Once the observation window is established for the event, bar charts show the observation window in units of calendar time for each cohort (Figure 2). The calendar time between the cohort open date and the diabetes OW start date, as well as the time between the diabetes OW stop date and the cohort close date, are times when events were not being completely ascertained. Note three cohorts have no observation window. This was due to the fact that they did not have an overlapping window of the data elements needed for all three criterion (as defined using the criterion start and stop dates); these exclusions most dramatically reduce the immortal person time accumulated by these cohorts when ascertainment was incomplete.
Figure 2:
Diabetes observation windows for each cohort (orange bars) and the cohort open and close dates (black bars) for the 13 cohorts participating in the estimation of the diabetes event rate.
As a modification to Figure 2, the width of the bars can reflect the size of the cohort to the total study population (we did not include this modification out of respect for the NA-ACCORD contributing cohorts’ anonymity in all collaboration investigations).
Statistical Analysis
We estimated crude incidence rates (IR) per 100 person-years (PY) and 95% confidence intervals ([ , ]) for first diabetes occurrence in the most recent decade of data available using our operationalized definition of diabetes with, and without, OWs among adults who have initiated ART and without prior document of diabetes in the NA-ACCORD.
The study entry and exit dates define the period when an individual is under observation, may contribute events and person-time, and complete ascertainment of the event of interest is assumed. Individuals were followed until the outcome of interest (diabetes), death, loss to follow-up (defined as 1.5 years after the CD4 or HIV RNA measurement that preceded a gap of more than 2 years with no CD4 or HIV RNA measurement), or were censored at age 70 (as the number of person-years observed over the age of 70 becomes small and estimates become unstable).
Definitions of study entry and study exit that ignored the diabetes observation windows were defined as:
Study entry0 = maximum(date of enrollment, cohort open date)
Study exit0 = minimum(date of diabetes occurrence, death date, date of CD4 or HIV RNA prior to a ≥2 year gap + 1.5 years, age 70 years, cohort close date)
Study entry and exit dates that incorporated the diabetes observation windows (thereby restricting to time periods where ascertainment is suspected to be complete) were defined as:
Study entry1 = maximum(date of enrollment, diabetes OW start date, cohort open date)
Study exit1 = minimum(date of diabetes occurrence, death date, date of CD4 or HIV RNA prior to a ≥2 year gap + 1.5 years, age 70 years, diabetes OW stop date, cohort close date)
Note that when defining an individual’s study entry and study exit dates, it is important to incorporate cohort open date and cohort close date into the definition if they are not explicitly incorporated in the outcome-specific OW. Although it is rare that the cohort close date occurs before the diabetes stop date, this could occur if the cohort close date was based on an element that is not ascertained during the entire outcome-specific OW (see Figure 2, Cohort 4). Further, the cohort close date should be the date through which other needed measurements, such as risk factors, exposures, mediators, or interaction terms, are available.
RESULTS
Using the tool depicted in Figure 1a–d, we identified periods of calendar time during which there was greater likelihood of complete ascertainment of the criterion in the operationalized definition of diabetes for each of the 16 US clinical cohorts.
The number of person years decreased by 23% with the use of the OWs (from 729,413 person years without the OWs to 563,209 person years with the OWs included in an individual’s study entry and exit). The number of diabetes events decreased by 17% (from 8,949 without the OWs to 7,409 with the OWs). The cohorts with differing cohort start and diabetes OW start dates and/or differing cohort close and diabetes OW stop dates contributed to the change in the number of diabetes occurrences and person years of observation.
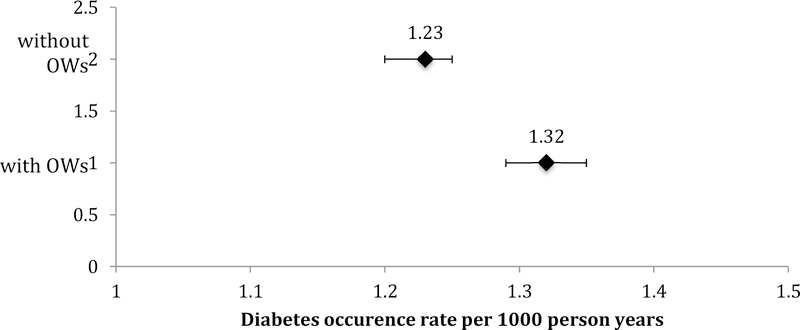
The incidence of diabetes events was underestimated when the cohort-specific diabetes OWs were ignored and the assumption of complete ascertainment did not hold (Figure 3). More specifically, the denominator of observed person years was reduced by removing the person time accumulated in years when the data elements needed to determine the occurrence of a diabetes event were under ascertained (i.e. immortal person-time). The incidence of diabetes was 1.32 ([1.29, 1.35] per 100 PY without the use of the diabetes OWs and increased to 1.23 ([1.20, 1.25] per 100 PY with the use of the diabetes OW.
Figure 3:
Diabetes occurrence rate estimates and 95% confidence intervals with, and without, incorporating the observation windows (OWs), NA-ACCORD
DISCUSSION
Relevant EHR data curated by longitudinal clinical cohorts are considered valuable to health research initiatives.18 The number of health outcomes publications involving EHR data increased dramatically from 2007 to 2012.9,19 Our approach to identifying OWs as a quality control approach to scrutinize complete event ascertainment is one strategy to address challenges of event-driven research using longitudinal EHR data. Our findings show that failing to evaluate and incorporate OWs in the estimation of first occurrence of diabetes resulted in an underestimation of incidence, as immortal person time was included in the denominator of the incidence rate when ascertainment of the event was incomplete. We build on the known limitations of under ascertainment of events in observational and secondary data sources research with a practical approach to improve the quality of the data used in analyses by overcome incomplete ascertainment challenges in event-driven research using EHR data.20,21
Our methods may be particularly relevant for the All of Us research program, which will create a scientific platform for precision medicine.15 Precision medicine “is an approach to disease prevention, diagnosis, and treatment that seeks to maximize effectiveness by considering individual variability in genes, environment, and lifestyle.”15 Data are needed on a large scale (to be adequately powered for rare events and interactions of genes and environment) and from a diverse population to provide the information needed to achieve the goals of precision medicine. According to version 1 of the All of Us study protocol, EHR data will be abstracted for participants biannually for those who consent, making EHR data an important data source of this large-scale observational cohort.15 Quality control efforts to evaluate event ascertainment from EHR will be essential to the ability of this initiative to generate findings that may change how we preserve health and prevent disease.
The reasons for under ascertainment of data elements needed to define events in EHR data can vary based on context, but we have identified two common reasons from our research context. The first is changes to, or in, the EHR system used by the healthcare entity. In 2008, only 9.4% of hospital medical records were electronic with clinical information, order entry, results management, and decisions support functions; in 2015, 96% of hospitals reported EHRs that met the technological capability, functionality and security requirements stated by the US Department of Health and Human Services.22 When creating OWs for a variety of data elements, we have found that the time of transition from paper to EHRs results in a gap in ascertainment for many contributing cohorts. This context is particularly relevant for longitudinal studies with data abstracted from paper medical record before EHRs. Many of our HIV cohort studies were initiated during, or immediately after, the advent of effective treatment in 1996, which was years prior to the implementation of an EHR system for many of our clinical cohorts. But beyond conversion from paper records to EHR systems, smaller changes to EHR systems, such as software updates, changes in software algorithms, and changes in diagnosis and medication coding, can create unintended disruptions to EHR data that is extracted from the system. Second, under ascertainment occurs when the individual contributing cohort makes a change to their data curation protocols. A common example is when a cohort collects a data element on a sub-set of participants, and then later expands it to all participants (often when piloting whether ascertainment is feasible, or complete ascertainment is possible). It is also important to note gaps can be the result of data management error by the cohort or at the centralized data processing and analytic centers for cohort collaborations. Thus, evaluating OWs also serves as one of many potential quality control approaches. Although many studies using EHR data are large in sample size, there is no guarantee that the signal will overcome the noise of poor quality data.23
Creating OW can be a time-intensive process, so deciding which data elements to prioritize for an OW approach is relevant. Based on our experience, we recommend starting with core data elements that are essential to answering the research questions of interest. In the NA-ACCORD, our core data elements include demographic characteristics, CD4 T-lymphocyte cell and HIV RNA measurements (biomarkers of HIV disease progression), AIDS diagnoses measurements, measurements of antiretroviral therapy, and death; these data elements inform the cohort open and close date, which are the overall observation windows for each cohort. Next, create OWs for event-driven outcomes that are outside of the core data. Age-related comorbidities, including diabetes, hypertension, chronic kidney disease, end-stage renal disease, cancer, myocardial infarction, and liver disease are important for HIV research as adults age with HIV, but are not part of the core data; OWs have been created for each of these event-driven outcomes in the NA-ACCORD. Important event-driven exposures, risk factors, predictors, or covariates of interest have OWs such as time-varying smoking and alcohol use. Although we argue the need for creating OWs in the collaborative study design of the NA-ACCORD, our approach is also applicable to single-site cohort studies using EHR data. Finally, OWs are tied to the operationalized definitions of the event. As the comprehensiveness of widely-used EHRs continues to improve, and as guidelines for prevention, screening, diagnosis, and treatment of specific diseases change, it is possible that diagnoses codes will become obsolete for some diseases, replaced with laboratory measurements that meet stated guidelines, objectively verifying the presence of disease. As operationalized definitions evolve, the process presented here must be repeated to establish the OW for the new definition.
The approach and tools presented here are not without limitations. First, it should be noted that even if OWs are identified, evaluated, and employed with meticulous care, there is still an assumption of complete ascertainment. Although this approach makes this assumption more reasonable, validation studies of complete ascertainment are the gold-standard quality control methodology to ensuring this assumption strictly holds. If participants are seeking care outside of the health care system, the EHR database employed in the study may not ascertain those measurements. Also, it should be noted that if the cohort was established for a specific disease outcome (e.g. HIV), the data needed to investigate other outcomes (i.e. diabetes) may not be as carefully curated; ascertainment may vary by the emphasis placed on the curation of the data elements.
Second, the approach and tools presented here are basic first steps that are best suited for big research data that can afford to exclude a cohort from a nested study (assuming internal and external validity are not threatened). Modifying the data element start and stop dates to a time-frame when there is stabilization of the frequency of the measurement among those under observation from one year to the next likely captures years of complete ascertainment. Stabilization approaches must withstand 1) changes in the number of individuals entering, disengaging, re-engaging, and exiting observation which is common in dynamic clinical cohorts; 2) an increase in the number of participants meeting criteria for measurement of a biomarker (e.g. more HgbA1c measurements among older adults), and 3) changes in screening guidelines themselves, as many of the measurements used to create an operationalized definition rely on measurements made during screening). Modifications to the basic approach presented here may be needed and must be made with respect to specific research contexts, outcomes, exposures, risk factors, predictors or covariates of interest.
Third, the example we used demonstrated that by not incorporating OWs, person-time and number of events were quantified incorrectly, leading to an underestimation of the first occurrence of diabetes. It is not always the case, however, that the estimate will be underestimated as that is a function of the estimate and whether the outcome or the exposure(s) of interest needs an OW(s).
Fourth and finally, we cannot allow the size of an EHR database to blind us to the more important characteristics of the database when determining if the question of interest can be answered appropriately, with defendable internal and external validity.
As the use of data curated from EHRs for event-driven health research continues to expand, approaches and tools are needed to overcome challenges to the quality of EHR data and ensure accuracy of estimates. As we have demonstrated, OWs are one approach that can help improve confidence in the assumption of complete event ascertainment and more accurate estimates.
ACKNOWLEDGEMENTS
We would like to thank the Data Managers at the individual NA-ACCORD contributing cohorts for their continued partnership and tireless efforts to collect the data.
The content is solely the responsibility of the authors and does not necessarily represent the official views of the National Institutes of Health. This work was supported by National Institutes of Health grants U01AI069918, F31AI124794, F31DA037788, G12MD007583, K01AI093197, K01AI131895, K23EY013707, K24AI065298, K24AI118591, K24DA000432, KL2TR000421, M01RR000052, N01CP01004, N02CP055504, N02CP91027, P30AI027757, P30AI027763, P30AI027767, P30AI036219, P30AI050410, P30AI094189, P30AI110527, P30MH62246, R01AA016893, R01CA165937, R01DA011602, R01DA012568, R01 AG053100, R24AI067039, U01AA013566, U01AA020790, U01AI031834, U01AI034989, U01AI034993, U01AI034994, U01AI035004, U01AI035039, U01AI035040, U01AI035041, U01AI035042, U01AI037613, U01AI037984, U01AI038855, U01AI038858, U01AI042590, U01AI068634, U01AI068636, U01AI069432, U01AI069434, U01AI103390, U01AI103397, U01AI103401, U01AI103408, U01DA03629, U01DA036935, U01HD032632, U10EY008057, U10EY008052, U10EY008067, U24AA020794,U54MD007587, UL1RR024131, UL1TR000004, UL1TR000083, UL1TR000454, UM1AI035043, Z01CP010214 and Z01CP010176; contracts CDC-200–2006-18797 and CDC-200–2015-63931 from the Centers for Disease Control and Prevention, USA; contract 90047713 from the Agency for Healthcare Research and Quality, USA; contract 90051652 from the Health Resources and Services Administration, USA; grants CBR-86906, CBR-94036, HCP-97105 and TGF-96118 from the Canadian Institutes of Health Research, Canada; Ontario Ministry of Health and Long Term Care; and the Government of Alberta, Canada. Additional support was provided by the National Cancer Institute, National Institute for Mental Health and National Institute on Drug Abuse
NA-ACCORD Collaborating Cohorts and Representatives:
AIDS Clinical Trials Group Longitudinal Linked Randomized Trials: Constance A. Benson and Ronald J. Bosch
AIDS Link to the IntraVenous Experience: Gregory D. Kirk
Fenway Health HIV Cohort: Kenneth H. Mayer and Chris Grasso
HAART Observational Medical Evaluation and Research: Robert S. Hogg, P. Richard Harrigan, Julio SG Montaner, Benita Yip, Julia Zhu, Kate Salters and Karyn Gabler
HIV Outpatient Study: Kate Buchacz Jun Li
HIV Research Network: Kelly A. Gebo and Richard D. Moore
Johns Hopkins HIV Clinical Cohort: Richard D. Moore
John T. Carey Special Immunology Unit Patient Care and Research Database, Case Western Reserve University: Benigno Rodriguez
Kaiser Permanente Mid-Atlantic States: Michael A. Horberg
Kaiser Permanente Northern California: Michael J. Silverberg
Longitudinal Study of Ocular Complications of AIDS: Jennifer E. Thorne
Multicenter Hemophilia Cohort Study–II: Charles Rabkin
Multicenter AIDS Cohort Study: Joseph B. Margolick, Lisa P. Jacobson and Gypsyamber D’Souza
Montreal Chest Institute Immunodeficiency Service Cohort: Marina B. Klein
Ontario HIV Treatment Network Cohort Study: Abigail Kroch, Ann Burchell, Adrian Betts and Joanne Lindsay
Retrovirus Research Center, Bayamon Puerto Rico: Robert F. Hunter-Mellado and Angel M. Mayor Southern Alberta Clinic Cohort: M. John Gill
Study of the Consequences of the Protease Inhibitor Era: Jeffrey N. Martin
Study to Understand the Natural History of HIV/AIDS in the Era of Effective Therapy: Jun Li and John T. Brooks
University of Alabama at Birmingham 1917 Clinic Cohort: Michael S. Saag, Michael J. Mugavero and James Willig
University of California at San Diego: William C. Mathews
University of North Carolina at Chapel Hill HIV Clinic Cohort: Joseph J. Eron and Sonia Napravnik
University of Washington HIV Cohort: Mari M. Kitahata, Heidi M. Crane and Daniel R. Drozd Vanderbilt Comprehensive Care Clinic HIV Cohort: Timothy R. Sterling, David Haas, Peter Rebeiro and Megan Turner
Veterans Aging Cohort Study: Amy C. Justice, Robert Dubrow, and David Fiellin
Women’s Interagency HIV Study: Stephen J. Gange and Kathryn Anastos
NA-ACCORD Study Administration:
Executive Committee: Richard D. Moore, Michael S. Saag, Stephen J. Gange, Mari M. Kitahata, Keri N.
Althoff, Michael A. Horberg, Marina B. Klein, Rosemary G. McKaig and Aimee M. Freeman
Administrative Core: Richard D. Moore and Aimee M. Freeman
Data Management Core: Mari M. Kitahata, Stephen E. Van Rompaey, Heidi M. Crane, Daniel R. Drozd, Liz Morton, Justin McReynolds and William B. Lober
Epidemiology and Biostatistics Core: Stephen J. Gange, Keri N. Althoff, Jennifer S. Lee, Bin You, Brenna Hogan, Elizabeth Humes, Jinbing Zhang, Jerry Jing, and Sally Coburn
Process to obtain the data and computing code to replicate the results:
The purpose of this manuscript is to provide the tools necessary to identify observation windows in electronic health record data. Some access restrictions apply to the data underlying the example used in the manuscript to demonstrate how to observation windows impact the accuracy of diabetes occurrence rates. Data are available from the NA-ACCORD Steering Committee for researchers who meet the criteria for access to confidential data. Ethical restrictions prevent public deposition of data. Data and code will be made available to any researcher upon completion of rigorous scientific concept sheet submission, review, and approval process through the NA-ACCORD Steering Committee and Executive Committees, pursuant to agreements with the National Institutes of Health and constituent cohorts. Guidelines for concept sheet submission and approval may be found at https://statepiaps7.jhsph.edu/naaccord/?q=collaborate-us
Financial Support:
This work was supported by National Institutes of Health, USA, the Centers for Disease Control and Prevention, USA, the Agency for Healthcare Research and Quality, USA, the Health Resources and Services Administration, USA, the Canadian Institutes of Health Research, Canada, the Ontario Ministry of Health and Long Term Care, Canada, and the Government of Alberta, Canada.
Footnotes
Conflicts of Interest:
KN Althoff serves on the Scientific Advisory Board for TrioHealth (outside the submitted work). MJ Silverberg received research grants to his institution from Pfizer and Merck (outside the submitted work).
There are no other conflicts of interest.
Publisher's Disclaimer: This is a PDF file of an unedited manuscript that has been accepted for publication. As a service to our customers we are providing this early version of the manuscript. The manuscript will undergo copyediting, typesetting, and review of the resulting proof before it is published in its final citable form. Please note that during the production process errors may be discovered which could affect the content, and all legal disclaimers that apply to the journal pertain.
REFERENCES
- 1.Connell FA, Diehr P, Gary Hart L. The use of large data bases in heatlh care studies. Ann Rev Public Heal. 1987;8:51–74. doi: 10.1146/annurev.pu.08.050187.000411. [DOI] [PubMed] [Google Scholar]
- 2.Sørensen HT. Regional administrative health registries as a resource in clinical epidemiologyA study of options, strengths, limitations and data quality provided with examples of use. Int J Risk Saf Med. 1997;10(1):1–22. doi: 10.3233/JRS-1997-10101. [DOI] [PubMed] [Google Scholar]
- 3.Quan H, Parsons GA, Ghali WA. Validity of information on comorbidity derived rom ICD-9-CCM administrative data. Med Care. 2002;40(8):675–685. doi: 10.1097/01.MLR.0000020927.46398.5D [DOI] [PubMed] [Google Scholar]
- 4.Romano PS, Roos LL, Luft HS, Jollis JG, Doliszny K. The Ischemic Heart Disease Patient Outcomes Research Team. A comparison of administrative versus clinical data: coronary artery bypass surgery as an example. J Clin Epidemiol. 1994;47(3):249–260. doi: 10.1016/0895-4356(94)90006-X [DOI] [PubMed] [Google Scholar]
- 5.Kocher R, Emanuel EJ, Deparle N-AM. The Affordable Care Act and the Future of Clinical Medicine: The Opportunities and Challenges. Ann Intern Med. 2010;153:536–539. doi: 10.7326/0003-4819-153-8-201010190-00274. [DOI] [PubMed] [Google Scholar]
- 6.One Hundred Eleventh Congress of the United States of America. American Recovery and Reinvestment Act of 2009 (ARRA): Health Information Technology (HITECH) Act. Washington DC; 2009. https://www.healthit.gov/sites/default/files/hitech_act_excerpt_from_arra_with_index.pdf. Accessed June 8, 2018. [Google Scholar]
- 7.Bates DW, Ebell M, Gotlieb E, Zapp J, Mullins HC. A proposal for electronic medical records in U.S. primary care. J Am Med Informatics Assoc. 2003;10(1):1–10. doi: 10.1197/jamia.M1097 [DOI] [PMC free article] [PubMed] [Google Scholar]
- 8.Stark P Congressional intent for the HITECH Act. Am J Manag Care. 2010;16(12 Spec No):SP24–SP28. doi:12768 [pii] [PubMed] [Google Scholar]
- 9.Dean BB, Lam J, Natoli JL, Butler Q, Aguilar D, Nordyke RJ. Use of electronic medical records for Hhealth outcomes research: A literature review. doi: 10.1177/1077558709332440 [DOI] [PubMed] [Google Scholar]
- 10.Kho AN, Pacheco JA, Peissig PL, et al. Electronic Medical Records for Genetic Research: Results of the eMERGE Consortium. Sci Transl Med. 2011;3(79):79re1. doi: 10.1126/scitranslmed.3001807 [DOI] [PMC free article] [PubMed] [Google Scholar]
- 11.Liao KP, Cai T, Gainer V, et al. Electronic Medical Records for Discovery Research in Rheumatoid Arthritis Care Res. 2010;62(8):1120–7. doi: 10.1002/acr.20184 [DOI] [PMC free article] [PubMed] [Google Scholar]
- 12.Gange SJ, Kitahata MM, Saag MS, et al. Cohort Profile: The North American AIDS Cohort Collaboration on Research and Design (NA-ACCORD). Int J Epidemiol. 2007;36(2):294–301. doi: 10.1093/ije/dyl286 [DOI] [PMC free article] [PubMed] [Google Scholar]
- 13.Lesko CR, Jacobson LP, Althoff KN, et al. Collaborative, pooled and harmonized study designs for epidemiologic research: challenges and opportunities. Int J Epidemiol. 2018;47(2):654–668. doi: 10.1093/ije/dyx283 [DOI] [PMC free article] [PubMed] [Google Scholar]
- 14.National Institutes of Health. Environmental Influences on Child Health Outcomes (ECHO) Program. https://www.nih.gov/echo. Published 2017. Accessed June 8, 2018.
- 15.All of Us Research Program Sponsor National Institutes of Health (NIH) Protocol Version Core Protocol V1. All of Us Research Program, Core Portocol V1.
- 16.Hersh WR, Weiner MG, Embi PJ, et al. Caveats for the use of operational electronic health record data in comparative effectiveness research. Med Care. 2013;51(8 Suppl 3):S30–37. doi: 10.1097/MLR.0b013e31829b1dbd [DOI] [PMC free article] [PubMed] [Google Scholar]
- 17.Wong C, Gange SJ, Buchacz K, et al. First occurrence of diabetes, chronic kidney disease, and hypertension among north American HIV-infected adults, 2000–2013. Clin Infect Dis. 2017; 64(4):459–67. doi: 10.1093/cid/ciw804 [DOI] [PMC free article] [PubMed] [Google Scholar]
- 18.Andreu-Perez J, Poon CCY, Merrifield RD, Wong STC, Yang G-Z. Big Data for Health. IEEE J Biomed Heal Informatics. 2015;19(4):1193–208. doi: 10.1109/JBHI.2015.2450362 [DOI] [PubMed] [Google Scholar]
- 19.Lin J, Jiao T, Biskupiak JE, McAdam-Marx C. Application of electronic medical record data for health outcomes research: a review of recent literature. Expert Rev Pharmacoecon Outcomes Res. 2013;13(2):191–200. doi: 10.1586/erp.13.7 [DOI] [PubMed] [Google Scholar]
- 20.Schneeweiss S, Avorn J. A review of uses of health care utilization databases for epidemiologic research on therapeutics. J Clin Epidemiol. 2005;58(4):323–37. doi: 10.1016/j.jclinepi.2004.10.012 [DOI] [PubMed] [Google Scholar]
- 21.Sorensen HT, Sabroe S, Olseon J. A Framework for Evaluation of Secondary Data Sources for Epidemiological Research. Int J Epidemiol. 1996;25(2):435–442. [DOI] [PubMed] [Google Scholar]
- 22.Charles D, Gabriel M, Searcy T. Adoption of Electronic Health Record Systems among U.S. Non-Federal Acute Care Hospitals: 2008–2014; 2015. https://www.healthit.gov/sites/default/files/data-brief/2014HospitalAdoptionDataBrief.pdf. Accessed June 8, 2018.
- 23.Cai L, Zhu Y. The Challenges of Data Quality and Data Quality Assessment in the Big Data Era. Data Sci J. 2015;14(0):2. doi: 10.5334/dsj-2015-002 [DOI] [Google Scholar]


