

Abstract
Background:
Alterations and asymmetries in trunk motions during activities of daily living, involving lower extremities, are suggested to cause higher spinal loads in persons with unilateral lower limb amputation. Given the repetitive nature of most activities of daily living, knowledge of the amount of increase in spinal loads is important for designing interventions aimed at prevention of secondary low back pain due to potential fatigue failure of spinal tissues. The objective of this study was to determine differences in trunk muscle forces and spinal loads between persons with and without lower limb amputation when performing sit-to-stand and stand-to-sit tasks.
Methods:
Kinematics of the pelvis and thorax, obtained from ten males with unilateral transfemoral lower limb amputation and 10 male uninjured controls when performing sit-to-stand and stand-to-sit activities, were used within a non-linear finite element model of the spine to estimate trunk muscle forces and resultant spinal loads.
Findings:
The peak compression force, medio-lateral (only during stand-to-sit), and antero-posterior shear forces were respectively 348N, 269N, and 217N larger in person with vs. without amputation. Persons with amputation also experienced on average 171N and 53N larger mean compression force and medio-lateral shear force, respectively.
Interpretation:
While spinal loads were larger in persons with amputation, these loads were generally smaller than the reported threshold for spinal tissue injury. However, a rather small increase in spinal loads during common activities of daily living like walking, sit-to-stand, and stand-to-sit may nevertheless impose a significant risk of fatigue failure for spinal tissues due to the repetitive nature of these activities.
Keywords: Rising and sitting, Trunk muscle forces, Spinal loads, Low back pain, Limb loss, Biomechanics
Introduction
Alterations and asymmetries in trunk motions/postures during activities of daily living have been reported in persons with unilateral lower limb amputation (LLA) (Cappozzo and Gazzani, 1982; Hendershot and Wolf, 2014; Rueda et al., 2013; Sagawa et al., 2011; Yoder et al., 2015). Such changes in the way an activity is performed adversely affect the mechanical demand of the activity on the lower back (Hendershot and Wolf, 2014, 2015; Shojaei et al., 2016b), are associated with changes in the synergy between the active and passive responses of lower back tissues to equilibrium and stability requirements of the spine (Hendershot et al., 2013; Hendershot and Nussbaum, 2014), and likely result in larger spinal loads (Hendershot et al., 2018; Shojaei et al., 2016a). Importantly, given the repetitive nature of most activities of daily living, even a moderate increase in spinal loads across activities of daily living can pose a risk for development of low back pain (LBP) due to cumulative changes and fatigue failure of spinal tissues (Adams et al., 2006; Coenen et al., 2014; Kumar, 1990).
Walking has been shown to be mechanically more demanding on the lower back of persons with versus without LLA (Hendershot and Wolf, 2014). The associated internal responses from trunk muscles along with the resultant spinal loads have further been shown to be substantially larger among persons with LLA (Hendershot et al., 2018; Shojaei et al., 2016a). For instance, spinal loads at the L5-S1 spinal level during walking at a self-selected pace were reported to be 8–14% larger in persons with LLA, despite having a slower self-selected pace compared to uninjured individuals (Hendershot et al., 2018). Such differences in trunk muscle forces and spinal loads were more exaggerated when using controlled walking paces (Shojaei et al., 2016a). Specifically, the sum of forces in muscles attached to the lumbar (i.e., local muscles) /thoracic (i.e., global muscles) spine, and the resultant compression and medio-lateral and antero-posterior shear forces at the L5-S1 spinal level during walking at 1.35 m/s were respectively 23%, 64%, 39%, 60%, and 43% larger among persons with LLA. Furthermore, increasing walking pace is associated with larger increases in spinal loads in persons with versus without LLA (Hendershot et al., 2018). While there are activities of daily living other than walking that are also repetitive and/or demanding (e.g., sit-to-stand), there is limited information related to the differences in trunk muscle forces and spinal loads between persons with and without LLA when performing such activities.
Sit-to-stand and stand-to-sit activities are among the essential tasks of daily living and have been reported to be performed as frequent as ~ 56 transitions/day for persons with LLA (Bussmann et al., 2008). While less repetitive than walking, these tasks involve large lower back deformations and are associated with high mechanical demand on the lower back. Persons with versus without LLA perform sit-to-stand and vice versa with even larger lower back deformations (forward flexion: ~ 1.5-fold; lateral flexion: ~ 2.0-fold; axial twist: ~ 2.5-fold) that impose larger moment demand on the lower back (~ 1.3-fold in the sagittal plane as the primary plane of the motion). For movements that are primarily performed in the sagittal plane, small deviations in task symmetry (i.e., increases in coupled motion in transverse and frontal planes) lead to significant increases in muscle forces and spinal loads (Granata, 1995; Shojaei et al., 2016a). There is, however, limited information about the impact of observed differences and asymmetries in the trunk kinematics of persons with versus without LLA on trunk muscle forces and resultant spinal loads during sit-to-stand and stand-to-sit activities.
The objective of this study was to compare trunk muscle forces and spinal loads between persons with and without transfemoral LLA during sit-to-stand and stand-to-sit activities. Considering the reported larger and asymmetric trunk kinematics and larger moment demand on the lower back during sit-to-stand and stand-to-sit activities (Actis et al., 2018; Hendershot and Wolf, 2015), it was hypothesized that persons with vs. without LLA would experience larger trunk muscle forces and resultant spinal loads. A knowledge of differences in muscle forces and spinal load will enable the assessment of the risk of fatigue failure of lower back tissues in persons with versus without LLA.
Methods
Participants and Experimental Procedures
A detailed description of participants and experimental procedures has been described previously (Hendershot and Wolf, 2015). Briefly, 10 males with unilateral (transfemoral) LLA and 10 male uninjured controls participated in this study. All participants were military personnel and had no neurological or musculoskeletal conditions (except amputation in the persons with LLA), or pain that could have adversely affected the results. Main inclusion criteria for the persons with LLA were: 1) regular use of a prosthetic device, 2) no use of an upper-extremity assistive device, and 3) being at least 6 months post-amputation. Before any data collection, consent was obtained according to procedures approved by the local Institutional Review Board. There was no differences (p > 0.21) between persons with and without LLA for age (27.9 (5.4) years vs. 27.4 (3.6) years), stature (1.79 (0.06) m vs. 1.83 (0.08) m), and body mass (85.2 (10.9) kg vs. 86.2 (6.2) kg).
During the experiments, participants completed a set of five consecutive sit-to-stand and vice versa activities by rising from and sitting on an armless and backless stool with a solid seat surface. The height of the stool was adjusted for each participant such that feet were flat on the floor, knees were in 90-degree flexion, and thighs were parallel to the floor. Participants were instructed to perform the tasks at their preferred pace without using their arms (hands placed on hips). Participants placed each foot on a separate force platform (AMTI, Watertown, MA, USA) in a fixed position during the entire test. There was a short (~3–5 second) pause in the standing posture between rising and sitting movements and in the seated posture between sitting and rising movements. A 23-camera motion capture system (Vicon, Oxford, UK) captured full-body kinematics including three-dimensional pelvic and thoracic rotations and pelvic center of mass translation via 70 retro-reflective markers. Kinematic data were low-pass filtered (Butterworth, cutoff frequency 6 Hz). Specifically, three-dimensional kinematic data of the pelvis and thorax were collected by tracking (120Hz) reflective markers positioned in the mid-sagittal plane over the S1, T10, and C7 spinous processes, sternal notch, and xiphoid; and bilaterally over the acromion, and the anterior/posterior superior iliac spines.
Modeling Study
A detailed description of the modeling procedures can be found in our earlier studies (Hendershot et al., 2018; Shojaei et al., 2015; Shojaei et al., 2016a). Briefly, a non-linear finite element model of the spine was used to estimate trunk muscle forces required to complete the activity and the resultant spinal loads using an optimization-based iterative procedure (Bazrgari et al., 2007; Shojaei et al., 2015). The finite element model composed of six rigid elements, representing the thorax (T1-T12) and each lumbar vertebra (L1-L5), and six flexible non-linear beam elements characterizing the non-linear stiffness of each lumbar motion segment between T12 and S1 vertebrae (Fig. 1). The stiffness of beam elements was defined using non-linear axial force vs. strain as well as moment vs. rotation relationships in three planes of motion (Fig. 1) based on results from earlier experimental and numerical studies on lumbar motion segments (Bazrgari et al., 2008a). Damping of lumbar motion segments, with properties defined from earlier experimental studies, were simulated using connector elements (Bazrgari et al., 2008a). Upper-body mass and mass moments of inertia, adjusted based on participant’s body mass, were distributed across the spine according to reported ratios (Pearsall et al., 1996). The symmetric trunk musculature included 46 local muscles connecting lumbar vertebrae to the pelvis and 10 global muscles connecting thorax/rib cage to the pelvis. To estimate the muscle forces required for satisfaction of equilibrium at all levels of lumbar spine, kinematic data of lumbar vertebrae along with the pelvic and thoracic kinematics should be input to the model. While the kinematics of pelvis and thorax were readily available from measurement, kinematics of the lumbar vertebrae had to be estimated. Given that contributions of lumbar motion segments to the total deformation of lumbar spine change with posture and loads in hands (Shojaei et al., 2015), we did not use the traditional method of using fixed ratios to distribute lumbar deformation, obtained from measurements, between its segments. Instead, we have developed and validated a heuristics optimization procedure in MATLAB (The MathWorks Inc., Natick, MA, USA, Version 8.6) wherein the finite element model is used to find a set of lumbar segmental kinematics that when prescribed to the model results in prediction of muscle forces that minimizes the cost function of the optimization procedure (i.e., sum of squared muscle stress across all lower back muscles) (Shojaei et al., 2015). The final set of muscle forces from the heuristic optimization procedure is then used to estimate spinal loads. Specifically, the vector summation of internal muscle forces and external gravitational and inertial forces were used to calculate compression force as well as medio-lateral and antero-posterior shear forces at all levels of lumbar spine.
Figure 1.

The finite element model of the lumbar spine consisted of six deformable beam elements and 7 rigid body elements (top-left). Beam element represented mechanical behavior of lumbar spine motion segments (bottom). The muscle architecture used to offset the gravitational and inertial demand of the activity included 10 global (attached to thoracic spine) and 46 local (attached to the lumbar spine) muscles (top-right). ICpl: iliocostalislumborum pars lumborum, ICpt: iliocostalislumbroum pars thoracis, IP: iliopsoas, LGpl: longissimusthoracis pars lumborum, LGpt: longissimusthoracis pars thoracis, MF: multifidus, QL: quadratuslumborum, IO: internal oblique, EO: external oblique and RA: rectus abdominus.
Statistical analyses
Rather than considering 56 individual muscle forces as outcome measures, the separate scalar summation of forces (i.e., representing total energy consumption) in 10 global and 46 local muscles (hereafter called equivalent global and local muscle forces, respectively) were used for statistical analyses. Similarly, rather than comparing spinal loads at each level between the groups, the levels with highest spinal loads (i.e., happened to always be L5-S1 level for shear forces but L5-S1 or L5-L4 level for compression force) were considered for statistical analyses. Also, to avoid the possibility of force cancelation for time instants that medio-lateral shear force has different signs among participants of one group, the absolute values of medio-lateral shear forces were compared between the groups. Separate mixed-model ANOVA tests for peak and mean values of outcome measures (i.e., compression force, medio-lateral shear force, antero-posterior shear force, equivalent global muscle force, and equivalent local muscle force) were used with group (control and LLA) as between-subjects factor and task phase (rising and sitting) as within-subject factors to investigate the differences between the group and task phases. All statistical procedures were conducted in SPSS (IBM SMSS Statistics 24, Armonk, NY, USA), assumptions for mixed- model ANOVA were verified, and significance was set at p ≤ 0.05.
Results
For the control group, peak trunk rotations experienced in the sagittal, frontal, and transverse planes of motion were respectively 38.0°, 1.8°, and 2.6° during the rising phase, and 40.5°, 3.0°, and 3.0° during the sitting phase (Fig. 2 and 3). For persons with LLA, the corresponding values were respectively 2.8°, 11.1°, and 9.2° larger during rising and 2.5°, 11.0°, and 9.8° larger during sitting (Fig. 2 and 3). While the peak trunk angular velocity was comparable (average 74°/s and <5% difference) between the groups in the sagittal plane, velocities were ~ five times larger in the frontal (35°/s vs. 7°/s) and transverse (33°/s vs. 7°/s) planes for persons with LLA. The peak trunk angular accelerations were comparable between groups in the sagittal plane (average 370°/s2 and <10% difference), but they were ~ two (59°/s2 vs. 26°/s2) and ~ four (76°/s2 vs. 20°/s2) times larger in the frontal and transverse planes for persons with LLA.
Figure 2:
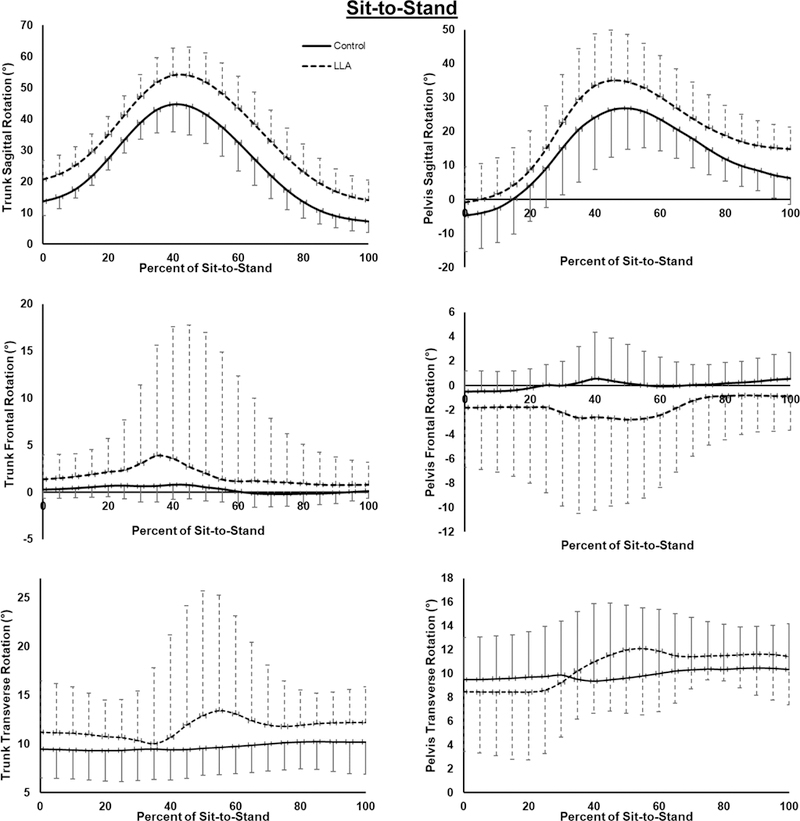
Ensemble curves for angular rotations of trunk and pelvis at each instant of the sit-to-stand (i.e., rising) phase of task. For the sake of averaging, outcome measures are depicted as functions of task cycle (i.e., 0-100% for each phase of task).
Figure 3:
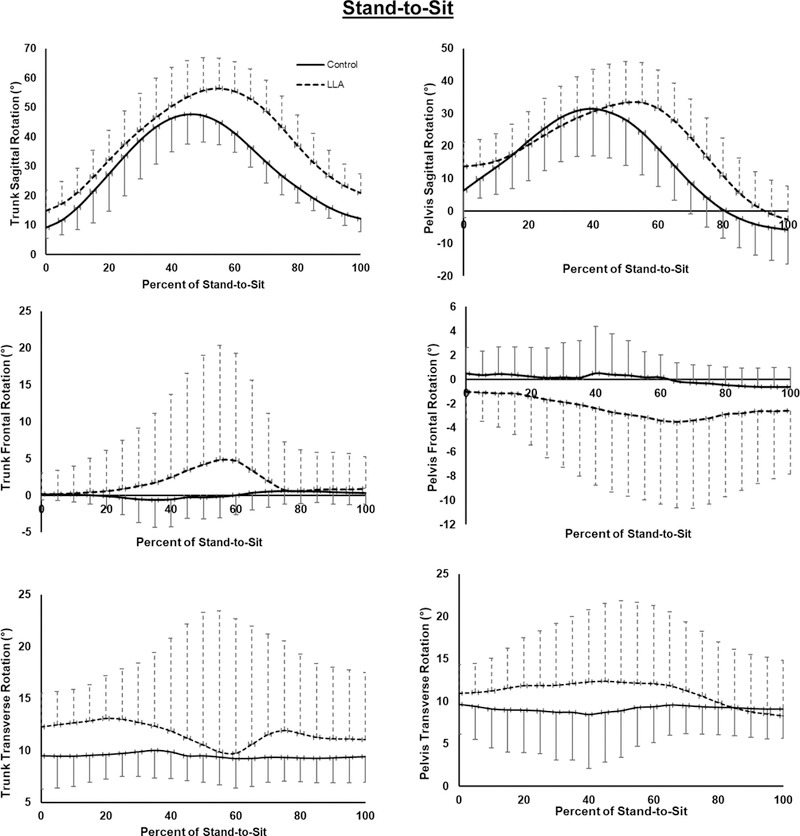
Ensemble curves for angular rotations of trunk and pelvis at each instant of the stand-to-sit (i.e., sitting) phase of task. For the sake of averaging, outcome measures are depicted as functions of task cycle (i.e., 0-100% for each phase of task).
Temporal changes in equivalent muscle forces and spinal loads during rising and sitting phases for each group are presented (Fig. 4 and 5).
Figure 4:

Ensemble curves for equivalent muscle forces and maximum spinal loads at each instant of the sit-to-stand (i.e., rising) phase of task. For the sake of averaging, outcome measures are depicted as functions of task cycle (i.e., 0-100% for each phase of task). The maximum shear forces consistently occurred at the L5-S1 level for all subjects whereas the maximum compression force occurred either at the L5-S1 or the L5-L4 levels depending on the subject or time during the task.
Figure 5:

Ensemble curves for equivalent muscle forces and maximum spinal loads at each instant of the stand-to-sit (i.e., sitting) phase of task. For the sake of averaging, outcome measures are depicted as functions of task cycle (i.e., 0–100% for each phase of task). The maximum shear forces consistently occurred at the L5-S1 level for all subjects whereas the maximum compression force occurred either at the L5-S1 or the L5-L4 levels depending on the subject or time during the task.
Interaction Effects
During rising, the simple effects of group on peak medio-lateral shear force were significant (F = 6.95, p = 0.017) such that the shear force was larger in persons with LLA (480 (104) N) vs. controls (211 (103) N). Furtheremore, the simple effects of task phase (rising vs. sitting) on peak (265 (89) N vs. 480 (104) N) and mean (74 (22) N vs. 142 (41) N) medio-lateral shear force were significant (F > 5.46, p < 0.048) only for persons with LLA.
Main Effects
Peak compression and antero-posterior shear forces were respectively 348N and 217N larger in persons with vs without LLA (Table 1 and Table 2). Also, mean compression and medio-lateral shear forces as well as mean equivalent global muscle force were respectively 171N, 53N, and 145N larger in the persons with LLA (Table 1 and Table 2). Finally, the mean equivalent local muscle force (Table 1) was 57N larger during sitting versus rising phase of task (Table 2).
Table 1:
Summary of statistical results for differences in spinal loads and muscle forces between groups (persons with LLA and controls) and task phases (sit-to-stand and stand-to-sit).
| Peak Values of Dependent Variables during the Task | ||||||||||
|---|---|---|---|---|---|---|---|---|---|---|
|
Compression force |
Medio-lateral Shear force |
Antero-posterior Shear force |
Equivalent Global Muscle |
Equivalent Local Muscle |
||||||
| F | p | F | p | F | p | F | p | F | p | |
| Group (G) | 3.95 | 0.047 | 5.45 | 0.032 | 6.37 | 0.022 | 2.72 | 0.117 | 1.32 | 0.267 |
| Phase (P) | 1.89 | 0.187 | 3.95 | 0.063 | 2.87 | 0.109 | 1.67 | 0.213 | 2.80 | 0.112 |
| G X P | 3.79 | 0.068 | 5.70 | 0.029 | 0.68 | 0.421 | 3.53 | 0.078 | 0.07 | 0.792 |
| Mean Values of Dependent Variables during the Task | ||||||||||
|
Compression force |
Medio-lateral Shear force |
Antero-posterior Shear force |
Equivalent Global Muscle |
Equivalent Local Muscle |
||||||
| F | p | F | p | F | p | F | p | F | p | |
| Group (G) | 6.79 | 0.018 | 22.62 | <0.001 | 3.43 | 0.082 | 5.56 | 0.031 | 0.37 | 0.553 |
| Phase (P) | 0.85 | 0.369 | 18.87 | <0.001 | 1.33 | 0.265 | 3.73 | 0.070 | 5.84 | 0.027 |
| G X P | 0.39 | 0.541 | 11.38 | 0.004 | 0.34 | 0.565 | 2.64 | 0.123 | 0.05 | 0.829 |
Boldface indicates significant effect
Table 2:
Mean (SD) outcome measures for both groups (persons with LLA and controls) and both phases of task (sit-to-stand and stand-to-sit).
| Spinal Loads and Muscle Forces (N) |
Group | Task Phase | |||
|---|---|---|---|---|---|
| LLA | Control | Sit-to-Stand | Stand-to-Sit | ||
| Peak | Compression force | 2556 (731) | 2208 (421) | 2262 (440) | 2502 (732) |
| Medio-lateral Shear force | 373 (144) | 221 (118) | 248 (114) | 346 (156) | |
| Antro-posterior Shear force | 1111 (195) | 894 (145) | 1085 (181) | 920 (187) | |
| Equivalent Global Muscle | 2065 (888) | 1658 (522) | 1729 (523) | 1994 (903) | |
| Equivalent Local Muscle | 758 (193) | 704 (151) | 680 (133) | 783 (193) | |
| Mean | Compression force | 1554 (196) | 1383 (158) | 1445 (175) | 1492 (215) |
| Medio-lateral Shear force | 108 (39) | 55 (27) | 62 (26) | 101 (35) | |
| Antro-posterior Shear force | 696 (92) | 642 (86) | 685 (93) | 652 (90) | |
| Equivalent Global Muscle | 793 (170) | 648 (162) | 680 (151) | 761 (200) | |
| Equivalent Local Muscle | 456 (78) | 440 (82) | 420 (63) | 477 (85) | |
Discussion
The purpose of this study was to quantify and compare trunk muscle forces and spinal loads in persons with vs. without unilateral (transfemoral) LLA during sit-to-stand and stand-to-sit tasks. In agreement with the study hypothesis, trunk muscle forces and spinal loads were larger among persons with LLA during both phases of the task.
To date, there is only one study that has reported muscle forces and the resultant spinal loads during sit-to-stand activities among persons with and without unilateral (transtibial) LLA (Actis et al., 2018), reporting larger peak and mean compression forces in persons with LLA of ~ 3.98 (vs. ~3.41) and ~ 2.20 (vs. 1.82) body weight (BW). Considering larger trunk-pelvic motions with more proximal LLA, persons with transfemoral vs. transtibial LLA are expected to experience larger spinal loads during activities of daily living (Hendershot et al., 2018). However, the results of the present study (i.e., smaller spinal loads in persons with transfemoral LLA vs. those with transtibial LLA reported by Actis et al (2018)) contradict such an expected outcome. Setting aside differences in experimental protocol, this may, in part, be due to the absence of ligamentous spine stiffness in the model used by Actis et al. (2018). Given the amount of lumbar deformation involved during the sit-to-stand task, such an assumption would result in much larger errors when predicting muscles forces and spinal loads as compared to tasks involving smaller lumbar deformation (e.g., walking; Yoder et al., 2015). Another reason for the larger spinal loads reported by Actis et al. (2018) could be the assumptions made for distribution of lumbar deformation among lumbar motion segments. Such assumptions, as discussed in an earlier work (Shojaei et al., 2015), restrict the available solution space for the optimization procedure used to predict muscle forces, resulting in predicted muscle forces that are likely larger than optimal (Shojaei et al., 2015). Finally, age-related differences in lumbo-pelvic coordination (Shojaei et al., 2016b; Vazirian et al., 2017) could have also contributed to differences in reported spinal loads in persons with LLA between the two studies (44 years vs. 28 years in the present study). Furthermore, there are also reports of spinal loads during upright standing and sitting in different postures (Rohlmann et al., 2001; Rohlmann et al., 1999; Sato et al., 1999; Wilke et al., 1999); though these results are mixed with spinal loads ranging from 11% smaller to 21% larger in sitting vs. standing (Dreischarf et al., 2010). Of note, Dreischarf et al. (2010) investigated the reason for such inconsistency and concluded that the sit/stand ratio of spinal loads can vary from ~ 1.0 to ~ 2.3 depending on the arm position (hanging or on thighs) and spinal posture/alignment (lordosis or kyphosis).
Kinetic analyses of sit-to-stand and vice versa have been conducted in earlier studies using analysis of force plate data or estimation of mechanical demands at lower limb and L5-L1 spinal levels for asymptomatic individuals, patients with LBP, and persons with LLA. Peak ground reaction forces have been reported to be ~ 30% (Agrawal et al., 2011; Ferris et al., 2017) larger for intact vs. non-intact limb in persons with transtibial LLA during sit-to-stand task, whereas the asymmetry in ground reaction forces has been shown to be <10% for uninjured persons during the same task (Özyürek et al., 2014). Using a 15-segment rigid body biomechanical model, Hendershot and Wolf (2015) reported ~ 30% (~ 170Nm vs. ~ 130Nm) larger moment demand at the L5-S1 level in persons with versus without LLA during sit-to-stand and vice versa. In a study on differences in moment demand of sit-to-stand and stand-to-sit between persons with and without LBP, Shum et al. (2007) reported a maximum net moment of 90 Nm for asymptomatic individuals. The difference in moment demand at the lower back between the control groups of the above two studies (i.e., 130Nm vs. 90Nm) could be due to differences in the experimental conditions (e.g., stool height: a height causing 90-degree flexion of knees vs. a height equal to 110% of knee-floor length), participants characteristics (e.g., ~ 26kg and ~ 17cm difference in body mass and stature of participants, a mixture of males and females in the second study), and modeling approaches (e.g., a 15-segment vs. a 7-segment biomechanical model; Hendershot and Wolf, 2015; Shum et al., 2007). While these kinetics-focused studies characterized the differences in biomechanics of the lower back in impaired vs. uninjured individuals during sit-to-stand and stand-to-sit tasks, they provide little insight into the differences in the mechanical environment of the lower back (e.g., forces experienced in lower back tissues). The detailed finite element model of spine and trunk muscles in the present study provides further insight regarding such biomechanical differences in persons with and without LLA. For instance, our results suggest that the observed larger out-of-plane trunk kinematics in persons with LLA caused ~ 10% to ~ 130% increases in different components of spinal loads (i.e., shearing versus compressive) at the L5-S1 level. Considering minimal differences in peak trunk angular acceleration between the groups when performing sit-to-stand and stand-to-sit, the contribution of inertial forces into such increase in components of spinal loads is likely minimal (Bazrgari et al., 2008b).
The maximum compression force (i.e., 2.6 kN) at the lower spinal level of persons with LLA during sit-to-stand and vice versa, though larger than controls, was much smaller than the reported threshold of spinal tissues injury (i.e., 5–10 kN). Such an elevated magnitude of compression force during sit-to-stand and vice versa therefore does not pose an immediate risk of spinal tissue injury in persons with LLA. However, repeated exposure to larger compression force highlights the risk of spinal tissue injury due to fatigue failure when considering that person with LLA also experience larger compressive spinal loads under other basic but repetitive activities of daily living like walking (Hendershot et al 2018; Shojaei et al 2016a). On the other hand, the maximum value of antero-posterior shear force (~ 1.1 kN) experienced at the lower back of persons with LLA during sit-to-stand and stand-to-sit tasks was within the reported range (i.e., 1–2 kN) of injury threshold for lumbar spine motion segments (Adams et al., 2006) but exceeded the suggested “Maximum Permissible” Limit of 1 kN for single exertions (McGill et al., 1998).
The persons with LLA in this study were young and physically-fit military with transfemoral amputations resulting from traumatic injuries. Therefore, the findings may not be generalized to individuals with different levels or etiologies of amputations. The cross-sectional design of the study does not provide any information about biomechanics of lower back in the persons with LLA before the amputations; also, history of LBP was not controlled. Therefore, there are chances that the observed trunk biomechanical differences between the two groups were not exclusively due to the amputations. Additionally, the armless, backless stool used in this study is not representative of chairs typically used in daily living. As differences in chair design can affect how rising and sitting motions are performed, the results here may not be generalizable to all sitting down/standing up activities. Since we did not have access to subject-specific mechanical behavior of lower back passive tissues (e.g., ligaments, intervertebral discs), similar mechanical behavior of these tissues was used for all individuals in the non-linear FE model of the spine. Adaptive changes in active and passive behaviors of lower back tissues are likely to occur in person with LLA over time due to asymmetries in trunk motion and the resultant asymmetries in stress and strain distributions within the lower back tissue. Consistently, we have reported asymmetries in trunk intrinsic stiffness and reflexive behavior (Hendershot et al., 2013) as well as abnormalities in flexion-relaxation response in individuals with unilateral LLA (Hendershot and Nussbaum 2014). The estimation of trunk muscle forces in the present work was based on equilibrium requirements of the spine (mainly governed by input kinematics and kinetics) and hence is not expected to have been affected by such asymmetries in mechanical behavior of lower back tissues. Such asymmetries, however, are expected to affect the estimation of spinal loads if a stability requirement was also implemented in the model. Finally, we compared the absolute values of medio-lateral shear forces between the groups (to avoid the possibility of force cancelation among participants of one group). Such an approach, while helpful for a general assessment of risk of fatigue failure, hinders future investigation of the effects of amputation side on asymmetries in medio-lateral shear forces.
The larger and asymmetric trunk kinematics in persons with LLA during sit-to-stand and stand-to-sit tasks resulted in larger peak (up to 348N) and mean (up to 171N) values of spinal loads when compared to controls. The values of spinal loads for persons with LLA during sit-to-stand and stand-to sit tasks (~2.6 kN) were generally smaller than the reported threshold of spinal tissues injury. However, persons with LLA also experience larger spinal loads during walking that, similar to the task investigated in this study, is a common but repetitive activity of daily living. Repetitive and prolonged exposure to larger-than-normal spinal loads likely increases risk of fatigue failure in spinal tissues.
HIGHLIGHTS:
Increased spinal loads across daily activities may cause fatigue failure of spine
Transfemoral amputees experience larger spinal loads during walking than controls
Spinal loads during sit-to-stand and vice versa were estimated for them
Transfemoral amputees experienced larger peak and mean spinal loads than controls
Results further confirmed the risk of cumulative damage in spine of amputees
Acknowledgements
This work was supported, in part, by an award (5R03HD086512–02) from the National Center for Medical Rehabilitation Research (NIH-NICHD) and the Office of the Assistant Secretary of Defense for Health Affairs, through the Peer Reviewed Orthopaedic Research Program (award #W81XWH-14–2-0144). The views expressed in this manuscript are those of the authors, and do not necessarily reflect the official policy or position of the U.S. Departments of the Army, Defense, nor the U.S. government. The identification of specific products or scientific instrumentation is considered an integral part of the scientific endeavor and does not constitute endorsement or implied endorsement on the part of the authors, Department of Defense, or any component agency.
Footnotes
Publisher's Disclaimer: This is a PDF file of an unedited manuscript that has been accepted for publication. As a service to our customers we are providing this early version of the manuscript. The manuscript will undergo copyediting, typesetting, and review of the resulting proof before it is published in its final citable form. Please note that during the production process errors may be discovered which could affect the content, and all legal disclaimers that apply to the journal pertain.
References
- Actis JA, Nolasco LA, Gates DH, Silverman AK, 2018. Lumbar loads and trunk kinematics in people with a transtibial amputation during sit-to-stand. J. Biomech. 69, 1–9. [DOI] [PubMed] [Google Scholar]
- Adams MA, Burton K, Bogduk N, 2006. The biomechanics of back pain. Elsevier health sciences. [Google Scholar]
- Agrawal V, Gailey R, Gaunaurd I, Gailey R III, O’Toole C, 2011. Weight distribution symmetry during the sit-to-stand movement of unilateral transtibial amputees. Ergonomics 54, 656–664. [DOI] [PubMed] [Google Scholar]
- Bazrgari B, Shirazi-Adl A, Arjmand N, 2007. Analysis of squat and stoop dynamic liftings: muscle forces and internal spinal loads. Eur. Spine J. 16, 687–699. [DOI] [PMC free article] [PubMed] [Google Scholar]
- Bazrgari B, Shirazi-Adl A, Kasra M, 2008a. Seated whole body vibrations with high-magnitude accelerations—relative roles of inertia and muscle forces. J. Biomech. 41, 2639–2646. [DOI] [PubMed] [Google Scholar]
- Bazrgari B, Shirazi-Adl A, Trottier M, Mathieu P, 2008b. Computation of trunk equilibrium and stability in free flexion-extension movements at different velocities. J. Biomech. 41, 412–421. [DOI] [PubMed] [Google Scholar]
- Bussmann JB, Schrauwen HJ, Stam HJ, 2008. Daily physical activity and heart rate response in people with a unilateral traumatic transtibial amputation. Arch. Phys. Med. Rehabil. 89, 430–434. [DOI] [PubMed] [Google Scholar]
- Cappozzo A, Gazzani F, 1982. Spinal loading during abnormal walking, Biomechanics: Principles and Applications. Springer, pp. 141–148. [Google Scholar]
- Coenen P, Kingma I, Boot CR, Bongers PM, van Dieën JH, 2014. Cumulative mechanical low-back load at work is a determinant of low-back pain. Occup. Environ. Med. 71, 332–337. [DOI] [PubMed] [Google Scholar]
- Dreischarf M, Bergmann G, Wilke H-J, Rohlmann A, 2010. Different arm positions and the shape of the thoracic spine can explain contradictory results in the literature about spinal loads for sitting and standing. Spine (Phila Pa 1976) 35, 2015–2021. [DOI] [PubMed] [Google Scholar]
- Ferris AE, Christiansen CL, Heise GD, Hahn D, Smith JD, 2017. Ertl and Non-Ertl amputees exhibit functional biomechanical differences during the sit-to-stand task. Clin. Biomech. 44, 1–6. [DOI] [PubMed] [Google Scholar]
- Granata K, 1995. Model of Axial Twisting in the Thoracolumbar Spine. Spine (Phila Pa 1976) 20, 1440–1451. [DOI] [PubMed] [Google Scholar]
- Hendershot BD, Bazrgari B, Nussbaum MA, 2013. Persons with unilateral lower-limb amputation have altered and asymmetric trunk mechanical and neuromuscular behaviors estimated using multidirectional trunk perturbations. J. Biomech. 46, 1907–1912. [DOI] [PubMed] [Google Scholar]
- Hendershot BD, Nussbaum MA, 2014. Altered flexion-relaxation responses exist during asymmetric trunk flexion movements among persons with unilateral lower-limb amputation. J. Electromyogr. Kinesiol. 24, 120–125. [DOI] [PubMed] [Google Scholar]
- Hendershot BD, Shojaei I, Acasio JC, Dearth CL, Bazrgari B, 2018. Walking speed differentially alters spinal loads in persons with traumatic lower limb amputation. J. Biomech. 70, 249–254. [DOI] [PMC free article] [PubMed] [Google Scholar]
- Hendershot BD, Wolf EJ, 2014. Three-dimensional joint reaction forces and moments at the low back during over-ground walking in persons with unilateral lower-extremity amputation. Clin. Biomech. 29, 235–242. [DOI] [PubMed] [Google Scholar]
- Hendershot BD, Wolf EJ, 2015. Persons with unilateral transfemoral amputation have altered lumbosacral kinetics during sitting and standing movements. Gait Posture 42, 204–209. [DOI] [PubMed] [Google Scholar]
- Kumar S, 1990. Cumulative load as a risk factor for back pain. Spine (Phila Pa 1976) 15, 1311–1316. [DOI] [PubMed] [Google Scholar]
- Özyürek S, Demirbüken İ, Angin S, 2014. Altered movement strategies in sit-to-stand task in persons with transtibial amputation. Prosthet. Orthot. Int. 38, 303–309. [DOI] [PubMed] [Google Scholar]
- Pearsall DJ, Reid JG, Livingston LA, 1996. Segmental inertial parameters of the human trunk as determined from computed tomography. Ann. Biomed. Eng. 24, 198–210. [DOI] [PubMed] [Google Scholar]
- Rohlmann A, Arntz U, Graichen F, Bergmann G, 2001. Loads on an internal spinal fixation device during sitting. J. Biomech. 34, 989–993. [DOI] [PubMed] [Google Scholar]
- Rohlmann A, Bergmann G, Graichen F, 1999. Loads on internal spinal fixators measured in different body positions. Eur. Spine J. 8, 354–359. [DOI] [PMC free article] [PubMed] [Google Scholar]
- Rueda FM, Diego IMA, Sánchez AM, Tejada MC, Montero FMR, Page JCM, 2013. Knee and hip internal moments and upper-body kinematics in the frontal plane in unilateral transtibial amputees. Gait Posture 37, 436–439. [DOI] [PubMed] [Google Scholar]
- Sagawa Y, Turcot K, Armand S, Thevenon A, Vuillerme N, Watelain E, 2011. Biomechanics and physiological parameters during gait in lower-limb amputees: a systematic review. Gait Posture 33, 511–526. [DOI] [PubMed] [Google Scholar]
- Sato K, Kikuchi S, Yonezawa T, 1999. In vivo intradiscal pressure measurement in healthy individuals and in patients with ongoing back problems. Spine (Phila Pa 1976) 24, 2468. [DOI] [PubMed] [Google Scholar]
- Shojaei I, Arjmand N, Bazrgari B, 2015. An optimization-based method for prediction of lumbar spine segmental kinematics from the measurements of thorax and pelvic kinematics. Int. J. Numer. Method. Biomed. Eng. 31(12), 1–14. [DOI] [PubMed] [Google Scholar]
- Shojaei I, Hendershot BD, Wolf EJ, Bazrgari B, 2016a. Persons with unilateral transfemoral amputation experience larger spinal loads during level-ground walking compared to able-bodied individuals. Clin. Biomech. 32, 157–163. [DOI] [PMC free article] [PubMed] [Google Scholar]
- Shojaei I, Vazirian M, Croft E, Nussbaum MA, Bazrgari B, 2016b. Age related differences in mechanical demands imposed on the lower back by manual material handling tasks. J. Biomech. 49, 896–903. [DOI] [PubMed] [Google Scholar]
- Shum GL, Crosbie J, Lee RY, 2007. Three-dimensional kinetics of the lumbar spine and hips in low back pain patients during sit-to-stand and stand-to-sit. Spine (Phila Pa 1976) 32, E211–E219. [DOI] [PubMed] [Google Scholar]
- Vazirian M, Shojaei I, Agarwal A, Bazrgari B, 2017. Lumbar contribution to the trunk forward bending and backward return; age-related differences. Ergonomics 60, 967–976. [DOI] [PubMed] [Google Scholar]
- Wilke HJ, Neef P, Caimi M, Hoogland T, Claes LE, 1999. New in vivo measurements of pressures in the intervertebral disc in daily life. Spine (Phila Pa 1976) 24, 755–762. [DOI] [PubMed] [Google Scholar]
- Yoder AJ, Petrella AJ, Silverman AK, 2015. Trunk–pelvis motion, joint loads, and muscle forces during walking with a transtibial amputation. Gait Posture 41, 757–762. [DOI] [PubMed] [Google Scholar]