

Abstract
Background
This study is aimed to investigate the prognostic significance of the expression of G protein-coupled estrogen receptor (GPER) in gastric cancer tissue using bioinformatics data and immunohistochemistry.
Material/Methods
Expression of GPER mRNA in gastric cancer tissues and normal adjacent tissues was investigated using data from The Cancer Genome Atlas (TCGA), the Gene Expression Omnibus (GEO), and Oncomine database. Kaplan-Meier Plotter identified the association between GPER mRNA and prognosis. Correlation between GPER mRNA and DNA methylation used the cBioPortal for Cancer Genomics and the MethHC website. Genes co-expressed with GPER were identified from The Cancer Genome Atlas Stomach Adenocarcinoma (TCGA-STAD) underwent FunRich analysis. Immunohistochemistry and Western blot evaluated GPER protein expression in tissue microarrays (TMAs) and gastric cancer cell lines.
Results
GPER mRNA and protein levels were significantly lower in gastric cancer tissue and cells lined when compared with normal tissues and cells. The results from GSE15459 showed that patients with low levels of GPER mRNA had a reduced overall survival (OS) (P=0.013) and disease-free survival (DFS) (P=0.019). A negative correlation (r=−0.611) between GPER mRNA and DNA methylation was found using the cBioPortal and MethHC. Co-expressed epithelial-mesenchymal transformation (EMT) genes were enriched with GPER (P<0.0001). Cox regression analysis showed that GPER protein expression was an independent prognostic factor (P=0.035)
Conclusions
Downregulation of GPER predicts poor prognosis in gastric cancer. GPER may act as a tumor suppressor through the regulation of EMT in gastric cancer.
MeSH Keywords: Estrogens, Methylation, Prognosis, Stomach Neoplasms
Background
Worldwide, gastric cancer is one of the leading causes of cancer-related mortality, and more than 950,000 patients are newly diagnosed with gastric cancer each year [1]. Although advances have been made in the management of patients with gastric cancer, the clinical outcome remains poor, with a 5-year survival of less than 25% [2]. Furthermore, most patients with gastric cancer have a confirmed diagnosis made at a relatively advanced stage, resulting in a less favorable prognosis [3]. Therefore, there remains a need to identify new diagnostic and prognostic biomarkers for gastric cancer.
G protein-coupled estrogen receptor (GPER) is a novel estrogen binding receptor, which is mainly involved in nongenomic signaling pathways [4]. GPER is expressed throughout the body, including the reproductive system, the heart, and the gastrointestinal tract [5]. The levels of GPER expression are influenced by the type of tissue, the disease state, gender, and age [6]. Recent studies have shown that the activation of GPER signaling is linked to obesity, cardiac hypertrophy [7], immunosuppression, metabolic syndrome [8,9], and tumorigenesis [10]. Activation of GPER has been reported to have opposing roles in the pathogenesis and metastasis of malignant tumors. Zhou et al. [11] found that GPER was overexpressed in invasive ductal carcinoma cells of the breast. Nicolas et al. [12] reported that the upregulation of GPER promoted the proliferation of seminoma cells. He et al. [13] showed that GPER was involved in the invasion and carcinogenesis of endometrial cancer. Yan et al. [14] showed that GPER stimulated the proliferation and invasion of ovarian cancer cells. Cui et al. [15] showed that upregulation of the expression of GPER in papillary thyroid carcinoma and high levels of GPER protein were correlated with lymph node metastasis. However, studies have shown that GPER might act as a tumor suppressor in several types of human cancer, including non-small cell lung cancer (NSCLC) [16], hepatocellular carcinoma (HCC) [17], triple-negative breast cancer (TNBC) [18], melanoma [19], prostate cancer [20] and cervical cancer [21]. However, the association between GPER expression and clinical outcome in patients with gastric cancer remains to be investigated.
Therefore, this study is aimed to investigate the prognostic significance of the expression of GPER in gastric cancer tissue using bioinformatics data and immunohistochemistry. The expression of GPER mRNA and protein in gastric cancer tissues and matched adjacent normal tissues were studied. In addition to GPER DNA methylation and mRNA expression, enrichment analysis of co-expressed genes with GPER was conducted to identify signaling pathways.
Material and Methods
Patients and follow-up
Gastric cancer tissue and matched adjacent normal gastric tissue were obtained from 84 patients with gastric cancer who received underwent surgical resection at the Surgery Department of Renmin Hospital of Wuhan University between January 2013 and December 2015. All patients were asked to provide a written informed consent. Patients who died within one month after surgery, or underwent radiotherapy or chemotherapy before surgery were excluded from the study. Clinicopathological data, including patient age, gender, tumor grade (G), and staging using the T, N, M staging system of the American Joint Committee on Cancer (AJCC) [22], were acquired from hospital electronic record system. Postoperative follow-up was performed every three months during the first three years and twice a year after three years of follow-up. Overall survival (OS) was defined as the period from the time of definitive diagnosis of gastric cancer to the end of clinical follow-up, or death. This study was approved by the Institutional Review Board (IRB) of Renmin Hospital of Wuhan University.
Construction of tissue microarray and culture of cell lines
Representative samples from gastric cancer tissue and matched adjacent normal gastric tissue were selected for the construction of the tissue microarrays (TMAs), which were prepared according to the method previously reported [23]. Briefly, a 1.5 mm diameter core for each tissue sample was included in the TMA to included 84 samples of gastric cancer tissues and matched adjacent normal gastric tissue. Three human gastric cancer cell lines, HGC-27, MGC-803, SGC-7901, and one normal human gastric epithelial cell line, GES-1, were donated by the China Center for Type Culture Collection. The cell lines were cultured in DMEM/F-12 (1: 1) (Hyclone, Logan, UT, USA), supplemented with 10% fetal bovine serum (FBS) (Gibco, Thermofisher Scientific, Waltham, MA, USA) at 37°C in an incubator containing 5% CO2.
Immunohistochemistry
The method of immunohistochemistry staining was conducted as previously described [24]. Deparaffinized tissue sections from the formalin-fixed, paraffin wax-embedded tissue blocks containing the TMAs were washed with 3% H2O2, then subjected to antigen retrieval by citric acid at pH 6.0. After overnight incubation at 4°C with the primary antibody to G protein-coupled estrogen receptor (GPER) (ab39742) (1: 200 (Abcam, Cambridge, MA, USA), the sections were incubated for fifteen minutes at room temperature with horseradish peroxidase (HRP)-conjugated secondary antibody using a MaxVision™ kits (Maxim Bio, Fujian, China). After incubation for one minute with 3,3′-diaminobenzidine (DAB), the tissue sections were counterstained with hematoxylin. For the negative control, PBS was substituted for the primary antibody.
The immunostained TMA tissue sections were evaluated by two expert pathologists who were unaware of the patients’ clinical information. A semiquantitative scoring system was applied to assess the results of the immunohistochemical staining according to the intensity of staining (IS) and the area of positivity (AP). IS was graded as 0 (negative), 1 (weak), 2 (moderate), and 3 (strong). AP was determined as the percentage of positive-stained cells: 0 (0%), 1 (1–25%), 2 (26–50%), 3 (≥51%). A total H-score was obtained by multiplying AP with IS. The cut-off value of the H-score was 4 points according to Kaplan-Meier curves. If the H-score was <4 points, the result was interpreted as low expression; if the H-score was >4 points, the result was interpreted as high expression. A cutoff value for the GPER expression score was determined using the chi-squared (χ2) test and Kaplan-Meier curves which were statistically correlated with overall survival (OS).
Western blot
Proteins were extracted from the four gastric cell lines, HGC-27, MGC-803, SGC-7901, and GES-1, with RIPA buffer. Aliquots of protein were separated on 10% sodium dodecyl sulfate–polyacrylamide (SDS-PAGE) gels and transferred to polyvinylidene difluoride (PVDF) membranes. A primary GPER antibody (ab39742) (1: 250) (Abcam, Cambridge, MA, USA) was used. The levels of GPER protein were normalized to GAPDH on the same PVDF membranes (Merck Millipore, Burlington, MA, USA).
Bioinformatics analysis
GPER mRNA expression data were downloaded from the public database of RNA sequencing data in The Cancer Genome Atlas (TCGA) and Gene Expression Omnibus (GEO). The Oncomine database (http://www.oncomine.org) was used to further evaluate GPER mRNA expression in gastric cancer tissue and matched adjacent normal gastric tissue. The online tool Kaplan-Meier Plotter (http://kmplot.com/analysis/) was used to investigate the association between GPER mRNA expression and clinical prognosis in patients with gastric cancer. The correlation between GPER mRNA expression and DNA promoter methylation was determined using the MethHC website (http://methhc.mbc.nctu.edu.tw/php/index.php) and the cBioPortal for Cancer Genomics website (http://www.cbioportal.org/). The cBioPortal website was searched to identify the genes that were co-expressed with GPER in The Cancer Genome Atlas Stomach Adenocarcinoma (TCGA-STAD) (absolute Spearman’s r >0.5) and these identified genes underwent FunRich (version 3.1.3) enrichment analysis.
Statistical analysis
Data were analyzed using SPSS version 20.0 software (IBM Inc., Chicago, IL, USA). Student’s t-test was used to examine the differential expression of GPER mRNA in gastric cancer tissue and matched adjacent normal gastric tissue. Receiver operating characteristic (ROC) curves were used to assess the diagnostic value of GPER mRNA for gastric cancer. Pearson’s chi-squared (χ2) test was used to evaluate the correlation between GPER expression and clinicopathological data. The log-rank test was applied to determine whether GPER protein expression was associated with the overall survival (OS) in patients with gastric cancer. Cox regression analysis was performed to identify whether the expression of GPER protein was an independent risk factor for survival of patients with gastric cancer. Graphical data was presented using GraphPad Prism 5 software (GraphPad Software, La Jolla, CA, USA). A P-value <0.05 was considered to be statistically significant.
Results
Differential expression of GPER mRNA in gastric cancer tissue and matched adjacent normal gastric tissue
The Cancer Genome Atlas Stomach Adenocarcinoma (TCGA-STAD) dataset contained 351 cases of gastric cancer and 31 matched adjacent normal gastric tissues. Analysis of TCGA-STAD showed that the levels of G protein-coupled estrogen receptor (GPER) mRNA were significantly lower in gastric cancer tissues compared with matched adjacent normal gastric tissue (P<0.0001). Also, GPER was downregulated in gastric cancer tissue compared with matched adjacent normal gastric tissue from the GSE29272 dataset which comprised of 134 cases of paired samples (P<0.0001). The Oncomine database website was used to investigate the expression of GPER in four additional datasets. In the Cho Gastric dataset (fold change, −9.393, P<0.0001), the Cui Gastric dataset (fold change,−2.432, P<0.0001), the D’Errico Gastric dataset (fold change, −6.837, P<0.0001) and the Wang Gastric dataset (fold change, −4.538, P<0.0001), levels of GPER expression were significantly lower in gastric cancer tissue when compared with matched adjacent normal gastric tissue (Figure 1), indicating that this gene was downregulated during tumorigenesis in gastric cancer.
Figure 1.

The levels of G protein-coupled estrogen receptor (GPER) mRNA were downregulated in gastric cancer tissues compared with matched adjacent normal gastric tissues based on six datasets. (A) The Cancer Genome Atlas Stomach Adenocarcinoma (TCGA-STAD) data. (B) The GSE29282 data. (C) The Cho Gastric data. (D) The Cui Gastric data. (E) The D’Errico gastric data. (F) The Wang gastric data.
The diagnostic value of GPER mRNA expression in gastric cancer
There was a significant difference in GPER mRNA expression between gastric cancer and normal gastric tissues. Receiver operating characteristic (ROC) curve analysis showed good diagnostic values for gastric cancer, including area under the curve (AUC) values. Data from the TCGA-STAD dataset showed that GPER mRNA expression was a significant diagnostic factor for gastric cancer (AUC=0.8133; 95% CI, 0.738–0.8879; P<0.001) (Figure 2). For the GSE29272 dataset, when the cut-off value of GPER mRNA was 7.41, GPER mRNA could effectively differentiate gastric cancer from normal tissues with a sensitivity of 92.54% and a specificity of 85.075% (AUC=0.9562; 95% CI, 0.9352–0.9772; P<0.001). For the remaining four datasets studied, the AUC was 0.983 in the Cho Gastric dataset (P<0.001), 0.8117 in the Cui Gastric dataset (P<0.001), 0.8566 in the D’Errico Gastric dataset (P<0.001) and 0.850 in the Wang Gastric dataset (P=0.00213) (Table 1). Based on the above data, GPER mRNA expression might be used as a new biomarker to distinguish between gastric cancer tissue and matched adjacent normal gastric tissue.
Figure 2.

Low levels of G protein-coupled estrogen receptor (GPER) mRNA as a diagnostic marker in patients with gastric cancer based on analysis of six datasets. (A) The Cancer Genome Atlas Stomach Adenocarcinoma (TCGA-STAD) data. (B) The GSE29282 data. (C) The Cho Gastric data. (D) The Cui Gastric data. (E) The D’Errico gastric data. (F) The Wang gastric data.
Table 1.
The diagnostic value of G protein-coupled estrogen receptor (GPER) for gastric cancer from six datasets.
| Study | Cut-off value | AUC | 95% CI | P-value | Sensitivity | Specificity |
|---|---|---|---|---|---|---|
| TCGA-STAD | 1.153 | 0.8133 | 0.738–0.8879 | <0.0001 | 70.97% | 70.09% |
| GSE29272 | 7.41 | 0.9562 | 0.9352–0.9772 | <0.0001 | 92.54% | 85.07% |
| Cho Gastric | 3.078 | 0.983 | 0.9596–1.006 | <0.0001 | 94.74% | 92.31% |
| Cui Gastric | 0.8941 | 0.8117 | 0.7418–0.8817 | <0.0001 | 78.48% | 75.95% |
| D’Errico Gastric | −1.1662 | 0.8566 | 0.7616–0.9517 | <0.0001 | 83.87% | 75.00% |
| Wang Gastric | −0.8643 | 0.850 | 0.6801–1.020 | 0.00213 | 93.33% | 75.00% |
TCGA-STAD – The Cancer Genome Atlas Stomach Adenocarcinoma; AUC – area under the curve; CI – confidence interval.
The prognostic value of GPER mRNA expression in gastric cancer
The website of the Kaplan-Meier Plotter was used to evaluate the prognostic value of GPER mRNA in gastric cancer. Kaplan-Meier survival analysis based on GSE15459 (n=200) showed that higher expression levels of GPER mRNA were significantly associated with improved overall survival (OS) (P=0.013, HR=0.58) when compared with patients with gastric cancer and low levels of expression of GPER mRNA (Figure 3). High GPER mRNA expression was correlated with improved disease-free survival (DFS) (P=0.019, HR=0.62) according to the Kaplan-Meier plots. Also, subgroup analysis by gender showed that in female patients with gastric cancer, high levels of GPER mRNA were significantly associated with a favorable OS (P=0.016, HR=0.37) and an improved DFS (P=0.025, HR=0.42). However, there was no similar correlation between the expression of GPER mRNA and OS or DFS among male patients with gastric cancer (P>0.05). Therefore, increased expression levels of GPER mRNA might be a protective factor for female patients with gastric cancer.
Figure 3.

High levels of G protein-coupled estrogen receptor (GPER) mRNA were associated with improved clinical outcome in patients with gastric cancer based on GSE15459 (n=200). (A) Correlation between GPER mRNA expression and overall survival (OS). (B) Correlation between GPER mRNA expression and OS among female patients. (C) Correlation between GPER mRNA expression and disease-free survival (DFS) among female patients. (D) Correlation between GPER mRNA expression and DFS. (E) Correlation between GPER mRNA expression and OS among male patients. (F) Correlation between GPER mRNA expression and DFS among male patients.
GPER mRNA expression was negatively regulated by DNA methylation
Using the MethHC website, a comparative plot was generated that showed that the levels of GPER DNA methylation were significantly increased in gastric cancer when compared with the matched adjacent normal gastric tissues (transcript: NM_001039966, P<0.005) (Figure 4A). Also, the association between GPER expression and DNA methylation from data obtained from the cBioPortal for Cancer Genomics website based on data from Stomach Adenocarcinoma (TCGA provision) showed a negative correlation (Spearman’s r, −0.641, P<0.05), which indicated that GPER expression was gradually reduced with the increase of GPER promoter DNA methylation (Figure 4B). Also, data were downloaded related to GPER DNA methylation from the MethHC website, which showed an association between GPER DNA methylation and OS as well as DFS (P>0.05) in patients with gastric cancer (Figure 4C, 4D).
Figure 4.

(A–D) High G protein-coupled estrogen receptor (GPER) DNA methylation in gastric cancer and GPER methylation were negatively associated with GPER expression. (A) Levels of GPER DNA methylation were much higher in gastric cancer samples than that in normal samples (P<0.005). (B) GPER DNA promoter methylation was inversely associated with the expression of GPER mRNA (Spearman’s r, −0.611).
Enrichment analysis of GPER co-expressed genes in TCGA-STAD
There were 356 genes that were co-expressed with GPER (absolute Spearman’s r >0.5) that were identified from the cBioPortal for Cancer Genomics. These genes underwent FunRich analysis for enrichment to identify the biological pathways. These co-expressed genes were mostly enriched for epithelial-mesenchymal transformation (EMT), axon guidance, muscle contraction, smooth muscle contraction, neurofascin interactions, and cell-cell communication (Figure 5). Among these biological pathways, the most significant pathway was EMT (P<0.0001) with the highest percentage of genes (30.6%), indicating that GPER might have a role in gastric cancer through the regulation of EMT.
Figure 5.

The enrichment of these co-expressed genes with G protein-coupled estrogen receptor (GPER) in biological pathways.
Correlations between GPER protein expression in gastric cancer tissue and clinicopathological features in patients with gastric cancer
Immunohistochemistry showed that GPER protein expression differed between gastric cancer tissue and matched adjacent normal gastric tissue. Tissue immunostaining for GPER protein was shown as brown particles localized in the cytoplasm and cell nucleus in epithelial cells and in some mesenchymal cells (Figure 6). In 84 gastric cancer tissues samples, 26 cases (30.95%) showed high levels of GPER expression, and 58 cases (69.05%) showed low levels of GPER expression. In 84 cases that included matched adjacent normal gastric tissue, 70 cases (83.33%) showed high expression levels of GPER, and 14 cases (16.67%) showed low expression levels of GPER. The immunohistochemistry results showed that GPER was expressed at low levels in gastric cancer tissues, but was highly expressed in matched adjacent normal gastric tissues (χ2=47.056, P<0.0001). Chi-squared (χ2) analysis showed that GPER expression was closely associated with gender (χ2=15.865, P<0.001) and tumor grade (G) (χ2=12.525, P<0.001), but no correlation with TNM stage was observed (Table 2).
Figure 6.

Photomicrographs of the immunohistochemistry showing expression of G protein-coupled estrogen receptor (GPER) protein in gastric cancer tissue and matched adjacent normal gastric tissue. (A, D) High expression in adjacent tissues (Magnification: A ×200; D ×400). (B, C, E, F) Low expression in gastric cancer cells (Magnification: B, C ×200; E, F ×400).
Table 2.
Correlation between the expression of G protein-coupled estrogen receptor (GPER) protein and clinicopathological factors.
| Parameter | GPER expression | χ2-value | P-value | ||
|---|---|---|---|---|---|
| Low (n=58) | High (n=26) | ||||
| Gender | Male | 46 | 9 | 15.865 | <0.0001* |
| Female | 12 | 17 | |||
| Age (years) | ≤60 | 35 | 17 | 1.93 | 0.666 |
| >60 | 23 | 9 | |||
| Tumor diameter | <5 cm | 40 | 18 | 0.001 | 0.981 |
| ≥5 cm | 18 | 8 | |||
| T stage | T1–T2 | 18 | 9 | 0.106 | 0.745 |
| T3–T4 | 40 | 17 | |||
| Grade (G) | G1 | 25 | 22 | 12.525 | <0.0001* |
| G2–G3 | 33 | 4 | |||
| N stage | N0 | 19 | 11 | 0.713 | 0.398 |
| N1–N3 | 39 | 15 | |||
| M stage | M0 | 39 | 22 | 2.725 | 0.099 |
| M1 | 19 | 4 | |||
| TNM stage | I–II | 27 | 15 | 0.891 | 0.345 |
| II–IV | 31 | 11 | |||
P<0.05.
Prognostic significance of GPER protein expression in gastric cancer
According to the log-rank test, based on 84 cases of gastric cancer, high expression levels of GPER were closely correlated with a favorable OS (P=0.016) (Figure 7). After univariate Cox regression analysis, patients with gastric cancer with high expression levels of GPER protein had an improved OS (P=0.026; HR=0.29; 95% CI, 0.098–0.863). After adjusting for other clinicopathological factors, including TNM stage, multivariate analysis showed that high GPER protein levels remained clinically significant as an indicator of favorable OS (P=0.035; HR=0.277; 95% CI, 0.084–0.916), which supported the view that GPER might be a novel prognostic biomarker in gastric cancer (Table 3).
Figure 7.
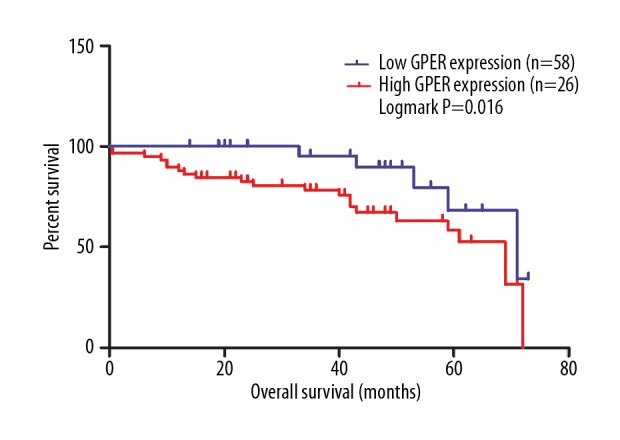
Low levels of G protein-coupled estrogen receptor (GPER) protein were significantly related with reduced overall survival (OS) in patients with gastric cancer (P=0.016).
Table 3.
Cox regression of G protein-coupled estrogen receptor (GPER) protein expression and overall survival of patients with gastric cancer.
| Clinical factor | Univariate analysis | Multivariate analysis | ||
|---|---|---|---|---|
| P-value | HR (95% CI) | P-value | HR (95% CI) | |
| Gender (Male vs. Female) | 0.736 | 0.859 (0.349–2.103) | – | – |
| Age (≤60 vs. >60) | 0.349 | 1.538 (0.572–4,138) | – | – |
| T stage (T1–T2 vs. T3–T4) | 0.045* | 7.785 (1.042–58.08) | 0.24 | 3.981 (0.398–39.801) |
| N stage (N0 vs. N1–N3) | 0.05 | 2.973 (1.001–8.832) | – | – |
| M stage (M0 vs. M1) | 0.024* | 2.669 (1.135–6.278) | 0.77 | 0.854 (0.296–2.463) |
| Grade (G) (G1 vs. G2–G3) | 0.172 | 1.874 (0.761–4.614) | – | – |
| TNM stage (I–II vs. III–IV) | 0.006* | 5.434 (1.607–18.38) | 0.162 | 2.973 (0.644–13.718) |
| Tumor diameter (≤5 cm vs. >5 cm) | 0.491 | 0.995 (0.413–2.399) | – | – |
| GPER expression (low vs. high) | 0.026* | 0.29 (0.098–0.863) | 0.035* | 0.277 (0.084–0.916) |
P<0.05.
GPER protein was downregulated in gastric cancer cell lines
Western blot was used to investigate the expression of GPER protein in three gastric cancer cell lines, MGC-803, SGC-7901, HGC-27, and in a normal gastric epithelial cell line, GES-1. The results from Western blot showed that the expression of GPER was downregulated in SGC-7901, HGC-27 and MGC-803 cell lines when compared with the GES-1 cell line (Figure 8).
Figure 8.

Downregulation of G protein-coupled estrogen receptor (GPER) protein in three gastric cancer cell lines (HGC-27, MGC-803, SGC-7901) compared with the normal gastric epithelial cell line (GES-1). The GPER protein level was significantly lower in three gastric cancer cell lines (HGC-27, MGC-803, SGC-7901) compared with the normal gastric epithelial cell line (GES-1).
Discussion
To our knowledge, this is the first study that has investigated the association between the expression of G protein-coupled estrogen receptor (GPER) and prognosis in patients with gastric cancer. The findings of this study showed that GPER expression was reduced in gastric cancer tissue, both at the level mRNA and protein, and was closely correlated with prognosis when overall survival (OS) and disease-free survival (DFS) were analyzed. Also, a negative association was found between DNA methylation and GPER expression, which indicated that GPER expression was negatively regulated by DNA methylation. In the present study, GPER was downregulated in three gastric cancer cell lines HGC-27, MGC-803, SGC-7901, when compared with the GES-1 normal gastric epithelial cell line. Based on these findings, GPER may act as a tumor suppressor regulated by DNA methylation and might be a future potential prognostic biomarker and therapeutic target for gastric cancer. However, further studies are required to investigate these potential roles for GPER in gastric cancer.
In this study, low expression of GPER mRNA was significantly associated with reduced patient survival (both OS and DFS). However, subgroup analysis by gender showed that in female patients with gastric cancer, high levels of GPER mRNA were significantly associated with a favorable OS and an improved DFS, but there was no similar correlation between the expression of GPER mRNA and OS or DFS among male patients with gastric cancer. Also, the expression levels of GPER protein were different in female patients and male patients in this study. The incidence of gastric cancer in the male population is almost twice that found in the female population [25]. Estrogenic signaling has been reported to be involved in the progression of hormone-dependent tumors, including gastric cancer [26]. GPER has a different mode of action from the classical nuclear estrogen receptors (ERα, ERβ). Studies have previously shown that ERβ has a more important role in gastric carcinogenesis than ERα through the classic genomic signaling pathway [27]. Patients with gastric cancer with positive ERβ expression have been shown to have an improved prognosis in terms of OS when compared with patients with gastric cancers that have negative or low expression of ERβ [28,29]. However, little is known about how GPER exerts its protective effects for gastric cancer. The activation of GPER by estrogen promotes to the phosphorylation of glycogen synthase kinase-3 beta (GSK-3β) and inhibition of nuclear factor-kappa B (NF-κB) signaling in breast cancer [18]. Activation of GPER has previously shown a significant effect on the immune microenvironment in hepatocellular carcinoma (HCC) [17]. In cervical cancer cells, the use of the GPER-specific agonist, G-1, resulted in sustained activation of ERK1/2 mediated by the epidermal growth factor receptor (EGFR) signaling pathway, which suppressed cell proliferation [30,31]. GPER has also previously been shown to regulate the expression of ERα [27]. The protective role of estrogen, mediated by GPER in the pathogenesis of gastric cancer, requires further investigation in future studies.
The results of the present study showed that the expression of GPER protein was reduced in the stroma of gastric cancer tissue when compared with matched adjacent normal gastric tissue. Reduced expression of GPER protein was correlated with a higher grade and stage of gastric cancer, and enrichment analysis of genes that were co-expressed with GPER showed that the most significant biological pathway was the epithelial-mesenchymal transition (EMT) pathway. Therefore, it may be proposed that GPER might act as a tumor suppressor in gastric cancer through the regulation of EMT, a multistage process in which epithelial cells lose their cell polarity and gain a mesenchymal phenotype [32]. Several published studies have now shown that EMT plays a crucial role in the development and metastasis of gastric cancer [33,34]. Also, Chen et al. [18] proposed that activation by the GPER-specific agonist G-1 inhibited EMT in triple-negative breast cancer (TNBC). Wang et al. [35] found that the overexpression of GPER could suppress the migration and invasion of osteosarcoma cells and reduce the stability of EMT-related transcription factors. Li et al. [36] reported that GPER had a key role in regulating glomerular mesangial cell function, including the production of extracellular matrix (ECM) and migration of mesangial cells. However, recent studies have investigated whether the activation of GPER could lead to the suppression of EMT during the metastasis of gastric cancer. Therefore, further studies are needed to investigate the role of GPER in the occurrence and progression of gastric cancer.
Previously published studies have evaluated the associations between GPER expression and prognosis in several types of human cancer. Klaus et al. [21] found that patients with positive cytoplasmic expression of GPER had an improved OS and increased DFS in the early stage of cervical cancer. Stefan et al. [37] showed that GPER expression combined with positive ER status was an independent prognostic factor for improved 10-year DFS in patients with breast cancer. Also, Eleftherios et al. [38] reported that the expression of cytoplasmic GPER was significantly associated with increased histologic tumor differentiation (low grade), and favorable OS in patients with primary invasive breast carcinomas. Fabian et al. [19] reported that the presence of GPER predicted a better DFS in patients with melanoma. Heublein et al. [39] found that GPER activation reduced the proliferation rate of ovarian cancer cells, and increased expression of GPER was associated with an increased OS.
The present study assessed the prognostic significance of GPER expression in patients with gastric cancer and showed that low expression of GPER mRNA or protein correlated with a reduced OS. It is possible that GPER may be involved in the occurrence and development of different tumors through diverse pathways, which explains the varied reported associations between GPER expression and clinical prognosis different types of malignant tumors. The findings of the present study demonstrated that the expression of GPER was downregulated in gastric cancer and this gene might act as a tumor suppressor gene. Gene silencing mediated by DNA hypermethylation has an important role in the pathogenesis and progression of cancer [40], and it is possible that the GPER DNA methylation might be involved in the decreased expression of GPER mRNA that occurs in gastric cancer. In this study, analysis using data from the MethHC website showed that the levels of GPER methylation in gastric cancer tissues were much higher than in normal tissues. Also, this study showed low expression of both mRNA and GPER protein in gastric cancer, combined with a negative correlation between DNA methylation and mRNA expression. Therefore, GPER DNA methylation gradually reduced GPER mRNA expression in the progression of gastric cancer, indicating that GPER promoter methylation is an important epigenetic mechanism for the down-regulation of GPER in gastric cancer. Several studies have previously investigated the methylation status of the GPER promoter in breast cancer and showed that GPER expression was negatively regulated by methylation of the GPER promoter [31,40,41]. Also, patients with breast cancer who had GPER DNA methylation have been shown to have an improved OS [31,40]. However, in the present study, based on limited data of GPER DNA methylation from The Cancer Genome Atlas Stomach Adenocarcinoma (TCGA-STAD), it was not possible to find a correlation between GPER DNA methylation and prognosis in patients with gastric cancer.
This study had several limitations. There were few cases that underwent immunohistochemistry for tissue GPER protein expression, which means that the findings should be interpreted with caution. In this study, the possible correlation between GPER protein expression and DFS in gastric cancer was not investigated. Also, the effects of GPER expression on proliferation and migration of gastric cancer cells was not investigated and the effects of the specific GPER agonist, G-1, were not included in this study. Therefore, the mechanism of GPER dysregulation in tumorigenesis and the progression of gastric cancer requires further investigation to address these limitations.
Conclusions
The findings from this study showed that G protein-coupled estrogen receptor (GPER) was downregulated in patients with gastric cancer and that decreased expression of GPER protein was an independent risk factor for poor prognosis in patients with gastric cancer. GPER may act as a tumor suppressor through the regulation of the epithelial-mesenchymal transition (EMT) pathway in gastric cancer. The findings from this study support that GPER requires further investigation in patients with gastric cancer to determine whether it has clinical potential as a diagnostic biomarker and as a possible therapeutic target in gastric cancer.
Acknowledgments
The authors thank Dr. Vikash for editing assistance in preparing the manuscript.
Footnotes
Source of support: This work was supported by the National Science Foundation of China (No.8157242)
Conflict of interest
None.
References
- 1.Cutsem EV, Sagaert X, Topal B, et al. Gastric cancer. Lancet. 2016;388:2654–64. doi: 10.1016/S0140-6736(16)30354-3. [DOI] [PubMed] [Google Scholar]
- 2.Ferlay J, Shin HR, Bray F, et al. Estimates of worldwide burden of cancer in 2008: GLOBOCAN 2008. Int J Cancer. 2010;127:2893–917. doi: 10.1002/ijc.25516. [DOI] [PubMed] [Google Scholar]
- 3.Mayer RJ, Venook AP, Schilsky RL. Progress against GI cancer during the American Society of Clinical Oncology’s first 50 years. J Clin Oncol. 2014;32:1521–30. doi: 10.1200/JCO.2014.55.4121. [DOI] [PubMed] [Google Scholar]
- 4.Qian H, Xuan J, Liu Y, Shi G. Function of G-protein-coupled estrogen receptor-1 in reproductive system tumors. J Immunol Res. 2016;2016:1–6. doi: 10.1155/2016/7128702. [DOI] [PMC free article] [PubMed] [Google Scholar]
- 5.Olde B, Leeblundberg LM. Searching for a role in estrogen physiology. Trends Endocrinol Metab. 2009;20(8):409–16. doi: 10.1016/j.tem.2009.04.006. [DOI] [PubMed] [Google Scholar]
- 6.Zimmerman MA, Budish RA, Kashyap S, Lindsey SH. GPER – novel membrane estrogen receptor. Clin Sci. 2016;130:1005–16. doi: 10.1042/CS20160114. [DOI] [PMC free article] [PubMed] [Google Scholar]
- 7.Feldman RD, Limbird LE. GPER (GPR30): A nongenomic receptor (GPCR) for steroid hormones with implications for cardiovascular disease and cancer. Annu Rev Pharmacol Toxicol. 2017;57:561–73. doi: 10.1146/annurev-pharmtox-010716-104651. [DOI] [PubMed] [Google Scholar]
- 8.Filardo EJ. A role for G-protein coupled estrogen receptor (GPER) in estrogen-induced carcinogenesis: Dysregulated glandular homeostasis, survival and metastasis. J Steroid Biochem Mol Biol. 2018;176:38–48. doi: 10.1016/j.jsbmb.2017.05.005. [DOI] [PubMed] [Google Scholar]
- 9.Barton M, Prossnitz ER. Emerging roles of GPER in diabetes and atherosclerosis. Trends Endocrinol Metab. 2015;26:185–92. doi: 10.1016/j.tem.2015.02.003. [DOI] [PMC free article] [PubMed] [Google Scholar]
- 10.Weißenborn C, Ignatov T, Ochel H, et al. GPER functions as a tumor suppressor in triple-negative breast cancer cells. J Cancer Res Clin Oncol. 2014;140:713–23. doi: 10.1007/s00432-014-1620-8. [DOI] [PMC free article] [PubMed] [Google Scholar]
- 11.Zhou X, Wang S, Wang Z, et al. Estrogen regulates Hippo signaling via GPER in breast cancer. J Clin Invest. 2015;125:2123–35. doi: 10.1172/JCI79573. [DOI] [PMC free article] [PubMed] [Google Scholar]
- 12.Nicolas C, Vega A, Bouskine A, et al. GPR30, the non-classical membrane G protein related estrogen receptor, is overexpressed in human seminoma and promotes seminoma cell proliferation. PLoS One. 2012;7(4):e34672. doi: 10.1371/journal.pone.0034672. [DOI] [PMC free article] [PubMed] [Google Scholar]
- 13.He Y, Du G, Cai B, et al. Estrogenic transmembrane receptor of GPR30 mediates invasion and carcinogenesis by endometrial cancer cell line RL95-2. J Cancer Res Clin Oncol. 2012;138:775–83. doi: 10.1007/s00432-011-1133-7. [DOI] [PMC free article] [PubMed] [Google Scholar]
- 14.Yan Y, Jiang X, Zhao Y, et al. Role of GPER on proliferation, migration and invasion in ligand-independent manner in human ovarian cancer cell line SKOV3. Cell Biochem Funct. 2015;33:552–59. doi: 10.1002/cbf.3154. [DOI] [PubMed] [Google Scholar]
- 15.Tang C, Yang L, Wang N, et al. High expression of GPER1, EGFR and CXCR1 is associated with lymph node metastasis in papillary thyroid carcinoma. Int J Clin Exp Pathol. 2014;7:3213–23. [PMC free article] [PubMed] [Google Scholar]
- 16.Zhu G, Huang Y, Wu C, et al. Activation of G-protein-coupled estrogen receptor inhibits the migration of human nonsmall cell lung cancer cells via IKK-β/NF-κB signals. DNA Cell Biol. 2016;35:434–42. doi: 10.1089/dna.2016.3235. [DOI] [PubMed] [Google Scholar]
- 17.Wei T, Chen W, Wen L, et al. G protein-coupled estrogen receptor deficiency accelerates liver tumorigenesis by enhancing inflammation and fibrosis. Cancer Lett. 2016;382:195–202. doi: 10.1016/j.canlet.2016.08.012. [DOI] [PubMed] [Google Scholar]
- 18.Chen Z, Wei W, Jiang G, et al. Activation of GPER suppresses epithelial mesenchymal transition of triple negative breast cancer cells via NF-κB signals. Mol Oncol. 2016;10:775–88. doi: 10.1016/j.molonc.2016.01.002. [DOI] [PMC free article] [PubMed] [Google Scholar]
- 19.Fábián M, Rencz F, Krenács T, et al. Expression of G protein-coupled oestrogen receptor in melanoma and in pregnancy-associated melanoma. J Eur Acad Dermatol Venereol. 2017;31:1453–61. doi: 10.1111/jdv.14304. [DOI] [PubMed] [Google Scholar]
- 20.Lam HM, Ouyang B, Chen J, et al. Targeting GPR30 with G-1: A new therapeutic target for castration-resistant prostate cancer. Endocr Relat Cancer. 2014;21:903–14. doi: 10.1530/ERC-14-0402. [DOI] [PMC free article] [PubMed] [Google Scholar]
- 21.Friese K, Kost B, Vattai A, et al. The G protein-coupled estrogen receptor (GPER/GPR30) may serve as a prognostic marker in early-stage cervical cancer. J Cancer Res Clin Oncol. 2018;144:13–19. doi: 10.1007/s00432-017-2510-7. [DOI] [PMC free article] [PubMed] [Google Scholar]
- 22.Edge SB, Compton CC. The American Joint Committee on Cancer: The 7th Edition of the AJCC Cancer Staging Manual and the Future of TNM. Ann Surg Oncol. 2010;17:1471–74. doi: 10.1245/s10434-010-0985-4. [DOI] [PubMed] [Google Scholar]
- 23.Kawakami F, Sircar K, Rodriguez-Canales J, et al. Programmed cell death ligand 1 and tumor-infiltrating lymphocyte status in patients with renal cell carcinoma and sarcomatoid dedifferentiation. Cancer. 2017;123:4823–31. doi: 10.1002/cncr.30937. [DOI] [PMC free article] [PubMed] [Google Scholar]
- 24.Tai CJ, Su TC, Jiang MC, et al. Correlations between cytoplasmic CSE1L in neoplastic colorectal glands and depth of tumor penetration and cancer stage. J Transl Med. 2013;11:29. doi: 10.1186/1479-5876-11-29. [DOI] [PMC free article] [PubMed] [Google Scholar]
- 25.Brusselaers N, Maret Ouda J, Konings P, et al. Menopausal hormone therapy and the risk of esophageal and gastric cancer. Int J Cancer. 2016;140:1693–99. doi: 10.1002/ijc.30588. [DOI] [PubMed] [Google Scholar]
- 26.Kang MH, Choi H, Oshima M, et al. Estrogen-related receptor gamma functions as a tumor suppressor in gastric cancer. Nat Commun. 2018;9(1):1920. doi: 10.1038/s41467-018-04244-2. [DOI] [PMC free article] [PubMed] [Google Scholar]
- 27.Wesołowska M, Pawlik P, Jagodziński PP. The clinicopathologic significance of estrogen receptors in human gastric carcinoma. Biomed Pharmacother. 2016;83:314–22. doi: 10.1016/j.biopha.2016.06.048. [DOI] [PubMed] [Google Scholar]
- 28.Ryu WS, Kim JH, Jang YJ, et al. Expression of estrogen receptors in gastric cancer and their clinical significance. J Surg Oncol. 2012;106:456–61. doi: 10.1002/jso.23097. [DOI] [PubMed] [Google Scholar]
- 29.Xu CY, Guo JL, Jiang ZN, et al. Prognostic role of estrogen receptor α and estrogen receptor β in gastric cancer. Ann Surg Oncol. 2010;17:2503–9. doi: 10.1245/s10434-010-1031-2. [DOI] [PubMed] [Google Scholar]
- 30.Zhang Q, Wu YZ, Zhang YM, et al. Activation of G-protein coupled estrogen receptor inhibits the proliferation of cervical cancer cells via sustained activation of ERK1/2. Cell Biochem Funct. 2015;33:134–42. doi: 10.1002/cbf.3097. [DOI] [PubMed] [Google Scholar]
- 31.Weißenborn C, Ignatov T, Ochel HJ, et al. GPER functions as a tumor suppressor in triple-negative breast cancer cells. J Cancer Res Clin Oncol. 2014;140(5):713–23. doi: 10.1007/s00432-014-1620-8. [DOI] [PMC free article] [PubMed] [Google Scholar]
- 32.Hiery JP, Acloque H, Huang RY, Nieto MA. Epithelial-mesenchymal transitions in development and disease. Cell. 2009;139:871–90. doi: 10.1016/j.cell.2009.11.007. [DOI] [PubMed] [Google Scholar]
- 33.Huang L, Wu RL, Xu A. Epithelial-mesenchymal transition in gastric cancer. Am J Transl Res. 2014;7:2141–58. [PMC free article] [PubMed] [Google Scholar]
- 34.Peng Z, Wang CX, Fang EH, et al. Role of epithelial-mesenchymal transition in gastric cancer initiation and progression. World J Gastroenterol. 2014;20:5403–10. doi: 10.3748/wjg.v20.i18.5403. [DOI] [PMC free article] [PubMed] [Google Scholar]
- 35.Wang Z, Chen X, Zhao Y, et al. G-protein-coupled estrogen receptor suppresses the migration of osteosarcoma cells via post-translational regulation of Snail. J Cancer Res Clin Oncol. 2019;145(1):87–96. doi: 10.1007/s00432-018-2768-4. [DOI] [PMC free article] [PubMed] [Google Scholar]
- 36.Li YC, Ding XS, Li HM, et al. Role of G protein-coupled estrogen receptor 1 in modulating transforming growth factor-β stimulated mesangial cell extracellular matrix synthesis and migration. Mol Cell Endocrinol. 2014;391:50–59. doi: 10.1016/j.mce.2014.04.014. [DOI] [PubMed] [Google Scholar]
- 37.Broselid S, Cheng B, Sjostrom M, et al. G protein-coupled estrogen receptor is apoptotic and correlates with increased distant disease-free survival of estrogen receptor-positive breast cancer patients. Clin Cancer Res. 2013;19:1681–92. doi: 10.1158/1078-0432.CCR-12-2376. [DOI] [PubMed] [Google Scholar]
- 38.Samartzis EP, Aurelia N, Alexander M, et al. The G protein-coupled estrogen receptor (GPER) is expressed in two different subcellular localizations reflecting distinct tumor properties in breast cancer. PLoS One. 2014;9:e83296. doi: 10.1371/journal.pone.0083296. [DOI] [PMC free article] [PubMed] [Google Scholar]
- 39.Heublein S, Mayr D, Vrekoussis T, et al. The G-protein coupled estrogen receptor (GPER/GPR30) is a gonadotropin receptor dependent positive prognosticator in ovarian carcinoma patients. PLoS One. 2013;8:e71791. doi: 10.1371/journal.pone.0071791. [DOI] [PMC free article] [PubMed] [Google Scholar]
- 40.Weissenborn C, Ignatov T, Nass N, et al. GPER promoter methylation controls GPER expression in breast cancer patients. Cancer Invest. 2017;35:100–7. doi: 10.1080/07357907.2016.1271886. [DOI] [PubMed] [Google Scholar]
- 41.Manjegowda MC, Gupta PS, Limaye AM. Hyper-methylation of the upstream CpG island shore is a likely mechanism of GPER1 silencing in breast cancer cells. Gene. 2017;614:65–73. doi: 10.1016/j.gene.2017.03.006. [DOI] [PubMed] [Google Scholar]