Abstract
Introduction:
Micronuclei (MNs) are extranuclear cytoplasmic DNA bodies which are induced in cells by numerous genotoxic agents that damage chromosome. The MN assay in exfoliated buccal cells is a useful and minimally invasive method for monitoring genetic damage.
Aim:
The aim of present study was to detect and assess MNs in oral exfoliated cells in patients diagnosed with leukoplakia with dysplasia, oral submucous fibrosis (OSMF) and oral squamous cell carcinoma (OSCC) using special stains and to determine the most appropriate staining technique for the evaluation of MNs along with a comparative evaluation of MNs with histological grading
Materials and Methods:
The study was conducted in the Department of Oral Pathology and Microbiology, CDCRI, Rajnandgaon, and a total of 45 subjects were included in the study who were subsequently divided into three groups (15 each). Four smears were obtained from each subject which were taken from the lesional tissue and stained simultaneously.
Analysis:
The results were analyzed via Statistical Package for the Social Sciences, version 23.0 (SPSS).
Results:
The results confirmed the association of MNs with genotoxic agents and showed an elevated number in OSCC followed by OSMF and leukoplakia. The frequency also increased with the severity of the lesion. Besides this, Papanicolaou (PAP) stain was found to be the most suitable stain for detection of MNs.
Conclusion:
Based on the above pretext, we can conclude that PAP stain was the most suitable stain for valuation of MNs and that the MN assay holds promise as a specific biomarker of genotoxicity, for screening of oral cancer and can be used as a prognostic indicator.
Keywords: Genotoxic agents, micronuclei, Papanicolaou stain
INTRODUCTION
Buccal cell micronuclei (MNs) are a putative biomarker for oral cancer risk as evidence suggests that MNs are significantly elevated in buccal mucosal cells of persons who harbor precancerous lesions and in cancer patients.[1] It serves as a tool for early detection of cancerous and precancerous lesions. Various stains have been used for the same, but only little attention has been given to the effect of different staining procedures on the result of MNs assay.
The efficacy of various stains to study MNs is still in its primitive phase. In the present study, we tried using stains which were easily available in the laboratory, were quick and effective and required minimum armamentarium, thereby reducing the overall time and cost factor of the procedure.
Hence, the present study was undertaken with the aim to detect and assess MNs in oral exfoliated cells in patients diagnosed with leukoplakia with dysplasia, oral submucous fibrosis (OSMF) and oral squamous cell carcinoma (OSCC) using special stains and to determine the most appropriate staining technique for the evaluation of MNs along with a comparative evaluation of MNs with histological grading.
SETTINGS AND DESIGN
The present study was conducted in the Department of Oral Pathology and Microbiology, after obtaining clearance from the Institutional Ethical Committee.
The inclusion criteria included subjects after histopathological confirmation of diagnosis as leukoplakia with dysplasia, OSMF and OSCC. These were systemically healthy subjects free from any other acute/chronic diseases.
The subjects were divided into three groups, 15 subjects diagnosed with leukoplakia, 15 subjects diagnosed with OSMF and 15 subjects diagnosed with OSCC. Buccal cells were collected by gently scraping the lesional tissue with a disposable wooden spatula. The cells were immediately smeared on microscopic slides and stained with H&E (routine staining), May–Grunwald–Giemsa (MGG), Papanicolaou (PAP) and Leishman Giemsa (LG) cocktail, respectively. Each stained slide was focused under a light microscope (Lawrence and Mayo) and examined first under ×400 and then under oil immersion [Figures 1-4]. Fifty cells were examined under for the number of MN cells. Counting of MNs was done by zig-zag method, and the frequency was noted. The scoring of MNs was done according to the criteria established by Tolbert et al.[2,3,4,5] according to which MN must be
Figure 1.
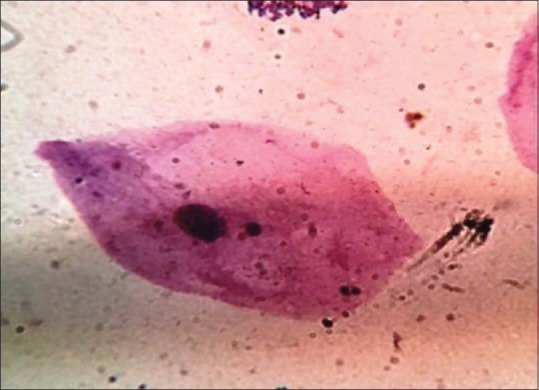
Photomicrograph showing micronuceli (PAP, ×1000)
Figure 4.
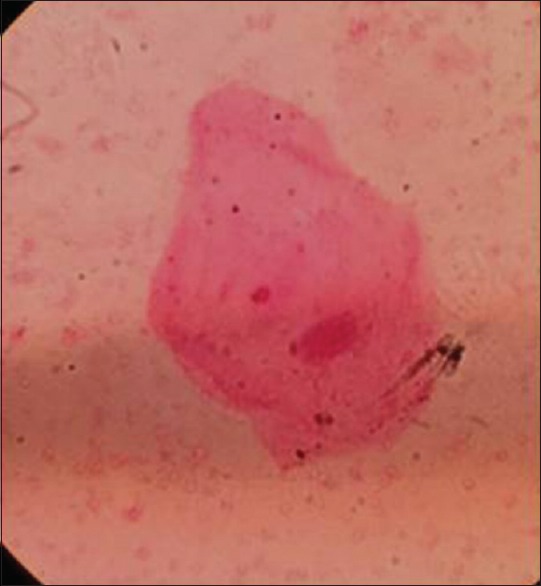
Photomicrograph showing micronuceli (H&E, ×1000)
Figure 2.
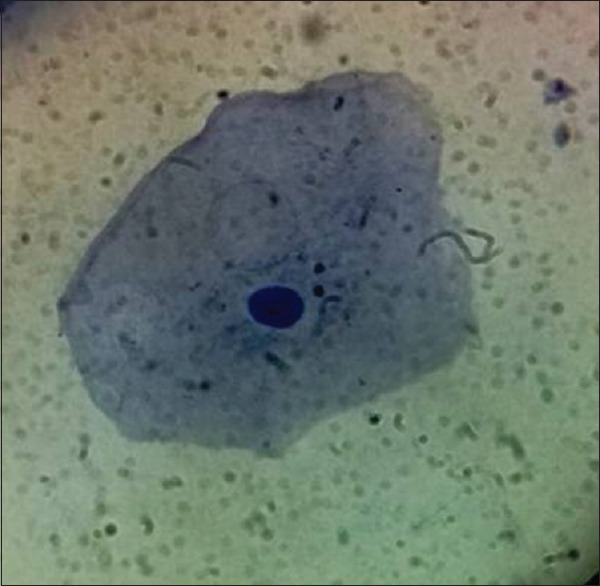
Photomicrograph showing micronuceli (LG, ×1000)
Figure 3.
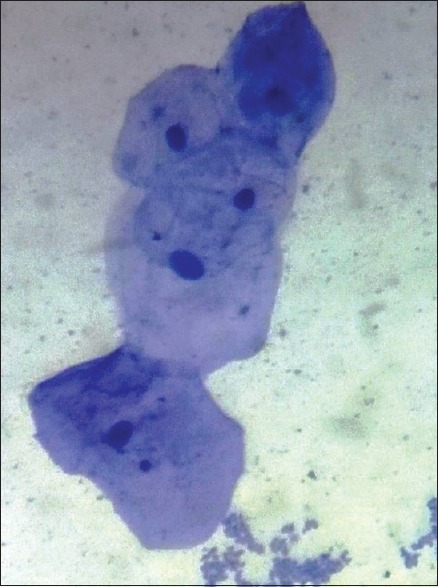
Photomicrograph showing micronuceli (MGG, ×1000)
Be less than 1/5th to 1/3rd diameter of the main nucleus
Be on the same plane of focus with main nucleus
Have the same color, texture and refraction as the main nucleus
Have smooth oval or round shape
Be clearly separated from the main nucleus.
The data obtained were tabulated and analyzed using Statistical Package for the Social Sciences, version 23.0 (SPSS, IBM corp., Armonk, New York, United States). Means and standard deviations were calculated for MNs among all the study groups and the control groups. To calculate P value, one-way ANOVA was used. For all the comparisons, P ≤ 0.001 was used for statistical significance.
OBSERVATIONS
On comparison of MN in different stains in patients diagnosed with leukoplakia, the mean and standard deviation of PAP, LG, MGG and H&E stain was 7.6, 6.5, 4.93, 3.00, 1.39, 0.99, 1.09, 0.75, respectively. P value was statistically significant [Table 1 and Graph 1].
Table 1.
Descriptive statistics of mean scores of micronuclei in different stains in patients diagnosed with leukoplakia
| Stains | n | Micronuclei | ||
|---|---|---|---|---|
| Mean | SD | P | ||
| PAP | 15 | 7.66 | 1.39 | 0.0001 |
| LG | 15 | 6.53 | 0.99 | |
| MGG | 15 | 4.93 | 1.09 | |
| H&E | 15 | 3.00 | 0.75 | |
| Pairwise comparison | PAP-LG=0.03 | |||
| PAP-MGG=0.00 | ||||
| PAP-H and E=0.00 | ||||
| LG-MGG=0.001 | ||||
| LG-H and E=0.00 | ||||
| MGG-H and E=0.000 | ||||
PAP: Papanicolaou, LG: Leishman Giemsa, MGG: May–Grunwald–Giemsa, SD: Standard deviation
Graph 1.
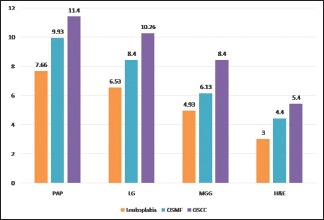
Bar diagram comparing mean micronuceli among different study groups under different stains
On comparison of MN in different stains in patients diagnosed with OSMF, the mean and standard deviation of PAP, LG, MGG and H&E stain were 9.93, 8.40, 6.13, 4.40, 1.43, 1.40, 1.55, 1.12, respectively. P value was statistically significant [Table 2].
Table 2.
Descriptive statistics of mean scores of micronuclei in different stains in patients diagnosed with oral submucous fibrosis
| Stains | n | Micronuclei | ||
|---|---|---|---|---|
| Mean | SD | P | ||
| PAP | 15 | 9.93 | 1.43 | 0.0001 |
| LG | 15 | 8.40 | 1.40 | |
| MGG | 15 | 6.13 | 1.55 | |
| H&E | 15 | 4.40 | 1.12 | |
| Pairwise comparison | PAP-LG=0.019 | |||
| PAP-MGG=0.000 | ||||
| PAP-H and E=0.000 | ||||
| LG-MGG=0.000 | ||||
| LG- H and E=0.000 | ||||
| MGG-H and E=0.006 | ||||
PAP: Papanicolaou, LG: Leishman Giemsa, MGG: May–Grunwald–Giemsa, SD: Standard deviation
On comparison of MN in different stains in patients diagnosed with OSCC, the mean and standard deviation of PAP, LG, MGG and H&E stain were 11.40, 10.26, 8.40, 5.40, 1.72, 1.53, 1.45, 1.40, respectively. P value was statistically significant [Table 3 and Graph 1].
Table 3.
Descriptive statistics of mean scores of micronuclei in different stains in patients diagnosed with oral squamous cell carcinoma
| Stains | n | Micronuclei | ||
|---|---|---|---|---|
| Mean | SD | P | ||
| PAP | 15 | 11.40 | 1.72 | 0.0001 |
| LG | 15 | 10.26 | 1.53 | |
| MGG | 15 | 8.40 | 1.45 | |
| H&E | 15 | 5.40 | 1.40 | |
| Pairwise comparison | PAP-LG=0.192 | |||
| PAP-MGG=0.000 | ||||
| PAP-H and E=0.000 | ||||
| LG-MGG=0.008 | ||||
| LG-H and E=0.000 | ||||
| MGG-H and E=0.000 | ||||
PAP: Papanicolaou, LG: Leishman Giemsa, MGG: May–Grunwald–Giemsa, SD: Standard deviation
When comparison of MN was made among different study groups using PAP stain, the mean value was 1.33, 7.67, 9.93 and 11.40, respectively, for normal, leukoplakia, OSMF and OSCC. P value was statistically significant which shows that there is a significant increase in MN count [Table 4].
Table 4.
Descriptive statistics of mean scores of micronuclei in Papanicolaou stain in patients diagnosed with leukoplakia, oral submucous fibrosis and oral squamous cell carcinoma
| Groups | n | Micronuclei | ||
|---|---|---|---|---|
| Mean | SD | P | ||
| Normal | 15 | 1.33 | 0.49 | 0.0001 |
| Leukoplakia | 15 | 7.67 | 1.39 | |
| OSF | 15 | 9.93 | 1.43 | |
| OSCC | 15 | 11.40 | 1.72 | |
| Pairwise comparison | Control-leukoplakia=0.000 | |||
| Control-OSF=0.000 | ||||
| Control-OSCC=0.000 | ||||
| Leukoplakia-OSF=0.000 | ||||
| Leukoplakia-OSCC=0.000 | ||||
| OSF-OSCC=0.021 | ||||
SD: Standard deviation, OSF: Oral submucous fibrosis, OSCC: Oral squamous cell carcinoma
When comparison of MN was made among different study groups using LG stain, the mean value was 0.87, 6.53, 8.40 and 10.26, respectively, for normal, leukoplakia, OSMF and OSCC. P value was statistically significant which shows that there is a significant increase in MN count [Table 5].
Table 5.
Descriptive statistics of mean scores of micronuclei in Leishman Giemsa stain in patients diagnosed with leukoplakia, oral submucous fibrosis and oral squamous cell carcinoma
| Groups | n | Micronuclei | ||
|---|---|---|---|---|
| Mean | SD | SE | ||
| Normal | 15 | 0.87 | 0.64 | P=0.0001 |
| Leukoplakia | 15 | 6.53 | 0.99 | |
| OSF | 15 | 8.40 | 1.40 | |
| OSCC | 15 | 10.26 | 1.53 | |
| Pairwise comparison | Control-leukoplakia=0.000 | |||
| Control-OSF=0.000 | ||||
| Control-OSCC=0.000 | ||||
| Leukoplakia-OSF=0.000 | ||||
| Leukoplakia-OSCC=0.000 | ||||
| OSF-OSCC=0.000 | ||||
SD: Standard deviation, OSF: Oral submucous fibrosis, OSCC: Oral squamous cell carcinoma, SE: Standard error
When comparison of MN was made among different study groups using MGG stain the mean value was 0.00, 4.93, 6.13 and 8.40 respectively for normal, leukoplakia, OSMF and OSCC. P value was statistically significant which shows that there is a significant increase in MN count [Table 6].
Table 6.
Descriptive statistics of mean scores of micronuclei in May–Grunwald–Giemsa stain in patients diagnosed with leukoplakia, oral submucous fibrosis and oral squamous cell carcinoma
| Groups | n | Micronuclei | ||
|---|---|---|---|---|
| Mean | SD | P | ||
| Control | 15 | 0.00 | 0.00 | 0.0001 |
| Leukoplakia | 15 | 4.93 | 1.09 | |
| OSF | 15 | 6.13 | 1.55 | |
| OSCC | 15 | 8.40 | 1.45 | |
| Pairwise comparison | Control-leukoplakia=0.000 | |||
| Control-OSF=0.000 | ||||
| Control-OSCC=0.000 | ||||
| Leukoplakia-OSF=0.039 | ||||
| Leukoplakia-OSCC=0.000 | ||||
| OSF-OSCC=0.000 | ||||
SD: Standard deviation, OSF: Oral submucous fibrosis, OSCC: Oral squamous cell carcinoma
When comparison of MN was made among different study groups using H&E stain, the mean value was 0.00, 3.00, 4.40 and 5.40, respectively, for normal, leukoplakia, OSMF and OSCC. P value was statistically significant which shows that there is a significant increase in MN count [Table 7].
Table 7.
Descriptive statistics of mean scores of micronuclei in H&E stain in patients diagnosed with leukoplakia, oral submucous fibrosis and oral squamous cell carcinoma
| Groups | n | Micronuclei | ||
|---|---|---|---|---|
| Mean | SD | P | ||
| Control | 15 | 00 | 0.00 | 0.0001 |
| Leukoplakia (A) | 15 | 3.00 | 0.75 | |
| OSF (B) | 15 | 4.40 | 1.12 | |
| SCC (C) | 15 | 5.40 | 1.40 | |
| Pairwise comparison | Control-leukoplakia=0.000 | |||
| Control-OSF=0.000 | ||||
| Control-OSCC=0.000 | ||||
| Leukoplakia-OSF=0.033 | ||||
| Leukoplakia-OSCC=0.000 | ||||
| OSF-OSCC=0.001 | ||||
SD: Standard deviation, OSF: Oral submucous fibrosis, SCC: Squamous cell carcinoma, OSCC: Oral squamous cell carcinoma
DISCUSSION
In our study, besides investigating the efficacy of stains, we carried out a comparison of mean MN frequency in oral pre malignant disorders (OPMD) and OSCC and found out an increase in MN frequency from potentially malignant disorders to malignant lesions. We concluded that the mean nuclei count detected in PAP, LG, MGG and H&E stains in patients diagnosed with OSCC was found to be significantly higher as compared to patients diagnosed with OSMF and leukoplakia (OPMD).
It was also evident from our study that the mean number of MN was highest in OSCC group as compared to OSMF and leukoplakia. Similar results were obtained in a separate study done in 2010. The study inferred that the frequency of MN in oral mucosal cells of patients with OSCC was threefold to fourfold higher as compared with the OPMD and the control groups.[6] When MN counts between OSMF and leukoplakia were compared in our study, the count was higher in OSMF. The mean difference of 1.46 was found to be statistically significant at 0.05 level. This might be attributed to the fact that OSMF subjects had a mixed habit of areca nut tobacco and other forms such as zarda and gutkha which caused more damage.[6]
A variety of stains, both DNA specific and nonspecific, have been used to evaluate MNs. Our stains of choice for the present study were PAP, LG, MGG and H&E.
Based on the results so obtained, and after appropriate statistical analysis, we concluded that the mean nuclei count detected in PAP stain in all the three study groups was found to be significantly higher when compared to LG cocktail stain, MGG and H&E stain thus concluding that PAP is the preferred stain for the evaluation of MN.
We also tried testing a newer staining technique which is the LG cocktail stain. It is a relatively new stain which has been tested in exfoliative cytology by other authors. They verified the effectiveness of LG stain and concluded that both PAP and LG gave similar results in terms of frequency of MN which was superior to MGG and H&E.[7]
This could be because Leishman stain is a good nuclear stain, when used alone, and gives intense staining of extracellular ground substance, under stained individual cells and three-dimensional clumps. When Giemsa stain, a good cytoplasmic stain, is mixed with Leishman stain, the LG cocktail provides a moderate metachromasia to the ground substance and brilliantly stained cellular components, thus giving better results in evaluation of MN.
However, when LG stain was compared to PAP, MGG and H&E in our study, we found that it gave inferior results when compared to PAP but showed better MN count as compared to MGG and H&E. The difference in our study could be because smears were air-dried before staining with LG cocktail, resulting in an unwanted background staining full of cell debris and salivary proteins, thus masking the counting of MN.
Although the nuclear transparency of PAP was absent in LG cocktail, the chromatin granularity and vesicularity were better appreciated in air-dried LG cocktail-stained smears. The nuclear enlargement and variation in nuclear size were exaggerated in air-dried smears which was additionally helpful in cytological diagnosis. If the background staining is too intense, it may also prevent adequate visualization of cell clusters. In the present study too, MGG-stained smears showed a more intense metachromasia when compared to LG cocktail and sometimes obscured cellular detail.[5,8,9]
Our findings further showed that the results of the MNs assay in exfoliated oral mucosal cells of patients with OPMD depended strongly on the staining method.[10,11] According to the results of the present study, for the routine MNs assay, PAP, which is the most commonly used cytological stain, and LG cocktail, which is a newer stain, were found to show better staining results as compared to the MGG – a Romanowsky's stain, which is used widely in field studies and the routine stains. In the present study, the mean nuclei count detected in PAP stain in all the three groups were found to be significantly higher as compared to LG, MGG and H&E stain. The mean difference of 1.13, 2.73 and 4.66 was found to be statistically significant at 0.05 level. Limitations of the present study were the presence of stain granules and varied staining intensity.
CONCLUSION
Based on the above study the following conclusions were derived:
MN assay in exfoliated cells is best seen with PAP stain followed by LG cocktail, MGG and H&E. The result also shows that the frequency of MNs was significantly higher in OSCC, followed by OSMF and finally leukoplakia. The frequency increased with the progression of the grades of the lesion, thus indicating a plausible link between the frequency of MN and the malignant transformation rate. And finally, the MN assay holds promise as a specific biomarker of genotoxicity, for screening of oral cancer, and as can be used as a prognostic indicator. These biomarkers, however, should be thoroughly explored for their use in mass screening and, monitoring progression of oral lesion since an early diagnosis will ensure a better outcome and good prognosis and will reduce the overall cost of the treatment. As this is a quick, simple and feasible method, it can be carried out in larger populations.
Financial support and sponsorship
Nil.
Conflicts of interest
There are no conflicts of interest.
REFERENCES
- 1.Naderi NJ, Farhadi S, Sarshar S. Micronucleus assay of buccal mucosa cells in smokers with the history of smoking less and more than 10 years. Indian J Pathol Microbiol. 2012;55:433–8. doi: 10.4103/0377-4929.107774. [DOI] [PubMed] [Google Scholar]
- 2.Bonassi S, Coskun E, Ceppi M, Lando C, Bolognesi C, Burgaz S, et al. The Human MicroNucleus project on exfoliated buccal cells (HUMN(XL)): The role of life-style, host factors, occupational exposures, health status, and assay protocol. Mutat Res. 2011;728:88–97. doi: 10.1016/j.mrrev.2011.06.005. [DOI] [PubMed] [Google Scholar]
- 3.Tolbert PE, Shy CM, Allen JW. Micronuclei and other nuclear anomalies in buccal smears: A field test in snuff users. Am J Epidemiol. 1991;134:840–50. doi: 10.1093/oxfordjournals.aje.a116159. [DOI] [PubMed] [Google Scholar]
- 4.Francielli de Oliveira P, Faria Andrade A, Ferreira Malheiros F, Aparecida de Lacerda S, Aparecida Campos A, Zaia JE, et al. Evaluation of the frequency of micronuclei in exfoliated cells from oral lesions previously identified by toluidine blue. Acta Cytol. 2011;55:344–9. doi: 10.1159/000326945. [DOI] [PubMed] [Google Scholar]
- 5.Devi P, Thimmarasa VB, Mehrotra V, Arora P. Micronuclei assay for evaluation of genotoxicity in potentially malignant and malignant disorders. J Indian Acad Oral Med Radiol. 2011;23:97–100. [Google Scholar]
- 6.Palaskar S, Jindal C. Evaluation of micronuclei using Papanicolaou and may Grunwald Giemsa stain in individuals with different tobacco habits – A comparative study. J Clin Diagn Res. 2010;4:3607–13. [Google Scholar]
- 7.Halder A, Chakraborty T, Mandal K, Gure PK, Das S, Raychowdhury R, et al. Comparative study of exfoliated oral mucosal cell micronuclei frequency in normal, precancerous and malignant epithelium. Int J Hum Genet. 2004;4:257–60. [Google Scholar]
- 8.Dahal S, Boaz K, Srikant N, Reshma K, Agrawal N. Micronuclei and sialic acid as markers of genotoxic damage in tobacco-related oral lesions. J Pathol Nepal. 2013;3:379–84. [Google Scholar]
- 9.Ramirez A, Saldanha PH. Micronucleus investigation of alcoholic patients with oral carcinomas. Genet Mol Res. 2002;1:246–60. [PubMed] [Google Scholar]
- 10.Jadhav K, Gupta N, Ahmed MB. Micronuclei: An essential biomarker in oral exfoliated cells for grading of oral squamous cell carcinoma. J Cytol. 2011;28:7–12. doi: 10.4103/0970-9371.76941. [DOI] [PMC free article] [PubMed] [Google Scholar]
- 11.Dindgire SL, Gosavi S, Kumawat R, Ganvir S, Hazarey V. Comparative study of exfoliated oral mucosal cell micronucleus frequency in potentially malignant and malignant lesions. Int J Oral Maxillofac Pathol. 2012;3:15–20. [Google Scholar]


