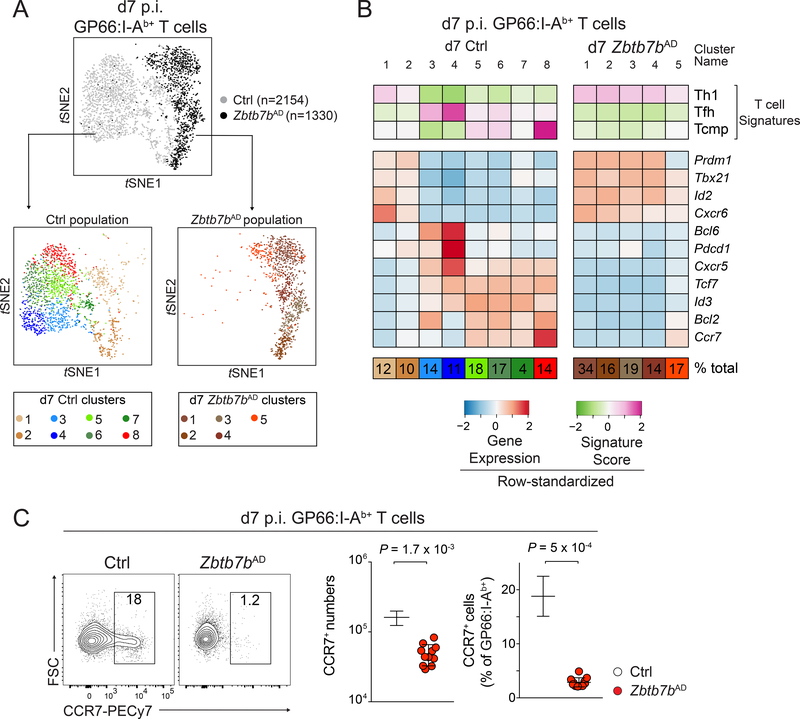
Figure 2: Thpok controls the emergence of the Tcmp signature.
(A, B) scRNAseq of Zbtb7bAD or control (Tnfrsf4-cre+ Zbtb7b+/+) GP66:I-Ab+ Rosa26YFP+ spleen T cells at d7 p.i. LCMV Arm. (A) Top t-SNE plot shows cells colored by genotype. Bottom t-SNE plots show cells from each genotype, independently clustered and color-coded by cluster. (B) Signature scores (top three rows) and expression of selected genes (middle panel) among clusters of Zbtb7bAD and control cells displayed in (A). Percentages (bottom row) indicate cluster size relative to the total population.
(C) Contour plots (left) and quantification (right) of CCR7 expression on spleen GP66:I- Ab+ T cells. Data are from 11 (Zbtb7bAD) and 5 (Ctrl) mice, obtained in two experiments representative of three. Please see also Figure S2.

