Abstract
The gel diffusion precipitin test (GDPT) and restriction endonuclease analysis (REA) have commonly been used in the serotyping and genotyping of Pasteurella multocida. Whole genome sequencing (WGS) and single nucleotide polymorphism (SNP) analysis has become the gold standard for other organisms, offering higher resolution than previously available methods. We compared WGS to REA and GDPT on 163 isolates of P. multocida to determine if WGS produced more precise results. The isolates used represented the 16 reference serovars, isolates with REA profiles matching an attenuated fowl cholera vaccine strain, and isolates from 10 different animal species. Isolates originated from across the United States and from Chile. Identical REA profiles clustered together in the phylogenetic tree. REA profiles that differed by only a few bands had fewer SNP differences than REA profiles with more differences, as expected. The GDPT results were diverse but it was common to see a single serovar show up repeatedly within clusters. Several errors were found when examining the REA profiles. WGS was able to confirm these errors and compensate for the subjectivity in analysis of REA. Also, results of WGS and SNP analysis correlated more closely with the epidemiologic data than GDPT. In silico results were also compared to a lipopolysaccharide rapid multiplex PCR test. From the data produced in our study, WGS and SNP analysis was superior to REA and GDPT and highlighted some of the issues with the older tests.
Keywords: Pasteurella multocida, restriction endonuclease analysis, whole genome sequence
Introduction
Pasteurella multocida causes and contributes to a variety of diseases in an array of animal species. Some of the most severe infections include fowl cholera in avian species,11 hemorrhagic septicemia in cattle and water buffalo,14 atrophic rhinitis in swine,7 and snuffles in rabbits.18 The gel diffusion precipitin test (GDPT), developed in the early 1970s, recognizes 16 somatic serovars.5,13 Characterization of P. multocida beyond the serovar is beneficial for epidemiologic purposes and to determine genetic relatedness that GDPT cannot provide.38
A series of studies, reviewed in 2015,12 showed that the 16 reference serovars identified in GDPT represent only 8 unique lipopolysaccharide (LPS) outer core biosynthesis loci. Using this knowledge, a rapid multiplex PCR, termed LPS-mPCR, was designed to recognize these 8 LPS biosynthesis loci, designated as L1–L8.12 Primers were made for each of the 8 LPS genotypes and were used to test field isolates. GDPT was also done on all of the isolates and compared to the LPS-mPCR.12 There was relatively poor correlation between the 2 tests, and chemical structural analysis was used to confirm that the LPS-mPCR results were far more reliable than the GDPT results.12 These findings led to a recommendation that LPS-mPCR was better able to differentiate based on LPS genotype than GDPT.12
Restriction endonuclease analysis (REA) can provide a REA fingerprint profile number for isolates of P. multocida, which can provide further classification.38,39 REA can differentiate between the commonly seen live fowl cholera vaccine strain and field isolates in the United States.38 Disadvantages of REA include difficulty in distinguishing restriction fragment bands, causing the test to be time consuming, subjective, and difficult when comparing results between laboratories. Furthermore, consensus has not been reached as to which restriction enzyme provides the best profile.35,39,41
Whole genome sequencing (WGS) is rapidly becoming the preferred genotyping method for a variety of bacterial organisms including Brucella,30 Salmonella,8 Listeria,17 and Mycobacterium.36 The cost of WGS has dropped significantly, often competing in cost with older molecular methods of characterization.20 Single nucleotide polymorphism (SNP) analysis of the WGS data can group isolates based on genetic relatedness more precisely than other genotyping tests currently available, such as REA.9
Several different studies have looked at WGS of P. multocida. One study examined virulent strains X73 and P1059 to locate the genes involved in virulence that could aid in vaccine production.15 Another study compared genomes from GenBank and found that host specialization had little impact on phylogenetic grouping; however, capsule type did.25 A third study compared 9 genomes looking for genetic similarities and differences and reported that a large portion of the genome was dedicated to capsule, filamentous hemagglutinin, and virulence factors.4 However, the authors also commented on the lack of WGS data available for P. multocida and the need for more information in order to further identify genes.4 Also, a study used WGS of P. multocida isolates associated with hemorrhagic septicemia (HS) in hopes of designing an HS-specific test23; the HS isolates were found to be closely related and separated from the other P. multocida genomes publically available.23
At the time of our study, the National Veterinary Services Laboratories (NVSL) offered GDPT and REA as typing tests for P. multocida. The NVSL estimated turnaround time for REA and GDPT was 30 d and 7 d, respectively. In contrast, WGS results could be reported as quickly as 48 h.16 Of these 3 tests, GDPT is the least reproducible given issues with cross-reactions, within and across laboratories.38 REA has a higher discriminatory power than GDPT but also has higher subjectivity given the visual interpretation of restriction fragment bands.38 WGS has the highest discriminatory power among molecular tests.29 For P. multocida, WGS has the potential to resolve the issues of subjectivity in REA and the cross-reactions in GDPT. Our objective was to compare WGS to REA and GDPT and evaluate the feasibility of replacing these tests with WGS. An in silico analysis was also done comparing WGS to the LPS genotypes described previously12 as another way of comparing the typing systems.
Materials and methods
Isolates
A total of 166 strains and isolates of P. multocida were examined in our study; 132 were field isolates from the culture collection at the NVSL, 16 were the reference strains for Heddleston serovars 1–16 (with the reference strain for serovar 3 analyzed 3 times), and 16 isolates were from 2 separate farms with ongoing fowl cholera outbreaks. The isolates from the NVSL culture collection are labeled with a BTYP number (Supplementary Table 1), the reference strains are labeled with the strain name (Table 1), and the isolates from 2 outbreaks are labeled with farm-based codes (Table 2). The isolates from the NVSL collection and the 2 outbreaks were all dated from 1999 to 2015, originated from 41 different submitters, and each isolate came from a single animal.
Table 1.
Pasteurella multocida reference strains used. Reference serovar 3 was submitted on 3 separate occasions.
| WGS section | Reference strain ID | Animal origin | Origin | GDPT results | REA profile |
|---|---|---|---|---|---|
| A2 | P-1581 | Pine siskin | Massachusetts | 8 | 0008 |
| P-1591 | Human | Iowa | 13 | 0013 | |
| B1 | P-2192 | Turkey* | Texas | 6 | 0006 |
| P-1997 | Herring gull | New York | 7 | 0007 | |
| B2 | P1059 | Turkey | West Virginia | 3 | 0003 |
| B3a | P-2095 | Turkey | Minnesota | 9 | 0009 |
| B4b | P-1662 | Turkey | South Carolina | 4 | 0004 |
| P-1702 | Turkey | Virginia | 5 | 0005 | |
| P-2723 | Turkey | Indiana | 16 | 0016 | |
| B5b | M-1404 | Bison | Yellowstone National Park† | 2 | 0002 |
| P-2225 | Cattle | Iowa | 14 | 0014 | |
| X-73 | Chicken | Maryland | 1 | 0001 | |
| B5c | P-2100 | Turkey | Indiana | 10 | 0010 |
| P-903 | Swine | Maryland | 11 | 0011 | |
| P-1573 | Human | Iowa | 12 | 0012 | |
| P-2237 | Turkey | Iowa | 15 | 0015 |
GDPT = gel diffusion precipitin test; REA = restriction endonuclease analysis; WGS = whole genome sequence.
Records are variable, chicken, or turkey.
M1404 was isolated in 1922 from bison. The records are not clear on the source location. However, there was an epizootic of hemorrhagic septicemia in Yellowstone Park in 1922, so this location is presumed.
Table 2.
Pasteurella multocida isolates received from 2 separate farms with ongoing outbreaks.
| WGS section | BTYP ID | Date received (m/d/y) | Species | U.S. State | GDPT results | REA profile |
|---|---|---|---|---|---|---|
| B4b | Liver 1 | 5/9/2014 | Turkey | NC | 4,12,14 | 0521 |
| Liver 2 | 5/9/2014 | Turkey | NC | 4,12,14 | 0521 | |
| Liver 3 | 5/9/2014 | Turkey | NC | 4,12,14 | 0521 | |
| Liver 4 | 5/9/2014 | Turkey | NC | 4,12,14 | 0521 | |
| B5a | 1 | 10/22/2014 | Turkey | MN | 1 | 1519 |
| 3-1 | 10/22/2014 | Turkey | MN | 1 | 1519 | |
| 3-2 | 10/22/2014 | Turkey | MN | 1 | 1519 | |
| 3-3 | 10/22/2014 | Turkey | MN | 1 | 1519 | |
| 4 | 10/22/2014 | Turkey | MN | 1 | 1519 | |
| 5 | 10/22/2014 | Turkey | MN | 1 | 1519 | |
| 6 | 10/22/2014 | Turkey | MN | 1 | 1519 | |
| 7 | 10/22/2014 | Turkey | MN | 1 | 1519 | |
| LR1 | 10/22/2014 | Turkey | MN | 1 | 1519 | |
| L3 | 10/22/2014 | Turkey | MN | 1 | 1519 | |
| MV3 | 10/22/2014 | Turkey | MN | 1 | 1519 | |
| MV4 | 10/22/2014 | Turkey | MN | 1 | 1519 |
GDPT = gel diffusion precipitin test; REA = restriction endonuclease analysis; WGS = whole genome sequence.
Isolates were selected based on their geographic location, source animal species, serovar, and REA profile. Initially, a pilot study was conducted to determine the potential use of WGS of P. multocida. Forty isolates classified as serovar 1 were selected based on viability on attempted revival from storage. The pilot study was expanded, adding isolates that were more geographically and species diverse and from all 16 serovars. The isolates selected were based on availability from the NVSL repository of isolates. In some cases, the REA profile was already known and was used, not only to select diverse isolates, but also to select similar and/or identical profiles. Additional veterinary diagnostic laboratories and farms were also contacted to obtain isolates from active fowl cholera outbreaks. All of the isolates were checked biochemically for their ability to ferment glucose, sorbitol, and lactose (including gas production for glucose test), growth on MacConkey agar, and ability to produce urease, indole, and ornithine decarboxylase to verify that they were P. multocida and were not contaminated. The isolates received from outside sources were treated the same way after they were streaked to a blood agar plate from the original tube or plate.
GDPT
Isolates were serotyped using GDPT, with antigen and sera prepared in-house based on previously described methods.13 Briefly, the antigen was prepared by removing growth (18–24 h at 37°C) from a dextrose starch agar plate (6% dextrose starch agar, 0.47% bacto agar (Difco, BD Diagnostics, Sparks, MD), in sterile water) using 2.5 mL of 0.85% saline with 0.6% formaldehyde. This suspension was autoclaved at 101°C for 55 min, then centrifuged at 16,168 × g for 20 min. The supernatant was removed and stored at 4°C for later use. Antisera were obtained from chickens after several (up to 8 as needed) weekly intravenous antigen injections into the brachial wing vein of each reference antigen. Test bleeding was done after 3 inoculations to check the reaction using GDPT and weekly thereafter until the reaction to the corresponding antigen was strong enough to be easily seen in GDPT. The birds were exsanguinated, and the antisera were harvested. The antisera were preserved either by lyophilization or with a mixture of phosphate-buffered saline (PBS) and glycerol in a ratio as deemed appropriate through testing. The slides for GDPT were made of 0.9% Noble agar (Difco, BD Diagnostics) and 8.5% sodium chloride on 25 × 75 mm microscope slides. The GDPT was set up with the antiserum in the center surrounded by up to 4 isolates. Wells were 4 mm diameter and 6 mm from center to center. The relevant reference strain antigen was used as the respective positive control for the corresponding antiserum. The slides were stored in a humidified chamber for 48 h at 37°C and then observed for the presence of a precipitin line.
Restriction endonuclease analysis
REA testing (also referred to as DNA fingerprinting) of the isolates was done using modified methods based on previously published methods.39 After overnight growth at 37°C on blood agar base slants, the growth was removed with 0.85% saline and adjusted to a transmittance value of 45–55% using a spectrophotometer at a wavelength of 600 nm. This suspension was pelleted via centrifugation at 16,168 × g for 5 min, and the supernatant was discarded. Five hundred microliters of DNAzol (Invitrogen, Carlsbad, CA) were added to lyse the cells and, after 30 min, 1 mL of 100% ethanol was added to the tubes. The mixture was centrifuged again for 5 min at 16,168 × g and the supernatant discarded. The pellet was washed 2 times with 70% ethyl alcohol. A vacuum concentrator was used to remove all liquid from the pellet. The DNA was digested by HhaI (Invitrogen) as directed by the manufacturer. The stop buffer (25% Ficoll [MilliporeSigma, St. Louis, MO], 0.25% xylene cyanol, 0.25% bromophenol blue, in sterile water) was added after 3 h. DNA from the bacteriophage lambda was digested with HindIII (Invitrogen) and used in triplicate as a marker on every gel. The DNA fragments and lambda markers were loaded into 0.7% SeaKem ME agarose gel (Lonza, Rockland, ME). The gel was electrophoresed for 17 h in Tris borate buffer (1.06% Trizma base [MilliporeSigma], 0.1% EDTA, 0.54% boric acid, in sterile water) at 72 V. The gel was stained with an ethidium bromide solution (Invitrogen) and rinsed with sterile water. Gels were photographed (Gel Logic 200 Imaging System, Kodak, Rochester, NY) under ultraviolet illumination. The profiles were all visually compared to the NVSL collection of 526 unique profiles, including the 16 reference serovars and vaccine strain TD045.
DNA purification for WGS
Fresh cultures were grown on a blood agar plate overnight at 37°C for collection of purified DNA using the MasterPure DNA Purification Kit (Epicentre, Madison, WI), as per the manufacturer’s instructions with a few modifications. Briefly, 2–3 colonies of each isolate were picked and added directly to 300 µL of the tissue and cell lysis solution with 1 µL of proteinase K. The suspension was vortexed, and then incubated for 15 min at 65°C, with vortexing every 5 min. The suspension was cooled to 37°C, and then 1 µL of 5 µg/µL RNase A was added, mixed, and the suspension incubated at 37°C. After 30 min, the suspension was placed in an ice bath for 5 min. For DNA precipitation, 175 µL of a protein precipitation reagent was added to the lysed bacteria and mixed well. The cellular debris was pelleted via centrifugation at 16,168 × g for 10 min, and the supernatant containing the DNA was placed in clean tubes. Isopropanol (500 µL) was added. The tubes were inverted several times and centrifuged again for 10 min. The pellets were washed twice with 70% ethanol and, once all the ethanol was removed, were suspended in 35 µL of Tris–HCl and EDTA buffer from the MasterPure kit. The resuspended DNA was stored at 4°C if WGS was to be performed within a few weeks or at −20°C if later. The reference strain for serovar 3, P1059, was extracted on 3 separate occasions for repeatability.
WGS
The concentration of the reconstituted genomic DNA was determined (Qubit dsDNA BR assay, Qubit3.0 fluorometer, Invitrogen). The desired range was 20–50 ng/µL, and the isolates were diluted with distilled water to bring them into that range. Whole genome sequence was obtained (MiSeq Desktop Sequencer, 2×250 paired-end chemistry and the Nextera XT DNA Library Preparation Kit, Illumina, San Diego, CA), as per the manufacturer’s instructions. Genomes were deposited in the National Center for Biotechnology Information24 database under bioproject PRJNA362333 (https://goo.gl/1fwbmj).
Data analysis
The 40 isolates used in the pilot study were compared using both a reference-dependent and reference-independent pipeline. The reference-dependent pipeline consisted of selecting a reference genome, NC_002633, Pasteurella multocida subsp. multocida str. Pm70.21 Reference selection was made based on the isolate having been obtained from an avian host and being serovar 3. Sequences were aligned with Burrows-Wheeler Alignment,19 and SNPs were determined with Genome Analysis Toolkit22 using the haplotype caller. The SNPs were filtered using an allele call of 2 and a quality value of 300.
The reference-independent analysis was conducted using kSNP.10 The optimum kmer value used by kSNP for our dataset was 19, which was determined from running Kchooser in the kSNP program. Core SNPs as well as 0.5 majority SNPs were evaluated. A subset of the NVSL isolates were compared to other assembled genomes from other organisms in the Pasteurellaceae family. The study isolates grouped with the P. multocida genomes available on PATRIC,37 an online resource for genome assembly, and separately from genomes of other genera and species. The tree was rooted using ATCC_43325, Pasteurella dagmatis, obtained from PATRIC as an outgroup. Raw reads were trimmed using BBDuk (https://goo.gl/X4qsEV) and identified using the Kraken standard database.40 Reads identified as Pasteurella were assembled using ABySS31 v.1.5.2. Assembled contigs were used in kSNP. To determine the LPS types, as developed in a previous publication, in silico assembled genomes were queried using the primers for the multiplex PCR.12
Results
The approximate depth of coverage was 127X (Supplementary Table 2). The total number of bases used in kSNP for all of the isolates was 2.1–2.4 million bases, as expected. When analyzing the 40 pilot sequences with the reference-dependent pipeline, the aligned reads only covered the reference genome 90–94%, suggesting a large amount of diversity. As the reference-dependent pipeline only allows the use of sequences that align to the reference, we used the reference-independent method, kSNP, for the rest of the study to avoid any bias introduced by unmapped reads. The isolates for WGS were analyzed in 3 different runs over 2 y as more isolates were incorporated into the study, each run integrating the previously run isolates. In each of these runs, the isolate grouping was consistent.
Of the 166 isolates sequenced, 163 had acceptable results; 3 were contaminated and consequently removed from further analysis. The diverse nature of the Pasteurella isolates was confirmed using kSNP because only 444 SNPs were considered “core SNPS” or included in all 163 isolates. In contrast, when the SNP calling parameters were set to 50% majority, 100,246 SNPs were called. The 50% majority SNP difference between all isolates was 20,000–50,000. The number of SNPs in 50% majority of the genomes within a single outbreak (Minnesota isolates in Table 2) was 50.
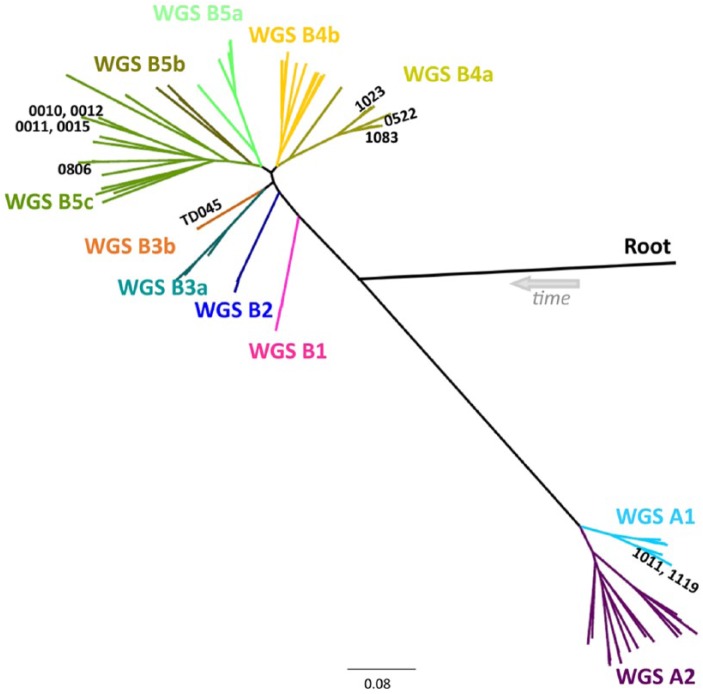
The maximum likelihood tree output by kSNP (Fig. 1) was used to evaluate strain relationships based on the observed SNP differences. Starting from the root, the isolates initially split into 2 major groups with 44 isolates branching together and the remaining 119 isolates on a separate branch. The isolates were classified based on these 2 initial groups and then subgroupings from the main central branch. The first letter, capitalized A or B, grouped the isolates into the 2 halves of the tree (44 isolates on branch A, 119 isolates on branch B). The number indicated a branch off the main central branch. The lower case letter breaks some of those branches down further based on the visual distance from the other samples on the branch.
Figure 1.
Whole genome sequence (WGS) results of all 163 isolates. The isolates were diverse but divided into 11 distinct groups. The root location was determined by comparing the Pasteurella multocida isolates to P. dagmatis. The restriction endonuclease analysis profiles matched 100% with the WGS results.
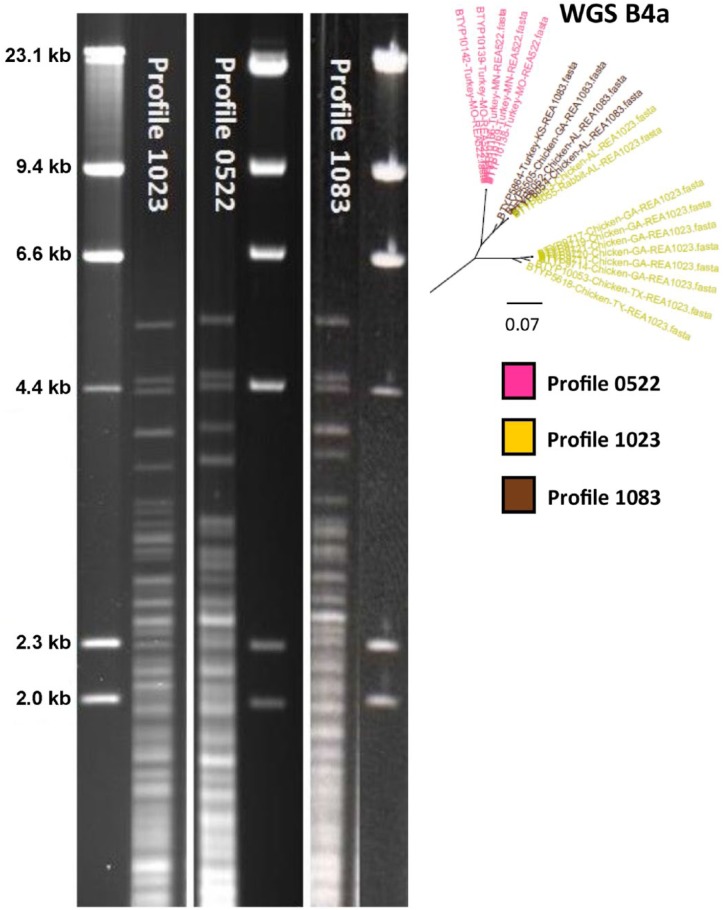
When comparing archived REA profiles against the WGS results, several errors were identified in the REA profiles. Profiles 1030 and 1418 were identical, so the 1418 profiles were renamed 1030. Profile 1214 was identical to profile 1006, so the 1214 profiles were renamed 1006. Two profiles were found to be very similar, profiles 1023 and 1083. After reviewing the 1023 profiles, it was found that profile number 1023 was actually 2 distinct profiles (Fig. 2). The older profile remained labeled 1023, and the newer profile was renamed 0522. While examining these, we also discovered that isolate BTYP 5864, which was originally identified as profile 1023, was actually profile 1083. Profiles 0522, 1023, and 1083 were very closely oriented in the phylogenetic tree, section B4a (Fig. 1), and mostly clustered by REA profile. However, using the kSNP phylogenetic tree, relationships between individual isolates was unreliable and were measured back to the closest common ancestor. BTYP 6055 was isolated from a rabbit; the other isolates with profiles 0522, 1023, or 1083 were collected from poultry. The LPS-mPCR genotype of all of the isolates with profiles 1023, 1083, and 0522 was type L3.
Figure 2.
Agarose gel restriction endonuclease analysis (REA) profiles with HhaI of profiles 1023, 0522, and 1083. DNA from bacteriophage lambda was used as a marker. Profiles 1023 and 0522 were originally all classified as profile 1023. All 3 REA profiles shared many similarities but there are distinct differences below the 4.4 Kb marker. The whole genome sequence results show that all 3 profiles are very similar but do divide based on profile identification, with the exception of BTYP 6055 and BTYP 6053.
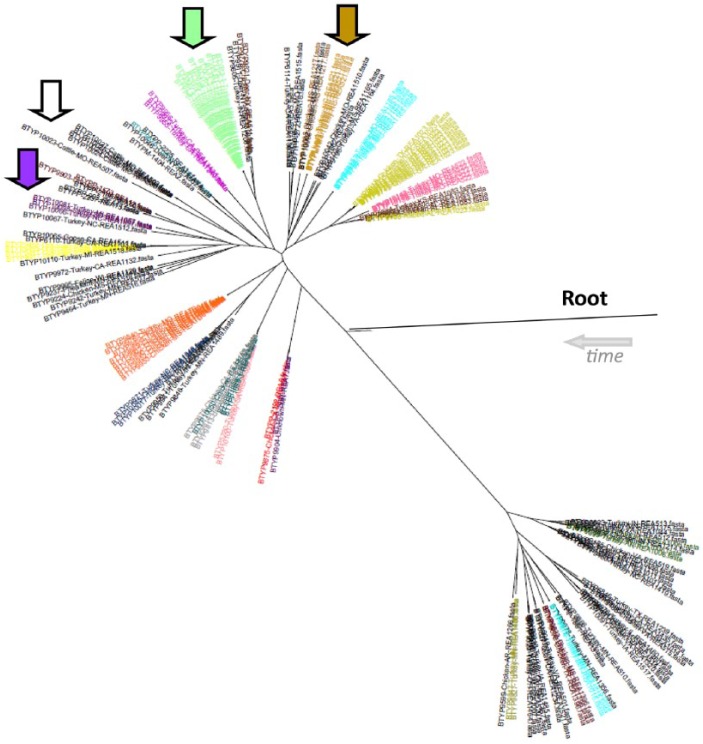
Two batches of isolates were obtained from 2 different submitters with an ongoing outbreak of fowl cholera. One facility was located in North Carolina and the other in Minnesota. The isolates from Minnesota matched a previously submitted REA profile, profile 1519. They were all serovar 1. All 12 of those isolates shared a common ancestor on the phylogenetic tree, section B5a. The isolates from North Carolina clustered together in section B4b, which was a new wild type based on REA, labeled profile 0521. They serotyped as 4,12,14. Both of these sets of isolates are indicated by arrows in Figure 3.
Figure 3.
Phylogenetic tree with restriction endonuclease analysis (REA) profile color coding. All of the isolates in black are individual different REA profiles. Colors other than black indicate matching REA profiles to other isolates of the same color. Phylogenetic tree grouping was supportive of the REA profiles indicated by similar or identical REA profiles appearing on the same branch. The green arrow indicates the isolates from Minnesota and the brown arrow indicates the isolates from North Carolina (see Table 2), showing that isolates from a single outbreak clustered as expected. The white arrow indicates the location of the cattle isolates, which were not the same REA profile but were from the same submitter. The purple arrow indicates the isolates with REA profile 1057 clustered.
Eight isolates that matched the TD045 REA profile were tested. The designation TD045 was given to isolates with a profile identical to the attenuated vaccine strains of Clemson University (CU), M-9, and PM-1 origin. This does not imply that infection was the result of the use of attenuated vaccine.38 The 8 isolates all came from poultry between November 2012 and October 2013. One was from Missouri, 6 from Mississippi, and 1 from Michigan. The serovars were 3; 3,4; and 3,12. All 8 isolates were clustered in section B3b (Fig. 1). There were no other isolates on that node as was seen in Figure 3 where the TD045 isolates were all color coded in orange.
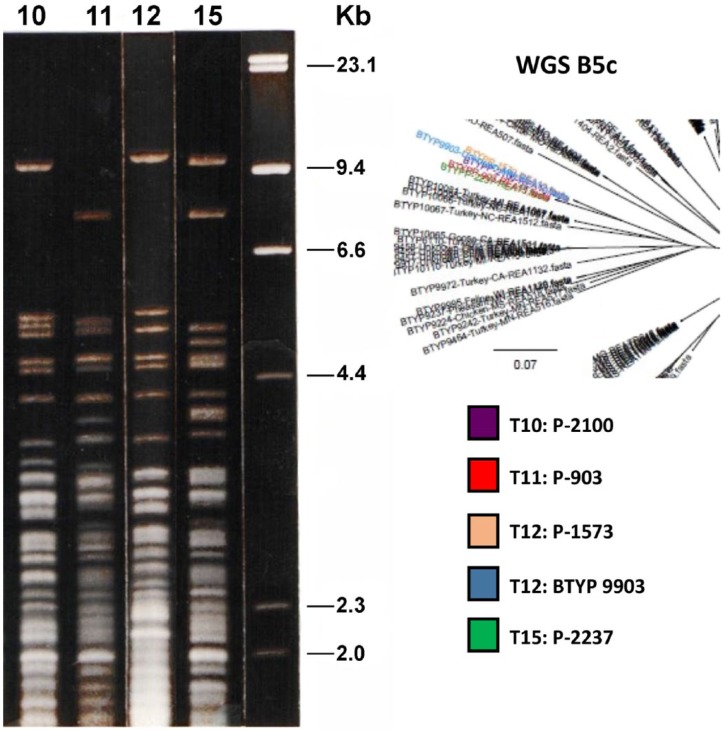
Surprisingly, several of the reference serovars grouped closely by WGS. One example was the reference strains for serovars 10 (P-2100), 11 (P-903), 12 (P-1573), and 15 (P-2237), all in section B5c (Fig. 4). P-903 and P-2237 were on the same branch, and closely related was P-2100 and P-1573 on the same branch along with BTYP 9903. The REA profile of BTYP 9903 matched the P-1573 REA profile, and it was also a serovar 12. All of the isolates were in the L6 group based on the LPS-mPCR.
Figure 4.
Agarose gel restriction endonuclease analysis (REA) profiles with HhaI of 4 reference strains (P-2100, P-903, P-1573, P-2237) and BTYP 9903. DNA from bacteriophage lambda was used as a marker. The purple, red, peach, and green nodes are the reference strains for T10, T11, T12, and T15 (respectively) used in gel diffusion precipitin testing (GDPT). On the tree, T10 and T12 shared a common ancestor, and their REA profiles were very similar above 3.0 Kb. T11 and T15 also shared a common ancestor but were more diverse in REA profile, although multiple bands do align between the 2 profiles. This illustrates that different GDPT serovars did not necessarily mean the isolates were diverse.
It appeared that REA profiles with similar banding patterns were more closely related by WGS than profiles with more diverse patterns. Similar profiles were defined as profiles with the majority of the bands lined up and <10 bands above 2.3 Kb different. Isolates with similar profiles were either on the same branch or shared a common ancestor. For example, the core SNP counts between 2 isolates with REA profile 1023 was 5,691, and the number of SNPs in at least 50% of the genomes was 8,617.
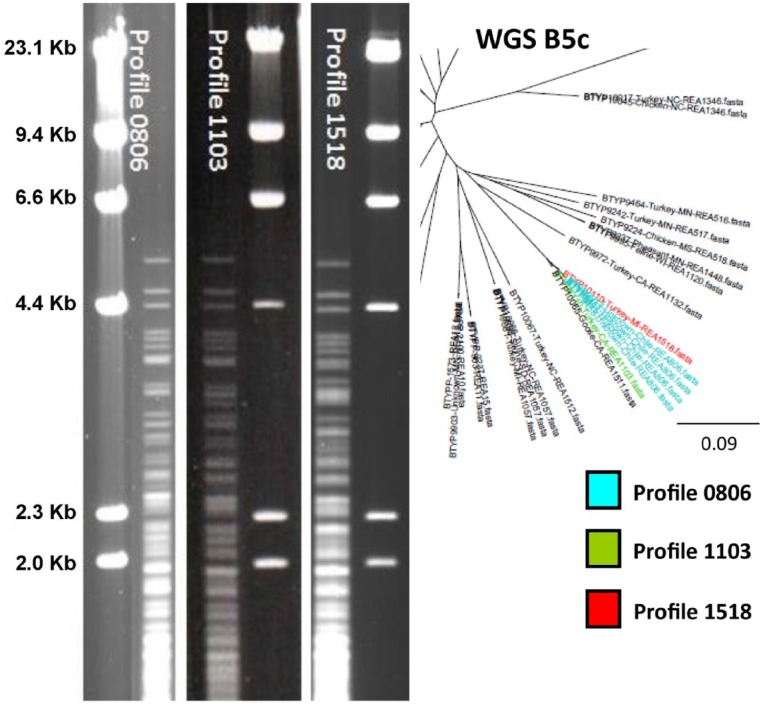
As expected, the GDPT serovars varied somewhat within REA profiles. In most cases, the isolates had a single common reaction to 1 of the 16 reference serovars with other possible cross-reactions occurring. Four of the isolates from the NVSL repository that originated from the same submitter in Chile (BTYP 9455, 9457, 9458, 9917) were examples of isolates with a common serovar within a REA profile. These all had identical REA profiles labeled 0806. On the phylogenetic tree, all 4 isolates were in the same cluster, section B5c (Fig. 5). The Chilean isolates shared a common ancestor with profiles 1518 and 1103 (BTYP 10110 and 6110, respectively). Three of the Chilean isolates were submitted together and all serotyped as 4,7. The fourth Chilean isolate was serovar 4. The serovars associated with profile 1103 based on NVSL data have been 4,7,12 and 3,4,7. The serovar for profile 1518 was 3,4. All of these isolates shared the serovar 4 reaction, but for each isolate other serovars were present as well.
Figure 5.
Agarose gel restriction endonuclease analysis (REA) profiles with HhaI of profiles 0806, 1103, and 1518. DNA from bacteriophage lambda used as marker. The first 7 bands are identical. Profile 1103 (BTYP 6110) had a similar REA profile to both 0806 and 1518, with more bands in common with profile 0806. The profiles group very closely on the phylogenetic tree as well.
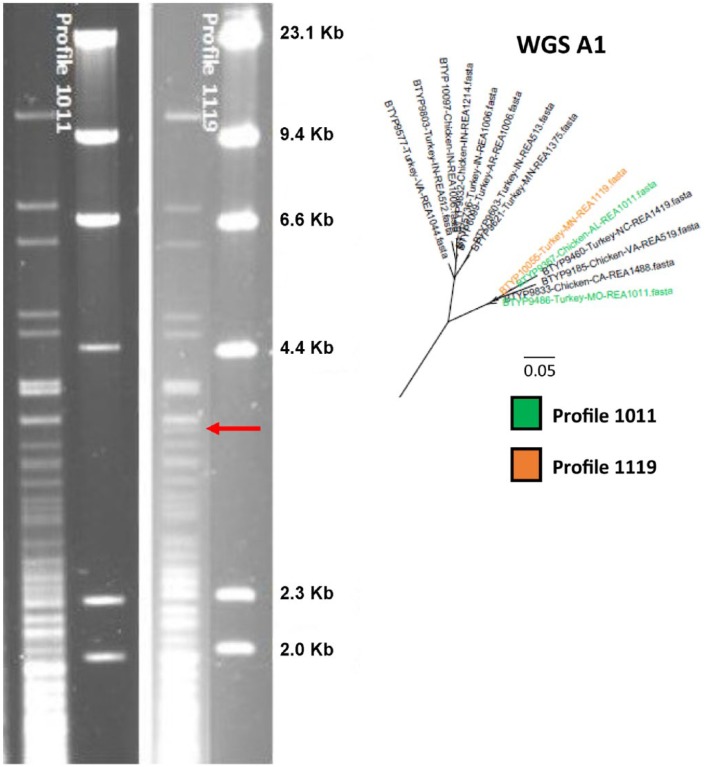
There were a few cases in which isolates with similar REA profiles had completely different serovars. REA profiles 1011 (BTYP 9486, 9367) and 1119 (BTYP 10055) differed by only 1 band. All 3 isolates grouped very closely (Fig. 6) in section A1. BTYP 10055 was serovar 15; however, both isolates with profile 1011 were serovar 1. The LPS genotype for all these isolates was L1.
Figure 6.
Agarose gel restriction endonuclease analysis (REA) profiles with HhaI of 1011 and 1119. DNA from bacteriophage lambda was used as a marker. Profile 1119 had an extra band between 4.4 Kb and 2.3 Kb indicated by the red arrow, and they become more diverse around 3.0 Kb. These profiles shared a common ancestor on the phylogenetic tree.
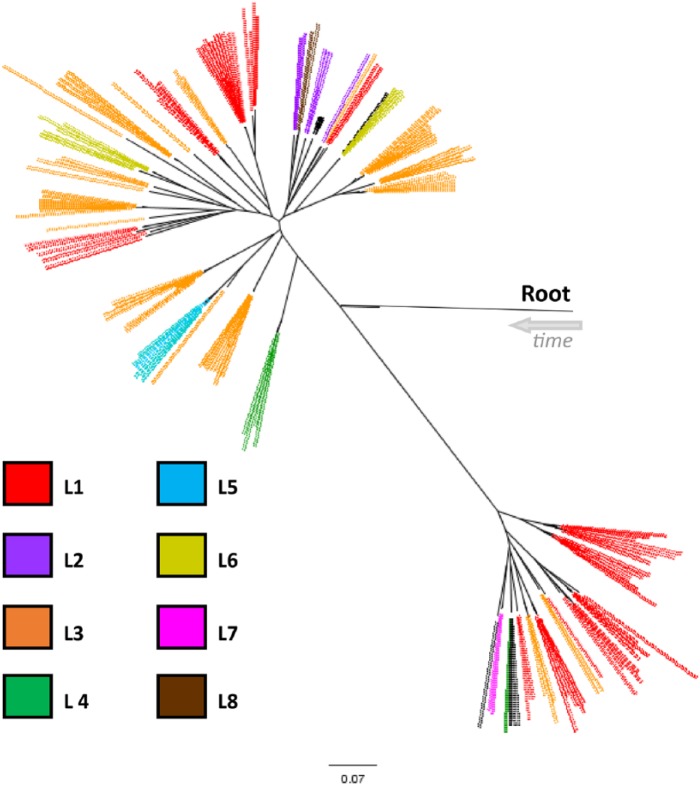
Using the in silico LPS analysis, all but 9 of the isolates were able to be placed into 1 of the 8 (L1–L8) groups previously reported12 (Supplementary Table 3). The 16 reference strains used in our study also matched the groups to which they were previously assigned.12 Although the LPS groups tended to cluster, the same groups were repeated throughout the branches of the phylogenetic tree (Fig. 7).
Figure 7.
The lipopolysaccharide (LPS) genotypes defined previously.12 The color black indicates isolates that did not fall into any of the LPS multiplex PCR genotypes. The LPS genotypes were not conserved to a specific area on the phylogenetic tree.
There did not appear to be any discrimination between isolates from different animal species. The majority of the isolates were from poultry but the few exceptions of non-poultry isolates clustered within the poultry isolates. For example, all 3 isolates with REA profile 1057 clustered together in B5c on the phylogenetic tree, as indicated by the purple arrow in Figure 3. Two of those were isolated from turkeys (BTYP 10066, 10081); the third was isolated from a pig (BTYP 10098). In another example, 3 deer isolates were submitted from the same submitter in New York over a period of 2 y. None of them had the same REA profile, but 2 of them grouped closely (BTYP 9821, 9911) in section B5a. However, BTYP 9821 did have an identical REA profile (profile 0511) with an isolate from a chicken in Pennsylvania (BTYP 9778), and these 2 isolates shared a node on the phylogenetic tree in section B5a. BTYP 9911 was nontypeable but the other deer isolates and BTYP 9778 were all serovar 1. All 3 deer isolates were type L1 based on the LPS-mPCR. The only cattle isolates represented in our study were all from the same submitter submitted on the same date and, as expected, they did cluster in the same area of the phylogenetic tree, section B5c, indicated by the white arrow in Figure 3. Minus the P-1591 reference strain, only avian isolates were on branch A.
The geographic location of the isolates varied within clusters and REA profiles. Profile 0522 was isolated from Missouri and Minnesota. Profile 1057 was isolated from North Carolina, South Dakota, and Michigan. Profile 1006 was isolated from Arkansas and Indiana. Often when the isolates came from the same state, they were from the same submitter around the same time period. There were some exceptions but, in general, it appeared that the profile or cluster was not limited to geographic location.
Discussion
Only 444 core SNPs were shared among all genomes in our study, demonstrating not only the breadth of samples represented, but also the high diversity within the P. multocida species. Given this diversity, aligning all of the isolates to a single reference strain could severely bias results. However, kSNP, a reference-independent method based on the kmer principle,10 was able to portray relationships between isolates as expected based on the REA profiles, even correcting errors, and offering better resolution. In the future, it would be beneficial to publish several reference strains that represent the diversity found within the species, thus allowing for a higher resolution reference-based pipeline.
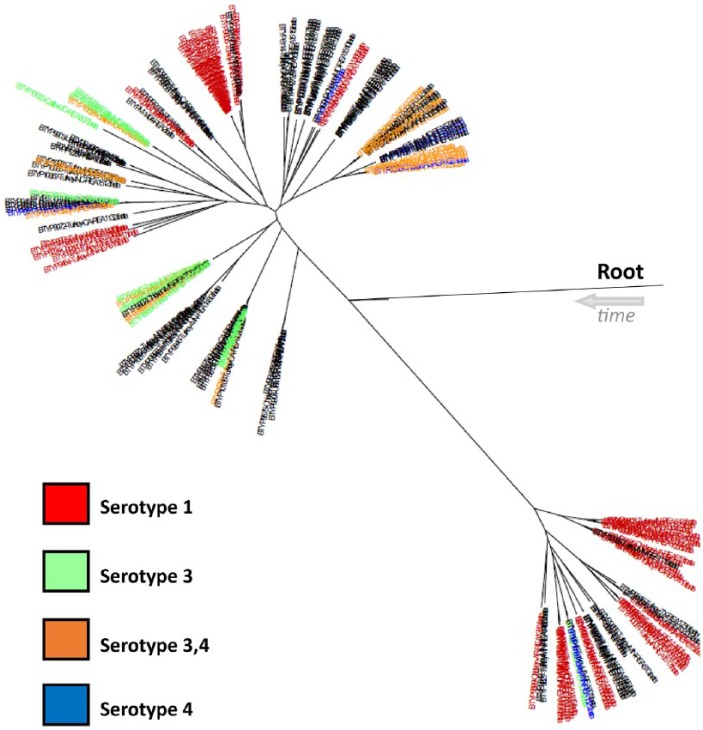
The cross-reaction issue observed in our study with GDPT has been documented previously.26,27,32,38 In most cases, these data showed that a single serovar often reacted to the same antigen within the same REA profile, but there was enough variability to make GDPT an unreliable typing method. Figure 8 shows the multiphyletic nature of 4 common serovars throughout the tree. Although GDPT did show some clustering within the tree, the 16 different serovars did not group into distinct branches on the phylogenetic tree. This was evident when examining the 4 reference strains (P-2100, P-903, P-1573, P-2237) that grouped very closely (Fig. 4). In silico analysis of the 8 LPS genotypes based on LPS-mPCR, shown in a previous study,12 show the same type of clustering as the GDPT results. The scattered clusters of serovars and 8 LPS genotypes throughout the tree suggest that GDPT serovars and LPS types do not correlate well to genetic relatedness. Although GDPT and LPS typing may have value for purposes other than genetic relatedness, these results suggest WGS is a superior genotyping method, able to differentiate isolates with much higher resolution and show evolutionary relationships.
Figure 8.
Serovars 1; 3; 3,4; and 4 were commonly seen serovars in our study and are represented by color in this tree, with black indicating a serovar other than the 4 listed. Gel diffusion precipitin test serovar results appeared to be somewhat consistent within a branch; however, the serovars were not contained in a designated area of the phylogenetic tree, evidence that serovar information did not guarantee relatedness.
Although the LPS-mPCR did not show genetic relatedness as well as the REA or WGS, it grouped isolates based on relatedness better than GDPT and again showed the faults in GDPT. The LPS genotypes for the 4 reference strains that clustered together on the phylogenetic tree (P-2100, P-903, P-1573, P-2237) all had the same LPS genotype of L6, which aligned with the WGS data but not the GDPT results. The LPS-mPCR also grouped all of the isolates with similar profiles of 0522, 1023, and 1083 into type L3. The LPS-mPCR data identified an error with GDPT on isolate BTYP 10055. This isolate was identified as serovar 15; the 2 isolates with similar REA profiles were serovar 1, but all 3 isolates were type L1. The LPS genotype in this case matched the REA and WGS results and suggested that the serovar 15 result on BTYP 10055 was incorrect. The L1 genotype had been found to contain reference serovars 1 and 14, whereas the reference strain for serovar 15 was L6.12 Another isolate for which the LPS genotype data was superior to the GDPT data was the deer isolate BTYP 9911. This isolate was nontypeable using GDPT but was LPS type L1. The other 2 deer isolates were also L1 and serovar 1. This allows correlation between the samples that GDPT was unable to make. These findings support the conclusions previously made that GDPT is not the ideal test for classifying P. multocida.12
A previous study compared genotypic and phenotypic methods used to look at isolates from fowl cholera outbreaks.32 The results from that study were similar to what we found comparing WGS and GDPT in our study. Serovars were observed to vary within an outbreak, and multiple serovars were present. In the previous study,32 genotypes were found to change over time within an outbreak, which is not an aspect we studied.
Both WGS and REA show the lack of genetic differences between isolates recovered from different host species. Previous studies have investigated the theory that wildlife3,34 or farm cats33 could be responsible for the spread of P. multocida, which could explain this finding. Closer examination of these data reveals spatial and temporal relationships that further supported this hypothesis. For example, BTYP 6055, which was isolated from a rabbit, grouped tightly on the phylogenetic tree with chicken isolates submitted on the same day by the same submitter.
The diversity with geographic location was more surprising. There were many cases of isolates with the same REA profile appearing in geographically diverse locations. Previous studies have suggested migratory birds as possible carriers of P. multocida,3,28 which is a possibility that could help explain geographic diversity. The epidemiologic data in our study was limited, so additional conclusions on this finding were not possible.
Although epidemiologic data are limited, there do not appear to be differences between the “A” and “B” lineages of P. multocida in our study. Several previous studies also noted a divide between isolates.1,2,6 One of these studies used multi-locus enzyme electrophoresis (MLEE), ribotyping, biovars, and GDPT to compare Australian avian isolates.2 Both the ribotyping and MLEE identified a subgroup of P. multocida that was not related to subspecies.2 The ribotyping and MLEE clusters were also serologically diverse2 as seen in the WGS data presented here. Another study using multi-locus sequence typing (MLST), also identified lineages in P. multocida field isolates that could not be explained phenotypically.1 The authors theorized that these lineages could represent incipient species.1 The Heddleston 16 reference strains divided the same in the MLST study as in our study, with all but P-1581 and P-1591 grouping in the same lineage (with the exception of P-1059 falling in an intermediate position in the MLST data). A third study that noticed 2 lineages using 16s ribosomal (r)RNA incorporated a wider variety of species.6 Minus a single exception, the 16s rRNA results had only avian isolates in one of the lineages.6 The isolates used in our study had a similar occurrence with only avian isolates on branch A, with the exception of the reference strain P-1591 from a human. The 16s rRNA study suggested that one lineage had evolved to be adapted to a wide variety of host species, whereas the other lineage had an avian common ancestor and had become more specific to avian hosts.6 With multiple different studies using different tools all showing the same occurrence, the lineages within P. multocida should be investigated further.
One of the important benefits of REA over GDPT has been its ability to separate isolates with profiles matching several commonly used attenuated fowl cholera vaccine strains from other serovar 3,4 isolates.38 The isolates with REA profile TD045 all grouped together and well away from all the other profiles, as seen in Figure 1 section B3b. This was an important outcome to determine if WGS could be used in place of REA.
The WGS results compared very well with the REA profiles. The tree was able to verify that REA profiles with only a few bands different were closely related as hypothesized. REA profiles have been useful when isolates had identical profiles. However, a one-band difference resulted in a new profile number assignment. Considering P. multocida diversity and how quickly it has been shown to change within even a single outbreak,3 REA profiles become less informative. In contrast, WGS was able to show relatedness of samples, which provided much more prospective epidemiologic data than REA.
Although REA has been a valuable tool in identifying P. multocida isolates beyond serovar and recognizing the issue with GDPT cross-reactivity, the test has issues with subjectivity leading to classification errors that were subsequently corrected in our study by using WGS. Furthermore, REA testing is time consuming, requiring a 2-wk turnaround time, and also requiring a significant amount of technical time to visualize bands. Previous attempts, separate from our study, were made to implement software analysis for identification, but were unsuccessful. WGS on the other hand is easily completed within 7 d, and the kSNP analysis can be completed within 5 h as long as <200 samples are compared at the same time. These advantages may outweigh the higher reagent costs associated with WGS. Limitations of implementing WGS include the required expertise in computational methods, the amount of data storage and subsequent management, and the need to batch samples for sequencing to control costs. It would also be helpful to develop a classification system based on the WGS results for easier comparison of GDPT, REA, and WGS results. The section division classification done in our study was based on visual tree separation; a more concrete method would be preferable, such as a method based on specific genetic characteristics such as deletions or SNPs.
Supplementary Material
Acknowledgments
We thank the 2 farms for sending additional samples for testing. We especially thank Dr. Joseph Hermann for his critical review of the material. We are also grateful for sample selection advice from Christopher Tong and Marie Vendettuoli at the USDA Center for Veterinary Biologics. We also thank Patrick Camp and Tammy Anderson from NVSL for their technical assistance.
Footnotes
Declaration of conflicting interests: The authors declared no potential conflicts of interest with respect to the research, authorship, and/or publication of this article.
Funding: The authors received no financial support for the research, authorship, and/or publication of this article.
References
- 1. Bisgaard M, et al. Multilocus sequence analysis of Pasteurella multocida demonstrates a type species under development. Microbiology 2013;159:580–590. [DOI] [PubMed] [Google Scholar]
- 2. Blackall PJ, et al. Population structure and diversity of avian isolates of Pasteurella multocida from Australia. Microbiology 1998;144:279–289. [DOI] [PubMed] [Google Scholar]
- 3. Blehert DS, et al. Using amplified fragment length polymorphism analysis to differentiate isolates of Pasteurella multocida serotype 1. J Wildl Dis 2008;44:209–225. [DOI] [PubMed] [Google Scholar]
- 4. Boyce J, et al. Pathogenomics of Pasteurella multocida. In: Pasteurella multocida: Molecular Biology, Toxins and Infection. Berlin, Heidelberg: Springer, 2012:23–38. [Google Scholar]
- 5. Brogden KA, et al. A new serotype of Pasteurella multocida associated with fowl cholera. Avian Dis 1978;22:185–190. [PubMed] [Google Scholar]
- 6. Davies RL. Genetic diversity among Pasteurella multocida strains of avian, bovine, ovine and porcine origin from England and Wales by comparative sequence analysis of the 16S gene. Microbiology 2004;150:4199–4210. [DOI] [PubMed] [Google Scholar]
- 7. De Jong MF. Progressive and nonprogressive atrophic rhinitis. In: Straw BE, et al., eds. Diseases of Swine. 8th ed. Ames, IA: Iowa State University Press, 1999:355–377. [Google Scholar]
- 8. Deng X, et al. Comparative analysis of subtyping methods against a whole-genome-sequencing standard for Salmonella enterica serotype Enteritidis. J Clin Microbiol 2015;53:212–218. [DOI] [PMC free article] [PubMed] [Google Scholar]
- 9. Fournier PE, et al. Bacterial genome sequencing and its use in infectious diseases. Lancet Infect Dis 2007;7:711–723. [DOI] [PubMed] [Google Scholar]
- 10. Gardner SN, et al. When whole-genome alignments just won’t work: kSNP v2 software for alignment-free SNP discovery and phylogenetics of hundreds of microbial genomes. PLoS One 2013;8:e81760. [DOI] [PMC free article] [PubMed] [Google Scholar]
- 11.Glisson JR, et al. Fowl cholera. In: Saif YM, et al., eds. Diseases of Poultry. 12th ed. Ames, IA: Blackwell, 2008:739–758. [Google Scholar]
- 12. Harper M, et al. Development of a rapid multiplex PCR assay to genotype Pasteurella multocida strains by use of the lipopolysaccharide outer core biosynthesis locus. J Clin Microbiol 2015;53:477–485. [DOI] [PMC free article] [PubMed] [Google Scholar]
- 13. Heddleston KL, et al. Fowl cholera: gel diffusion precipitin test for serotyping Pasteurella multocida from avian species. Avian Dis 1972;16:925–936. [PubMed] [Google Scholar]
- 14. Hodgins DC, et al. Pasteurella and Mannheimia spp. infections. In: Coetzer JAW, et al., eds. Infectious Diseases of Livestock. 2nd ed. Vol. 3 South Africa: Oxford University Press, 2004:1672–1676. [Google Scholar]
- 15. Johnson TJ, et al. Comparative genome analysis of an avirulent and two virulent strains of avian Pasteurella multocida reveals candidate genes involved in fitness and pathogenicity. BMC Microbiol 2013;13:106. [DOI] [PMC free article] [PubMed] [Google Scholar]
- 16. Köser CU, et al. Routine use of microbial whole genome sequencing in diagnostic and public health microbiology. PLoS Pathog 2012;8:1–9. [DOI] [PMC free article] [PubMed] [Google Scholar]
- 17. Kwong JC, et al. Prospective whole genome sequencing enhances national surveillance of Listeria monocytogenes. J Clin Microbiol 2016;54:333–342. [DOI] [PMC free article] [PubMed] [Google Scholar]
- 18. Langan GP, et al. Respiratory diseases of rodents and rabbits. Vet Clin North Am Small Anim Pract 2000;30:1309–1335. [DOI] [PMC free article] [PubMed] [Google Scholar]
- 19. Li H, et al. Fast and accurate short read alignment with Burrows–Wheeler transform. Bioinformatics 2009;25:1754–1760. [DOI] [PMC free article] [PubMed] [Google Scholar]
- 20. Loman NJ, et al. High-throughput bacterial genome sequencing: an embarrassment of choice, a world of opportunity. Nat Rev Micro 2012;10:599–606. [DOI] [PubMed] [Google Scholar]
- 21. May BJ, et al. Complete genomic sequence of Pasteurella multocida, Pm70. Proc Natl Acad Sci USA 2001;98:3460–3465. [DOI] [PMC free article] [PubMed] [Google Scholar]
- 22. McKenna A, et al. The Genome Analysis Toolkit: a MapReduce framework for analyzing next-generation DNA sequencing data. Genome Res 2010;20:1297–1303. [DOI] [PMC free article] [PubMed] [Google Scholar]
- 23. Moustafa AM, et al. Comparative genomic analysis of asian haemorrhagic septicaemia-associated strains of Pasteurella multocida identifies more than 90 haemorrhagic septicaemia-specific genes. PLoS One 2015;10:e0130296. [DOI] [PMC free article] [PubMed] [Google Scholar]
- 24. NCBI Reference Coordinators. Database resources of the National Center for Biotechnology Information. Nucleic Acids Res 2016;44:D7–D19. [DOI] [PMC free article] [PubMed] [Google Scholar]
- 25. Okay S, et al. Comparative genome analysis of five Pasteurella multocida strains to decipher the diversification in pathogenicity and host specialization. Gene 2015;567:58–72. [DOI] [PubMed] [Google Scholar]
- 26. Olson LD, et al. DNA fingerprint patterns of Pasteurella multocida from the same turkey farm on the same and different years. Avian Dis 2001;45:807–812. [PubMed] [Google Scholar]
- 27. Rimler RB, et al. Evaluation of the specificity of Pasteurella multocida somatic antigen-typing antisera prepared in chickens, using ribosome-lipopolysaccharide complexes as inocula. Am J Vet Res 1989;50:29–31. [PubMed] [Google Scholar]
- 28. Samuel MD, et al. Pasteurella multocida serotype 1 isolated from a lesser snow goose: evidence of a carrier state. J Wildl Dis 1997;33:332–335. [DOI] [PubMed] [Google Scholar]
- 29. Schürch AC, et al. Genomic tracing of epidemics and disease outbreaks. Microbial Biotechnol 2010;3:628–633. [DOI] [PMC free article] [PubMed] [Google Scholar]
- 30. Shallom SJ, et al. Comparison of genome diversity of Brucella spp. field isolates using Universal Bio-signature Detection Array and whole genome sequencing reveals limitations of current diagnostic methods. Gene 2012;509:142–148. [DOI] [PubMed] [Google Scholar]
- 31. Simpson JT, et al. ABySS: a parallel assembler for short read sequence data. Genome Res 2009;19:1117–1123. [DOI] [PMC free article] [PubMed] [Google Scholar]
- 32. Singh R, et al. Studies on the presence and persistence of Pasteurella multocida serovars and genotypes in fowl cholera outbreaks. Avian Pathol 2013;42:581–585. [DOI] [PubMed] [Google Scholar]
- 33. Singh R, et al. Epidemiology of fowl cholera in free range broilers. Avian Dis 2014;58:124–128. [DOI] [PubMed] [Google Scholar]
- 34. Snipes KP, et al. Pasteurella multocida in wild mammals and birds in California: prevalence and virulence for turkeys. Avian Dis 1988;32:9–15. [PubMed] [Google Scholar]
- 35. Snipes KP, et al. Use of an rRNA probe and restriction endonuclease analysis to fingerprint Pasteurella multocida isolated from turkeys and wildlife. J Clin Microbiol 1989;27:1847–1853. [DOI] [PMC free article] [PubMed] [Google Scholar]
- 36. Walker TM, et al. Whole-genome sequencing to delineate Mycobacterium tuberculosis outbreaks: a retrospective observational study. Lancet Infect Dis 2013;13:137–146. [DOI] [PMC free article] [PubMed] [Google Scholar]
- 37. Wattam AR, et al. PATRIC, the bacterial bioinformatics database and analysis resource. Nucleic Acids Res 2014;42(database issue):D581–D591. [DOI] [PMC free article] [PubMed] [Google Scholar]
- 38. Wilson MA, et al. Comparison of DNA fingerprinting and serotyping for identification of avian Pasteurella multocida isolates. J Clin Microbiol 1993;31:255–259. [DOI] [PMC free article] [PubMed] [Google Scholar]
- 39. Wilson MA, et al. Comparison of DNA fingerprints and somatic serotypes of serogroup B and E Pasteurella multocida isolates. J Clin Microbiol 1992;30:1518–1524. [DOI] [PMC free article] [PubMed] [Google Scholar]
- 40. Wood D, Salzberg SL. Kraken: ultrafast metagenomic sequence classification using exact alignments. Genome Biol 2014;15:R46. [DOI] [PMC free article] [PubMed] [Google Scholar]
- 41. Zhao G, et al. Use of restriction endonuclease analysis and ribotyping to study epidemiology of Pasteurella multocida in closed swine herds. Infect Immun 1992;60:1401–1405. [DOI] [PMC free article] [PubMed] [Google Scholar]
Associated Data
This section collects any data citations, data availability statements, or supplementary materials included in this article.


