. 2019 Apr 26;8:e46752. doi: 10.7554/eLife.46752

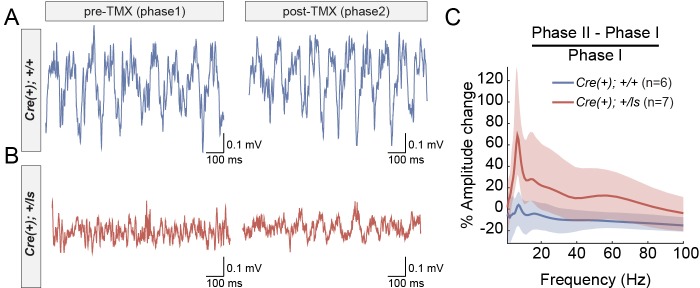
Figure 5. Increased amplitude of theta oscillations after SynGAP re-expression in adult Syngap1 mutant mice.

(A–B) CA1 LFP traces from a WT (A) and a Syngap1 mutant (B) mouse during Phase I and Phase II sessions. (C) Grand average of within-subjects changes in signal amplitude across the full spectrum of hippocampal rhythms. The amplitude change was normalized by the average amplitude during Phase I sessions. The shaded areas represent 95% bootstrapped confidence intervals. Significant increases in amplitude in Phase II were detected in the 6–12 Hz theta range (Permutation test: p=0.0128, 5000 shuffles). N’s are biological replicates (animals). Legends for Figure Supplements.

Figure 5.

Figure 5—figure supplement 1. Amplitude of theta oscillations in each mouse during Phase I and Phase II recording sessions.
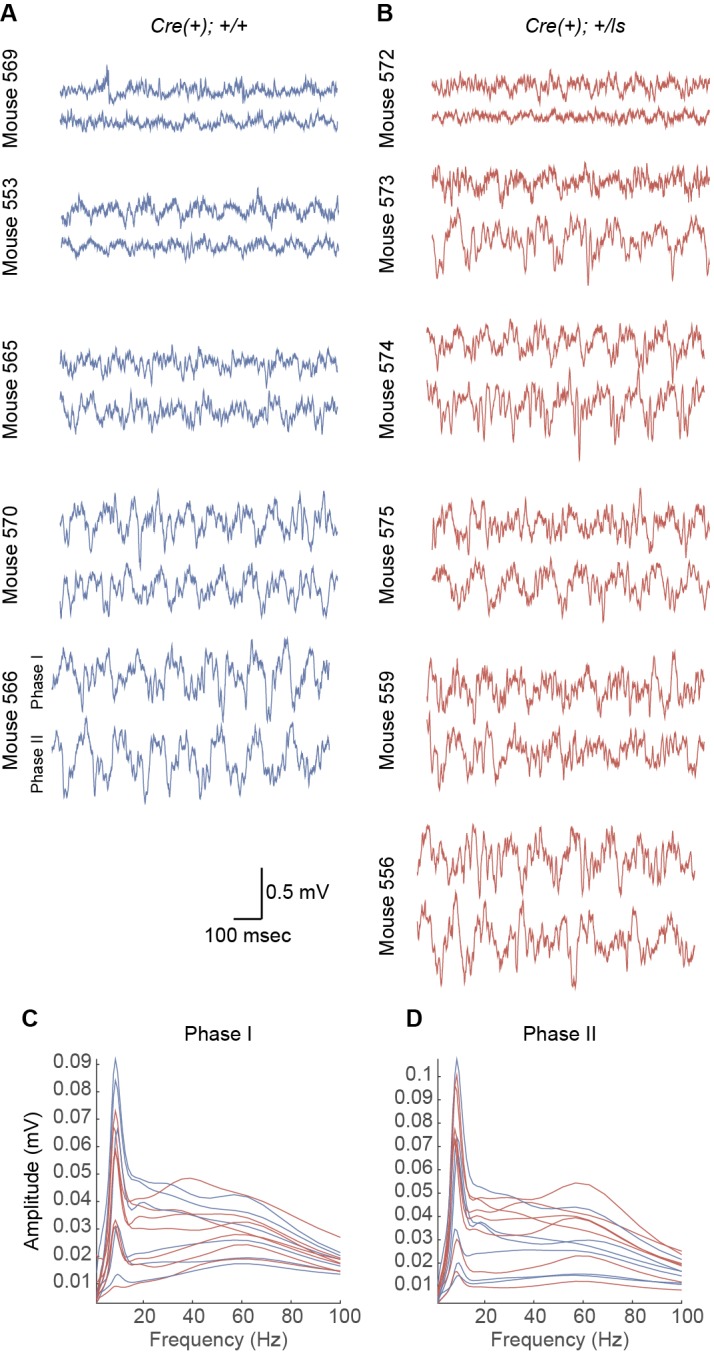
Figure 5—figure supplement 1.

(A–B) CA1 LFP recordings from WT (A) and Syngap1 mutant (B) mice during Phase I and Phase II sessions. (C–D) Average amplitude spectra for each mouse during Phase I (C) and Phase II (D) sessions. Individual mice are indicated with individual lines, and WT and Syngap1 mutant spectra are depicted in blue and red, respectively.

Figure 5—figure supplement 2. Effect of genotype, but not phase, on horizontal activity during neurophysiological recordings.

Figure 5—figure supplement 2.

Cre(+) WT and Cre(+) Lox-Stop mice were video tracked for distances traveled during the first ten minutes of recording during Phase I (TMX-) and Phase II (TMX+) sessions. RMANOVA- Group: F(1,12)=16.527, p=0.002; Phase: F(1,12)=0.164, p=0.692; Group x Phase: F(1,12)=3.521, p=0.085. Data points in bars represent biological replicates (animals). Legends for Supplementary Files.
Figure 5—figure supplement 2—source data 1. Source data for Figure 5—figure supplement 2.
DOI: 10.7554/eLife.46752.021