Abstract
Synovitis and joint effusion are common manifestations of rheumatic disease and play an important role in the disease pathophysiology. Earlier detection and accurate assessment of synovial pathology can, therefore, facilitate appropriate clinical management and hence improve prognosis. Magnetic resonance imaging (MRI) allows unparalleled assessment of all joint structures and associated pathology. It has emerged as a powerful tool, which enables not only detection of synovitis and effusion, but also allows quantification, detailed characterization and noninvasive monitoring of synovial processes. The purpose of this article is to summarize the pathophysiology of synovitis and to review the role of qualitative, semi-quantitative and quantitative MRI in the assessment of synovitis and joint fluid. We also discuss the utility of MRI as an outcome measure to assess treatment response, particularly with respect to osteoarthritis (OA) and rheumatoid arthritis (RA). Emerging applications such as hybrid PET-MRI and molecular imaging are also briefly discussed.
Keywords: Synovitis, Effusion, MRI, Osteoarthritis, Rheumatoid Arthritis
INTRODUCTION
The synovial membrane of diarthrodial joints is implicated in the initiation and progression of a wide range of degenerative, inflammatory and crystalline arthropathies. Magnetic resonance imaging (MRI) allows unparalleled assessment of all joint structures including the synovium, cartilage, and bone marrow amongst other articular structures (1). It allows noninvasive assessment of synovial volume, as well as active inflammation (assessed via increased vascularity detected with dynamic contrast-enhanced techniques).
International initiatives such as OMERACT (Outcome Measures in Rheumatology) and EULAR (European League Against Rheumatism) have emphasized standardization of MR assessment of synovial disease (2,3). The purpose of this article is to summarize the pathophysiology of synovitis and to review the role of qualitative, semi-quantitative and quantitative MRI in the assessment of synovitis and joint fluid. We also discuss the utility of MRI as an outcome measure to assess treatment response, particularly with respect to osteoarthritis (OA) and rheumatoid arthritis (RA). Emerging applications such as hybrid PET-MRI and molecular imaging are also briefly discussed.
PATHOPHYSIOLOGY OF SYNOVITIS
Normal Synovial Structure and Composition
The synovium is a thin connective tissue, which lines diarthrodial joints and tendon sheaths. Its chief function includes production of synovial fluid to lubricate the joint, chemical homeostasis, and provision of nutrition for chondrocytes (4). The normal synovium is multilaminar with its thicker outer layer, the subintima, being rich in type I collagen but relatively acellular (5). The inner layer, called the intima, consists of a layer of 1-4 cells, predominantly macrophages and fibroblasts, with the latter reflecting the dominant cell population in the healthy synovium (5).
The Diseased Synovium
Diseases of the synovium can be broadly classified as those related to anatomical structures (e.g. plicae), degenerative inflammatory synovial proliferation (e.g. osteoarthritis), autoimmune inflammatory synovial proliferation (e.g. rheumatoid arthritis or juvenile idiopathic arthritis), infectious synovial proliferation (e.g. pyogenic or tuberculous), crystal deposition disease (gout or pseudogout) and reactive synovitis. In this review, we will focus on the most prevalent of these diseases, specifically osteoarthritis, and rheumatoid arthritis.
Synovial Changes in Osteoarthritis (OA)
There is increasing evidence that low-grade inflammation induced by a combination of trauma, metabolism, innate immunity and inflammatory factors contributes to the pathogenesis of OA(6,7). Cartilage breakdown is mediated by both chondrocyte and synovial macrophage-derived inflammatory mediators (8). Trauma is a known trigger of local inflammatory mediators, and there is increasing evidence that obesity also increases systemic low-grade inflammatory mediators (9). Innate immunity also likely plays a role in the pathogenesis of OA, with a study demonstrating compromised T and B cell immune function in OA patients, beyond that expected for age (10).
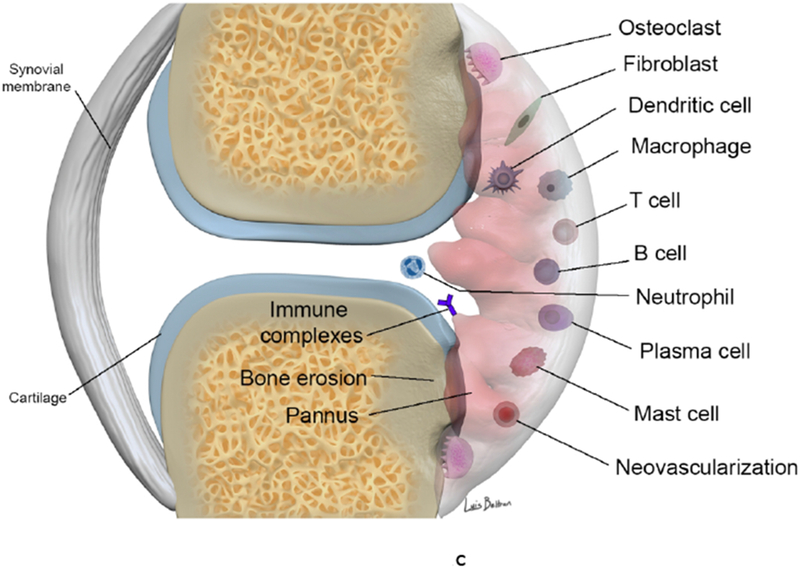
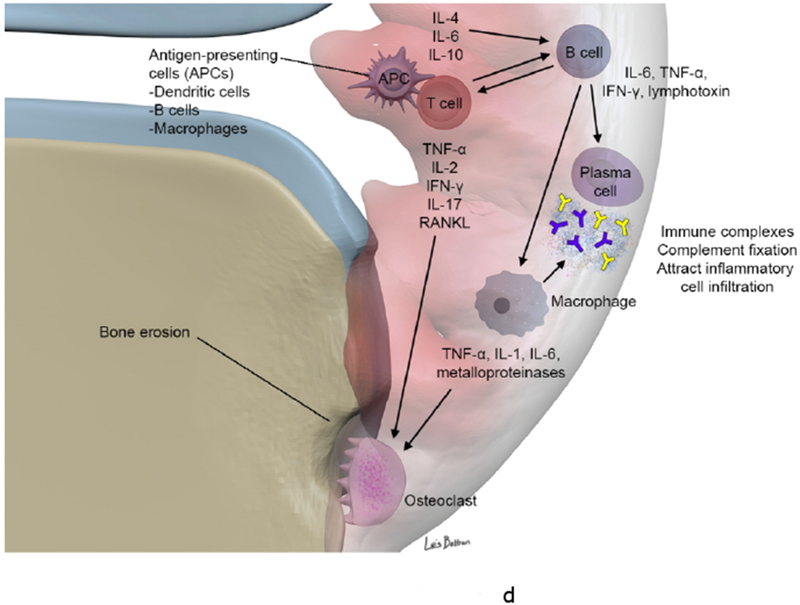
The synovium in OA is histologically characterized by thickening, hyperplasia, fibrosis and stromal vascularization (11). With immune activation, there is an influx of predominantly macrophages and T-cell lymphocytes, from the vascular compartment in response to cytokines and cell adhesion molecules (12) (13), with other contributing cells including synoviocytes and chondrocytes (14). Degradation of hyaline cartilage, subchondral bone, and other articular structures results in the release of inflammatory molecules, further promoting synovial inflammation. Synoviocytes produce pro-inflammatory mediators, which attract immune cells, promote angiogenesis and induce a phenotypic shift in chondrocytes (15). Chondrocytes produce additional cytokines and proteolytic enzymes causing a further increase in cartilage degradation and synovial inflammation (16). The diagram in Figure 1 depicts the processes involving the diseased synovium in OA and RA.
Figure 1.
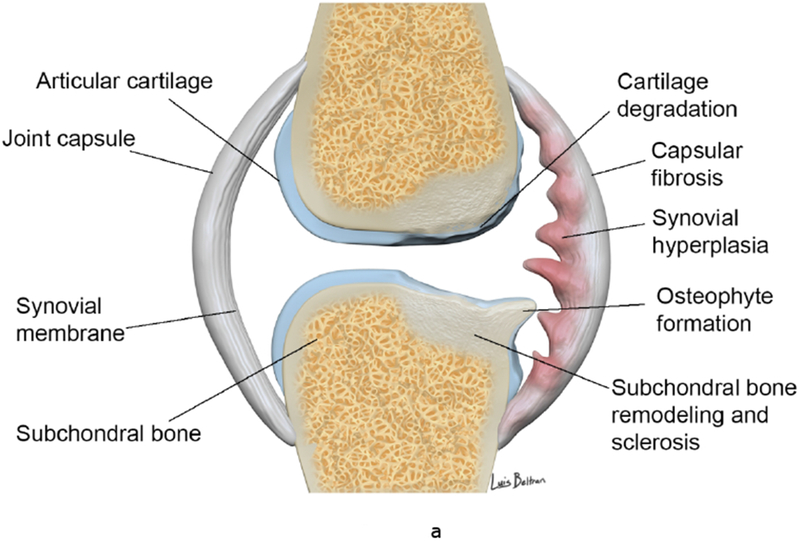
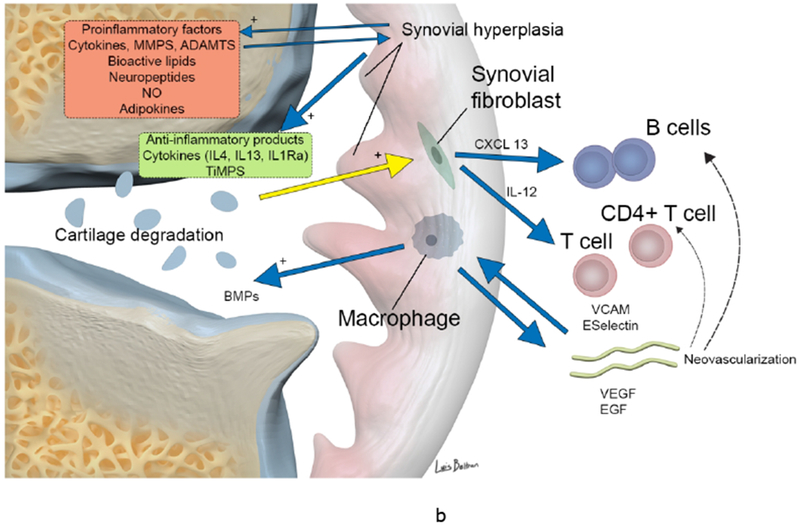
(a-b). Synovial involvement in OA pathophysiology. Degraded cartilaginous products within synovial fluid are phagocytosed by activated synovial cells within the inflamed synovium which in turn produce proinflammatory and catabolic mediators. Proteolytic enzymes promote cartilage breakdown creating a positive feedback loop. Inflammatory cytokines promoting enzymatic mediators of cartilage catabolism include MMPs and ADAMTS. The inflamed synovium also contributes to osteophyte formation via BMPs. Activated infiltrating macrophages, synovial B cells and T cells amplify this inflammatory response however the synovium and cartilage may also produce counteracting anti-inflammatory products such as IL-4, IL-13, IL1Ra and TiMPS.
(c-d). Synovial involvement in RA pathophysiology. The synovium is infiltrated with mature antigen presenting cells (APCs) (including dendritic cells, macrophages and B cells) and activated T lymphocytes, which interact to initiate and amplify T-cell-dependent immune responses, promoting chronic synovial inflammation. Activated T cells induce secretion of pro-inflammatory cytokines (in particular TNF α) from macrophages and synovial cells in a contact-dependent manner. Macrophages also function as osteoclast precursors, as well as providing specific molecular signals driving osteoclast formation. Numerous osteoclasts are found within the inflamed synovium adjacent to bone, creating resorption pits and causing local bone destruction through specific enzymes and a proton pump that enable them to degrade bone matrix and solubilize calcium. RANKL binds to receptors of pre-osteoclasts and mature osteoclasts and stimulates their activation and differentiation (together with TNF, IL-17 and IL-1). B cells contribute to immune complex formation and complement activation, act as APCs and contribute to T cell activation through expression of costimulatory molecules. B cells both respond to and produce the chemokines and cytokines that promote leukocyte infiltration into the joints, angiogenesis, and synovial hyperplasia.
ADAMTS a disintegrin and metalloproteinase with thrombospondin motifs, BMP bone morphogenetic protein, CXCL13 CXC-chemokine ligand 13, EGF endothelial growth factor, IFN-γ interferon γ, IL interleukin, IL-1Ra IL-1 receptor antagonist, LTB4, leukotriene B4, MMP matrix metalloproteinase, NO nitric oxide, RANKL receptor activator of nuclear factor κB ligand, TiMP tissue inhibitor of metalloproteinase, TNF tumor necrosis factor, VCAM, vascular cell adhesion molecule 1, VEGF vascular endothelial growth factor.
Synovial Changes in Rheumatoid Arthritis (RA)
Synovial proliferation is the hallmark of RA and is often seen early in the course of the disease. There is a progression to synovial pannus formation, periarticular bone demineralization, cartilage destruction and subchondral osseous erosions (17). Collagenase made at the synovial pannus-cartilage interface, is thought to be predominantly responsible for the erosions. Several other markers such as serum levels of immunoglobulin A (IgA), IgG and IgM rheumatoid factor (18), C-reactive protein (CRP) (1) and serum vascular endothelial growth factor (VEGF) (19) have also been shown to correlate with erosions on MRI (20).
Synovial Inflammation in Animal Models
Osteoarthritis
Post-traumatic OA models have shown synovial thickening and cellular infiltration to be the most frequent histological findings (21) (22). These changes occur rapidly, with synovitis most severe in the first two weeks after the insult (21,22). Noninvasive post-traumatic OA models have also shown that the severity of the synovial reaction may be related to the severity of the injury (23).
In an Anterior Cruciate Ligament (ACL) transection model, synovitis and cartilage erosions were reduced in CD4 deficient mice and slower progression of erosions was noticed in CD8 deficient mice. Anti-inflammatory approaches, for example, such as intra-articular IL-1Ra, to attenuate the acute phase have been tested in animal models and hold promise for prevention of OA, although the potential cessation of chronic inflammation and prevention of progressive structural change remains to be determined (24).
Rheumatoid Arthritis
There are several rodent models, which have significantly advanced the understanding of RA pathophysiology and contributed to advances in treatment (25). Animal models have also been used to identify optimal MRI contrast for evaluation of synovial pannus. In a rabbit knee model of synovitis, two gadolinium-based macromolecular intravascular contrast agents P792 (rapid clearance blood pool agent) and P717 (slow clearance blood pool agent) were compared to gadolinium-DOTA, a representative extracellular non-specific agent. While the high-molecular-weight P792 and P717 provided a progressive and persistent enhancement of arthritic synovial tissue, gadolinium-DOTA provided an early and rapidly declining enhancement with a concomitant diffusion in synovial fluid, therefore, limiting delineation of synovial pannus (26).
IMAGING OF SYNOVITIS AND JOINT EFFUSION
There is significant data to substantiate the use of MRI as a surrogate measure of histological synovitis (27) (28). Both dynamic MRI (27,29) and static MRI protocols (28) (30) have shown a correlation between MRI changes of synovitis and microscopic synovial inflammation assessed using hematoxylin and eosin (H&E) staining. Immunohistochemical analysis has also revealed a significant congruent relationship between MRI synovitis and CD4+ T cells (31), CD68+ sublining macrophage number (30) (29), cell proliferation (Ki67) and neoangiogenesis (CD31) (30). The consistent demonstration of a relationship between CD68+ sublining macrophage number and MRI synovitis is particularly significant as the only current synovial biomarker validated as a measure of disease activity (32). Correlation between MRI detected synovitis and degree of histological vascularity assessed through semi-quantitative H&E stain evaluation (33), expression of endothelial cell marker QBend30 (34), and von Willebrand factor expression (35), has also been reported.
Signs of inflammation on MRI also correlate with the volume of joint effusion on arthrocentesis (36). Although effusion and synovitis often coexist, they are not synonymous (37). Joint effusion volume has been shown to correlate with microscopic synovial inflammation but not macroscopic inflammation (27). A contrast enhanced-MRI-based study showed that synovitis may be present with or without effusion (37). Also, in a cohort without radiographic OA, baseline joint effusion but not synovitis predicted the development of tibiofemoral cartilage loss (38). Thus, inflamed synovium and effusion should be regarded as two distinct entities.
Standardization, and Reliability in MRI Assessment of Synovial Disease
International initiatives such as OMERACT and EULAR aim to promote standardization and reliability (39) (2) with a consensus MRI definition of joint pathologies and a core of basic MRI sequences. The suggested MRI sequences include T1-weighted imaging pre- and post-intravenous gadolinium contrast administration, T2-weighted imaging with fat saturation or short TI inversion recovery (STIR) imaging in at least two planes or three-dimensional projections with a maximum slice thickness of 3 mm (40).
Based on multi-center studies, a semi-quantitative OMERACT rheumatoid MRI Scoring (RAMRIS) system has been developed for assessment of synovitis, bone erosions and bone marrow edema (BME) in RA wrists and hands (41). OMERACT published two atlases in 2005, standardizing RAMRIS and documenting expert-agreed features to be measured. A EULAR–OMERACT RA MRI reference image atlas was also developed to provide a standardized reference tool for the assessment of RA joints, allowing semi-quantitative scoring for inflammatory and destructive changes (3) thereby improving the consistency of MRI scoring among different centers and studies. Similarly, Juvenile Arthritis MRI score (JAMRIS) and Psoriatic Arthritis MRI score (PsAMRIS) systems have also been developed.
The OMERACT definition of synovitis on MRI is an area in the synovial compartment that shows above normal, post-gadolinium enhancement of a thickness greater than the width of the normal synovium.
The Role of MRI in the Assessment of the Synovium
Non-contrast MRI
The normal synovial tissue has an intermediate signal on T1-weighted imaging and high signal on T2-weighted imaging. A variety of approaches using non-contrast MRI for assessment of synovitis have been proposed. One study utilized two axial sequences: T2-weighted sequence to assess synovial fluid and 3D spoiled gradient recalled (SPGR) sequence to assess the synovial membrane. The authors determined this technique to be accurate and reproducible, however, this remains untested against an established reference standard such as histology or contrast enhanced-MRI (42). Furthermore, differentiation between synovial fluid and thickening is not possible and it has been suggested that gradient echo-type sequences are particularly less suited for evaluation of synovitis as they are prone to chemical shift artifacts that compromise assessment of synovial thickness and differentiation from other surrounding structures (43).
Non-Contrast versus Contrast-Enhanced MRI
Non-contrast MRI is overall a useful clinical tool and therefore is commonly used to assess synovitis (44). In the knee, hypointense signal alteration in the Hoffa’s fat pad on non-contrast T1-weighted spin-echo images (45) and hyperintense signal on fluid-sensitive sequences such as fat-suppressed proton density (PD) or fat-suppressed T2 weighted spin-echo imaging sequences have been suggested as a surrogate marker for synovitis (44). However, there is increasing recognition of the limitations of non-contrast MRI in the assessment of synovitis.
Contrast-enhanced MRI is a more reliable measure of synovial inflammation, particularly in clinical trials as an outcome measure for therapeutic response. The most important advantage of contrast enhanced-MRI is that it allows differentiation between synovium and fluid (Figure 2). Inflamed synovium enhances after contrast administration, while an effusion usually does not enhance on static contrast-enhanced MRI. On non-contrast examinations, both synovium and effusion may be hyperintense on fluid-sensitive sequences (Figure 3). Roemer et al. compared fat saturated PD-weighted sequences and contrast-enhanced fat-saturated T1-weighted sequences for assessment of patellofemoral synovitis in OA and found only fair to moderate agreement between these techniques. Signal alteration in the Hoffa’s fat pad on non-contrast MRI was a sensitive (86–97%) but not a specific (10–38%) sign of synovitis (46). Loeuille et al. compared three MRI scoring systems for evaluating synovitis and joint effusion finding only contrast-enhanced MRI to correlate with microscopically proven synovitis, and no correlation with microscopic synovitis observed on non-contrast MRI (47).
Figure 2.
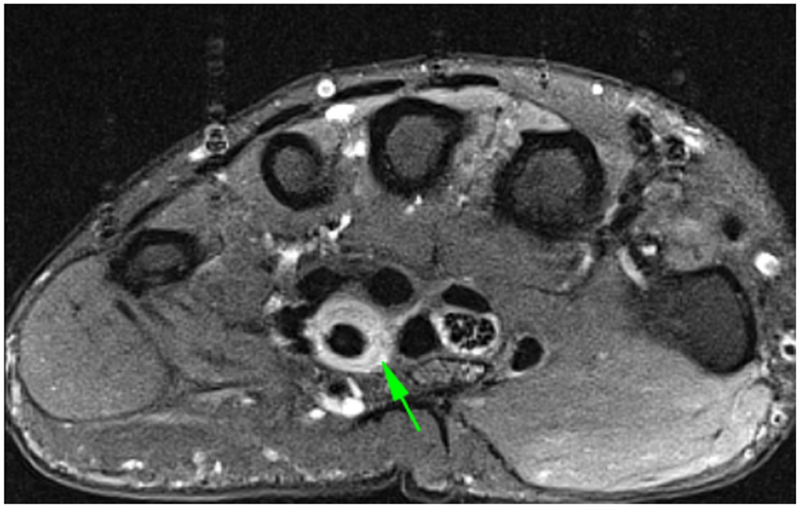
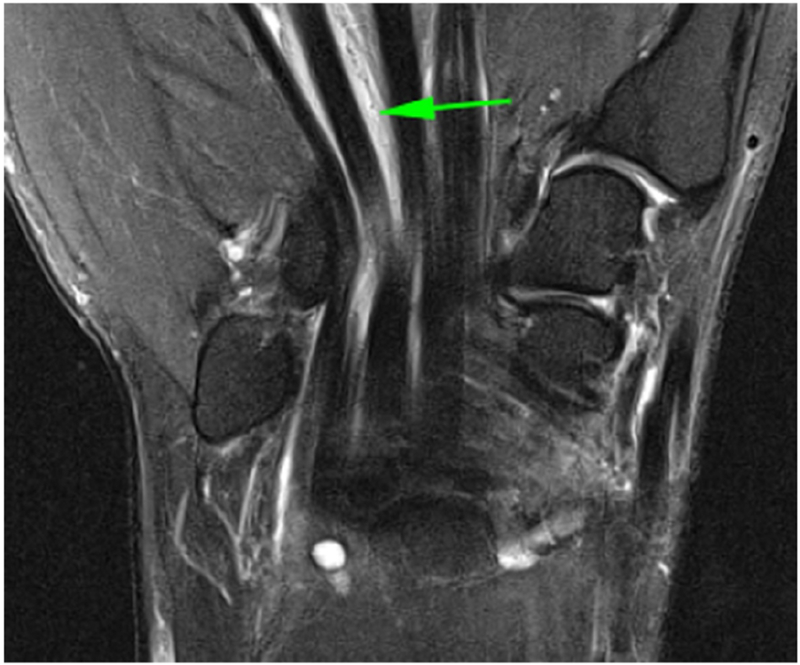
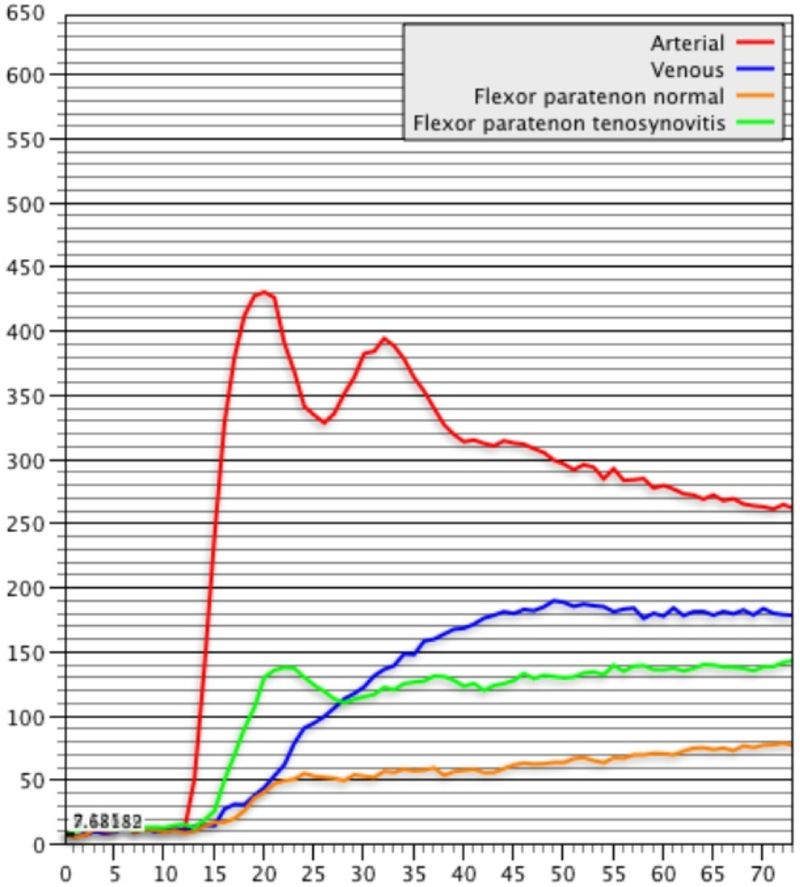
DCE-MRI of a patient with known Rheumatoid Arthritis and wrist pain. Axial (a) and Coronal (b) fat-suppressed post-contrast images demonstrating flexor tenosynovitis (green arrows). A corresponding time intensity curve (c) (y-axis=signal intensity and x-axis=time) shows fast initial enhancement followed by a plateau phase, with sustained late enhancement.
Figure 3.
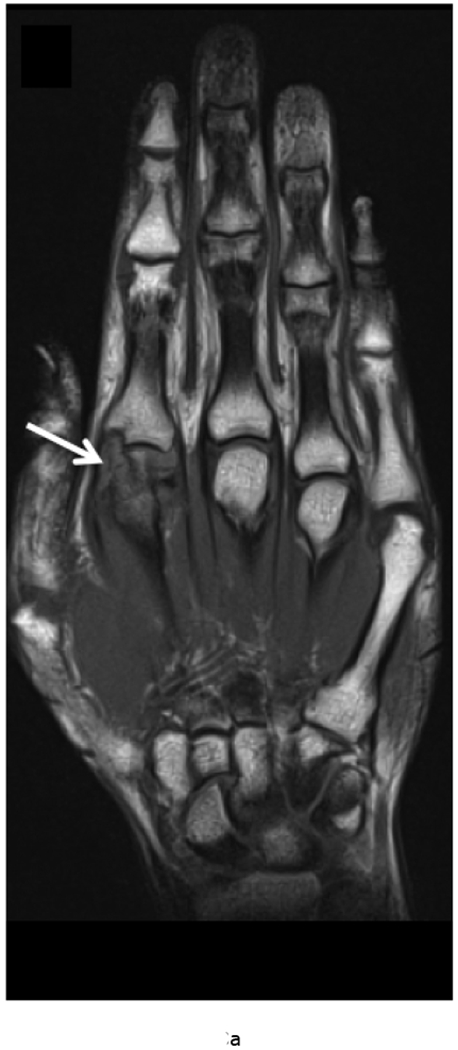
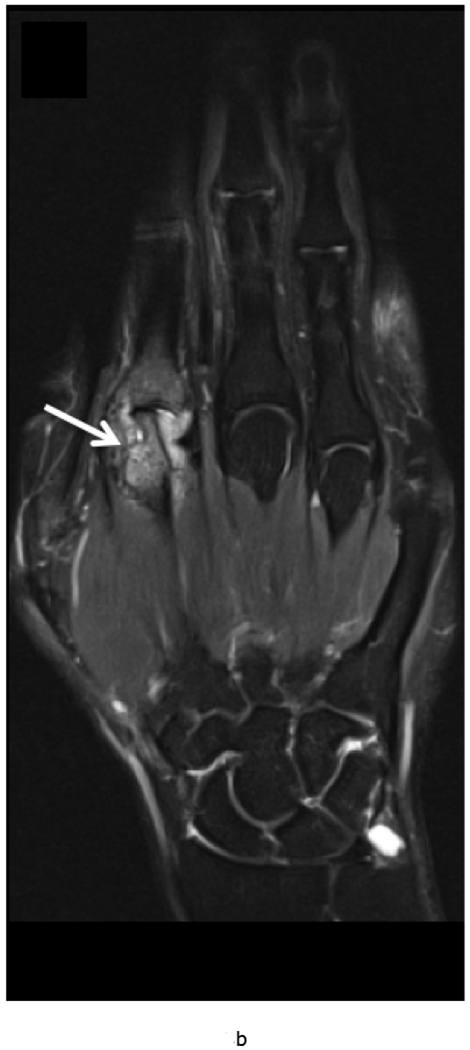
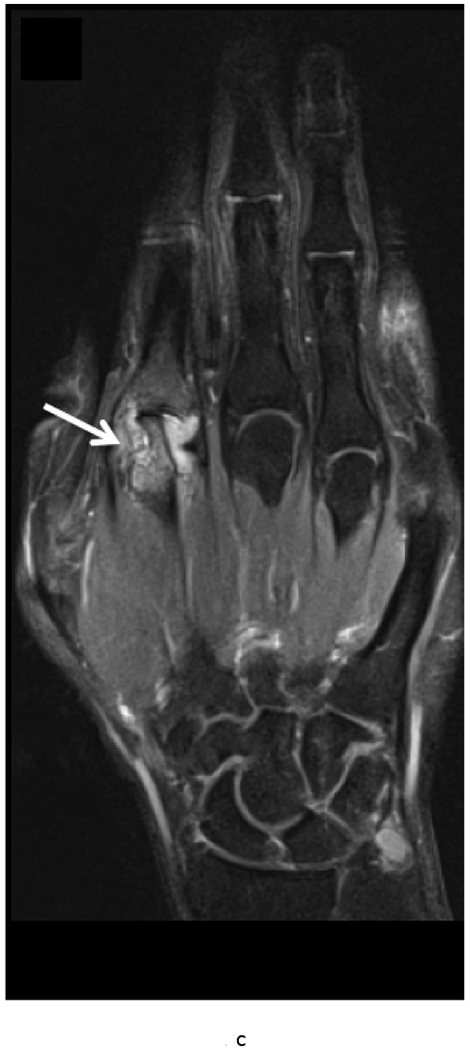
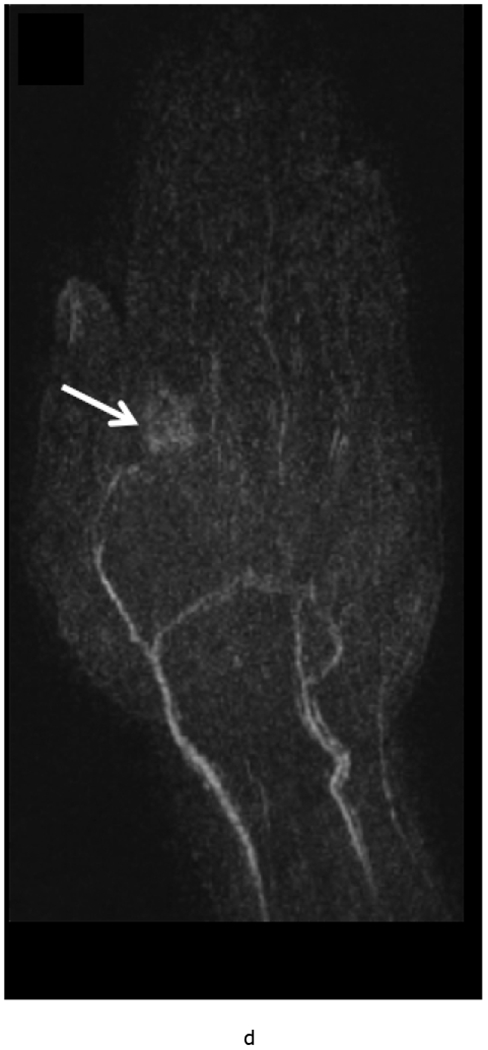
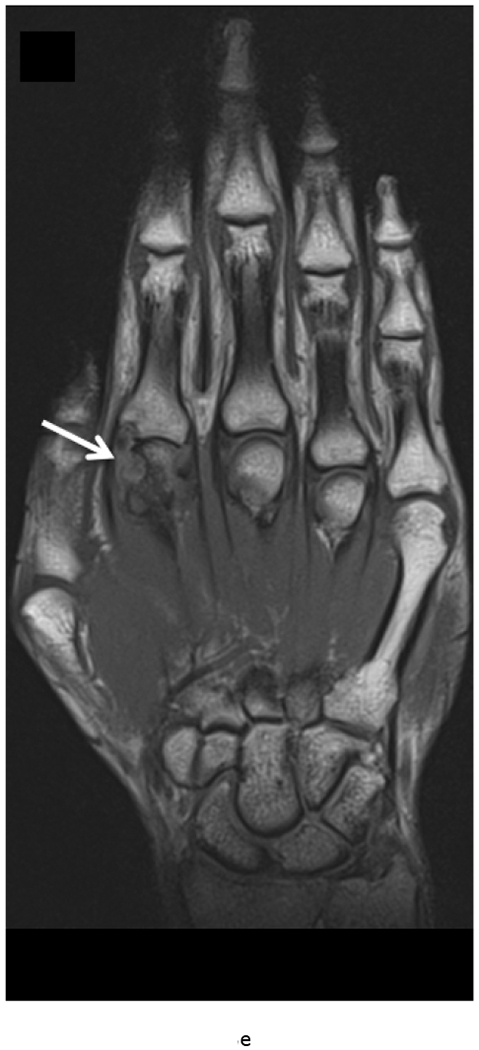
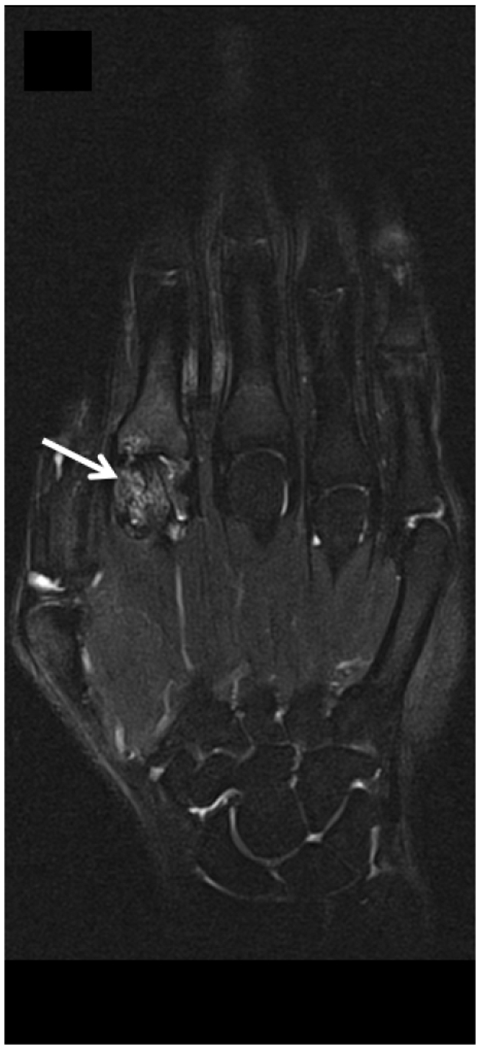
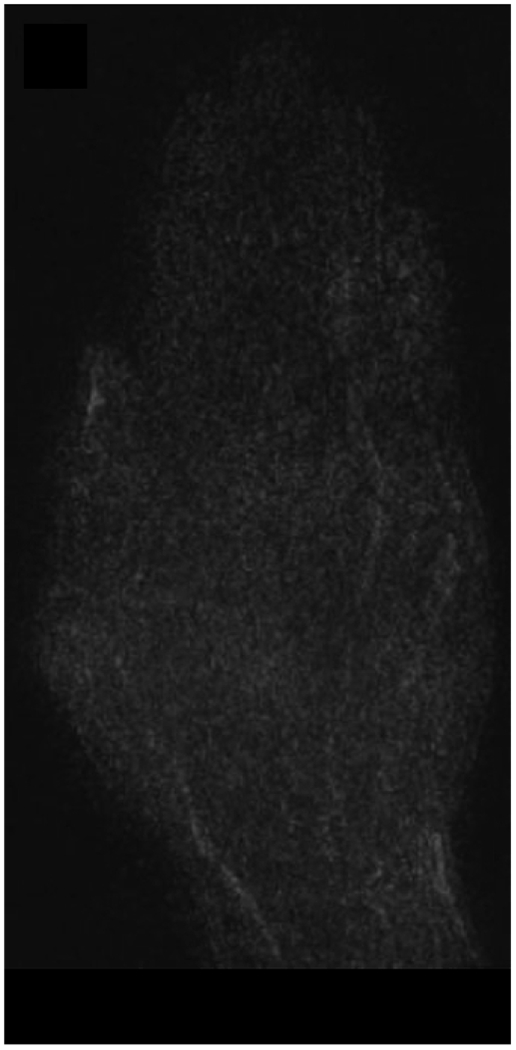
MRI of the right hand in a 29 year old male with Rheumatoid Arthritis recently diagnosed at baseline showing abnormal signal and erosion in the symptomatic 2nd mcp joint (arrows) on routine T1 and PD Fat saturated images (a, b). There is associated abnormal enhancement of the synovium indicated on the T1 post gadolinium enhanced images (c) and the dynamic contrast enhanced time resolved (TWIST) MIP sequence (d).
7 weeks after Anti-TNF treatment, MRI of the right hand showing abnormal signal and erosion in the symptomatic 2nd mcp joint (arrows) on routine T1 and PD Fat saturated images (e, f), which does not appear to have changed significantly with treatment compared to the baseline MRI scan. However, the dynamic contrast enhanced time resolved (TWIST) MIP sequence (g) shows relative absence of enhancement in this region, which suggests decreased vascularity after treatment.
Contrast-enhanced MRI detected synovitis has been shown to correlate with histology (48) and is more sensitive (49) and specific (46) than non-contrast MRI. Two large studies found a significant correlation between contrast-enhanced MRI-detected synovitis and Western Ontario and McMaster Universities Arthritis Index (WOMAC) pain score (50) (51), whereas a smaller study found no such correlation (52). These conflicting findings may be attributable to a much smaller sample size of the latter (400 compared to 20). Additionally, deviations in the synovitis scoring methods utilized by various investigators make a direct comparison of studies difficult. A reliable and validated scoring system, using contrast enhanced-MRI, such as presented by Guermazi et al. (51) may be useful for standardized evaluation of synovitis.
Static versus dynamic contrast-enhanced MRI
Static contrast-enhanced MRI
In static contrast-enhanced (SCE) MRI, images are acquired in one or two planes pre- and post-enhancement. In dynamic contrast-enhanced (DCE) MRI, T1-weighted volume acquisitions, are repeated over the same anatomical areas beginning at the time of injection and for several minutes thereafter, thus enabling evaluation of the dynamics of synovial enhancement (53).
After intravenous injection, gadolinium passes into the interstitial space at a rate dependent on local capillary permeability and tissue perfusion, which is increased during inflammation. SCE-MRI protocols assess the volume of enhancing synovitis at a fixed time point. Synovial volume can be quantified via manual or semi-automated segmentation of the synovial tissue. Static images can also be assessed using the validated semi-quantitative OMERACT-RAMRIS score (40).
Limitations of static contrast-enhanced imaging
Inflamed synovium enhances immediately, after which gadolinium-DTPA rapidly diffuses to the adjacent joint fluid (54). This can blur the margins of the synovium, leading to an overestimation of synovial volume. Early image acquisition following the administration of intravenous gadolinium may minimize this issue, however optimal timing for quantification of synovial volume remains to be established. The timing of the acquisition suggested in the literature vary widely; from few seconds post-injection (55) to within the initial 10 min (56). It has been suggested that waiting as long as 10 minutes can be problematic and therefore one should aim to image within 5 minutes.
Dynamic contrast-enhanced MRI
DCE-MRI involves the rapid acquisition of sequential images during and after administration of contrast and assesses the rate of enhancement of the synovial tissue. Results can be influenced by factors such as synovial perfusion and capillary permeability and more sensitively reflect local synovial inflammatory activity (57). Studies have shown that early enhancement reflecting the initial distribution of gadolinium, accurately reflects the inflammatory activity of the joint. The signal intensity of joint effusions also increases, starting in the periphery and subsequently gradually approaching the central parts, as gadolinium passes into the joint space by diffusion of fluid from synovial capillaries (53) (27). Thus, the extent of synovial enhancement may be misinterpreted, if the assessment is performed only on a static contrast enhanced-MRI acquired during a late phase.
DCE-MRI is a useful tool for assessing synovitis in RA and OA patients (53). Kirkhus et al. showed that DCE MRI proved useful in differentiating synovitis in hand OA from that in RA (58). Ostergaard et al. reported that the omission of intravenous gadolinium led to decreased reliability in the assessment of RA synovitis (59), therefore they recommend the use of gadolinium for comprehensive assessment of synovitis, especially when synovitis is the focus of interest as a surrogate outcome measure or as a predictor of subsequent clinical or structural changes. A study by Riis et al. investigated the association between pain and peripatellar-synovitis. Synovitis was assessed in the peripatellar recesses with (1) DCE-MRI, using both pharmacokinetic and heuristic analytical models, (2) SCE-MRI, and (3) non-contrast MRI, and correlated with pain assessed using the Knee Injury and Osteoarthritis Outcome Score (KOOS). The study reported statistically significant correlations between pain assessed using KOOS and all but one of the MRI variables. Overall, DCE-MRI showed a stronger correlation with pain compared to SCE-MRI (60).
Quantitative analysis using dynamic contrast-enhanced MRI
DCE-MRI can quantify both the amount of synovium and joint fluid in arthritic joints and provide objective information regarding the severity of inflammation. Rapid serial T1-weighted images at different time intervals following a contrast bolus, demonstrating an S-shaped curve of intensity against time is typical of inflamed synovium (61). The ‘E-ratio’ has been suggested as a measure of synovitis, derived by dividing the rate of increasing synovial enhancement post contrast injection by the baseline signal intensity of the synovial membrane. Significant correlation between the E-ratio and biopsy appearances of synovitis has been identified (61). Gaffney et al. re-assessed the calculations used to measure synovitis in 21 patients with knee synovitis, suggesting that the initial rate of synovial enhancement be used as an absolute measure rather than relative to a potentially highly variable baseline (62). The magnitude and rate of synovial enhancement on sequential MRI following bolus intravenous gadolinium injection have been demonstrated to correlate with the histological severity of synovial inflammation and also with disease activity clinical markers (63) (64). The proposed optimum time for measurement of enhancement is 30 seconds to 1 minute post Gadolinium-DTPA injection, as the maximum correlation coefficients to histological inflammation were identified in this period (63). Despite this, moderate and severe inflammation on histology cannot be differentiated with MRI (63).
Factors in dynamic contrast-enhanced MRI
For DCE to become commonplace in clinical practice, protocols need to be standardized and the image analysis needs to be fully automated. The optimal protocol for DCE-MRI is yet to be established. This would require addressing several variables including which part of the joint to image, what plane to use, how to manage the intrinsic heterogeneity of inflammation in the synovial compartment and which variable of enhancement to use (64). One study comparing a manual outline method and automated data analysis of DCE-MRI found the 2 methods to be comparable (65).
MRI assessment of synovial volume
MRI based volumetric measurement of enhancing tissue can be performed using both manual and computer-aided segmentation and processing techniques (66) (57). Studies have found the synovial volume to correlate with joint swelling and tenderness (67). Histopathological analysis has also shown a relationship between synovial membrane volumes and synovial inflammatory activity (66). Ostergaard et al. reported a decrease in contrast-enhanced MRI assessed synovial volume in the wrists of RA patients after therapy with disease-modifying antirheumatic drugs (DMARD) and prednisolone.
The prognostic value of pre-treatment synovial volumes is well documented; the rate of erosive progression is correlated with baseline synovial membrane volumes (64). Using a combined score for synovial thickening and synovial enhancement has been shown to be more predictive of bone erosions than only synovial enhancement score used alone (64). Even unenhanced synovial volumes analyzed in the finger, including active and inactive synovial tissue, effusion and fibrous tissue, have been found to be predictive of bone erosion on follow-up imaging after 1 year (67).
MRI assessment and Semi-quantitative scoring systems in OA
Neogi et al. assessed non-contrast knee MRI in over a thousand patients with OA. They found synovitis in 60% of this population and effusion in 66% (68). Contrast-enhanced MRI detected synovitis has been found to be strongly correlated with radiographic OA severity and reported in 74% of patients exhibiting all grades of OA severity (69), and in 95% of patients with predominantly moderate to severe radiographic OA (50). There is increasing evidence that synovitis may be independently associated with the progression of OA. Studies have shown that even after adjustment for other structural pathologies known to cause synovitis, synovitis remained associated with incident radiographic OA and demonstrated a graded association with radiographic progression (70,71). In another study of knees without MRI defined cartilage damage or radiographic OA, the presence of effusion or synovitis was associated with a significantly increased risk of cartilage loss (38).
Three well established semi-quantitative scoring systems for MRI assessment of knee OA all include evaluation of synovitis: the Whole-Organ Magnetic Resonance Imaging Score (WORMS) (72), Boston Leeds Osteoarthritis Knee Score (BLOKS) (73), and Knee Osteoarthritis Scoring System (KOSS) (74). In the relatively recently introduced MRI Osteoarthritis Knee Score (MOAKS), synovitis is also graded semi-quantitatively on a Likert-scale as follows: 0 = normal or physiological, 1 = mild or small, 2 = moderate or medium, and 3 = severe or large (6). A study by Rhodes et al. (57) demonstrated that semi-quantitative scoring of OA synovitis using contrast-enhanced T1-weighted imaging correlated well with manual volume assessments.
To better localize contrast-enhanced MRI detected knee synovitis, an alternative scoring system has been presented (75), whereby synovitis is graded from 0 to 2 at 11 different locations in the knee joint: medial and lateral parapatellar recess; suprapatellar, infrapatellar, intercondylar, medial and lateral perimeniscal regions; and adjacent to posterior and anterior cruciate ligaments, loose bodies, and Baker’s cysts. This scoring system was found to have good to excellent inter-reader and intra-reader reliability for assessment of whole-knee synovitis. In this study, moderate to severe synovitis showed a significant association with the maximum Western Ontario and McMaster Osteoarthritis Index (WOMAC) pain score when compared with knees with no or equivocal synovitis. Using this scoring method, the same investigators also reported that whole knee synovitis as semi-quantitatively assessed on contrast enhanced-MRI was strongly associated with tibiofemoral radiographic OA and severe meniscal damage (69,76).
MRI assessment and semi-quantitative scoring schemes in RA
Although the inciting pathological events in RA have been historically believed to reflect primarily synovitis leading to osteitis, cartilage wear, and ultimately osseous erosions, the process is likely more complex and incompletely understood. A significant relationship between synovitis and BME (77), as well as between synovitis and the development of erosions has been demonstrated (78). The precise contribution of synovitis in initiating and sustaining bone erosions, however, needs further study. Studies using MRI have identified BME and erosions as relatively early events, with cartilage loss occurring later (79) in the course of the disease. MRI studies have also demonstrated an association between BME, synovitis, baseline cartilage damage and subsequent cartilage loss (80). MRI can show changes of early synovitis, reactive osteitis and has the capacity to detect bone erosions up to two years earlier than radiographs (81). These findings are particularly significant, given the improved treatment algorithms for RA (1) (82). Additionally, they support the use of MRI as a robust outcome measure in clinical trials of future therapeutic agents.
Rheumatoid Arthritis MRI score (RAMRIS)
RAMRIS is a standardized MRI based semi-quantitative scoring system for RA, which is continually updated during the OMERACT methods development conferences (83). The scoring system focuses on the inflammatory soft tissue and destructive bone alteration and has been extensively utilized as an outcome measure, particularly in studies focusing on the hands and wrists. Using this scheme, synovial soft tissue thickening manifesting as an increased volume on the T1-weighted image and increased water content manifesting as high signal on fat-suppressed T2-weighted imaging is assessed in three wrist regions (distal radioulnar, radiocarpal, intercarpal joints) of the dominant or most inflamed wrist. For the hand, it is evaluated in 2nd through 5th metacarpophalangeal joints of the dominant or most inflamed side (84). A systemic review by Woodworth et al, which focused on published literature spanning 1970 through June 2014, found 1.5T MRI based RAMRIS detected synovitis, osteitis, and erosions to be valid and useful for evaluating joint inflammation and damage in RA involving the wrist and hand (84).
Some studies have suggested that signs of joint inflammation in the foot on MRI are as prevalent as in the hand and may even be present in the absence of inflammatory MRI findings of the hand. Sewerin et al. found that a combined hand and foot MRI score identified patients with continuing disease activity that would have been missed by consideration of the traditional RAMRIS alone (85).
MRI Based Monitoring of Treatment Response
Monitoring of treatment response has generally focused on assessment of synovial volume or quality as assessed by its vascularity.
Osteoarthritis
The efficacy of nonsteroidal anti-inflammatory drugs (NSAIDs) and intra-articular corticosteroid injections supports therapeutic targeting of the inflammatory process in OA. Using DCE-MRI in knee OA patients before and 1-2 weeks after intra-articular injection of 80 mg methylprednisolone, Gait et al. found DCE-MRI derived measures of synovial enhancement to be more sensitive to treatment response and more strongly associated with changes in pain than static assessment of synovial volume (86).
Rheumatoid Arthritis
The treatment goal in RA consists of DMARDs with or without concomitant corticosteroid therapy, with early initiation of therapy being vital to successful management. Methotrexate (MTX), is the standard therapy, but the remission rate for MTX treatment is <65%. The biological antirheumatic drugs are expensive and usually reserved for use if the conventional DMARDs are ineffective or contraindicated. These drugs targeting inflammatory cytokines, such as tumor necrosis factor α (TNF-α) or interleukin 6 (IL-6) via the IL-6 receptor (IL-6R), have expanded the treatment options for patients with RA. The combination of methotrexate and infliximab (an anti-TNF-α agent) for example has been found to be superior to methotrexate alone for reducing MRI-detected signs of synovitis and BME in patients with early RA (87).
A randomized clinical trial that used DCE-MRI to detect synovial enhancement at baseline and four months of treatment with leflunomide or methotrexate found a statistically significant difference between the two treatment groups using DCE-MRI, while clinical assessment failed to detect changes (88). The histological findings from synovial biopsies of the same joints however corresponded closely with the MRI findings and regions of interest used for dynamic contrast-enhanced MRI curve generation were matched to the biopsy sites at arthroscopy (89). Another open-label placebo-controlled study of intraarticular anti-CD4 (31) reported a significant correlation between MRI synovitis and microscopic synovitis with a trend toward improvement in both histological and MRI synovitis only in patients receiving active treatment. A different study investigated the effect of TNF inhibitor therapy on synovitis assessed via DEC-MRI and arthroscopic synovial biopsy (90). The authors reported a significant relationship between macroscopic synovitis/vascularity and MRI detected synovitis. They also reported an association between the decline in CD4+ T cells, CD68+ sublining macrophages and synovitis on MRI.
Advanced MRI techniques for monitoring drug treatment
T1rho mapping is an advanced research MRI technique that has been used to study collagen/proteoglycan matrix changes in articular cartilage (91). Ku and colleagues evaluated the feasibility of MR T1rho in assessing radiocarpal cartilage matrix changes following RA treatment with certolizumab, an anti-TNF biologic drug. They identified significant correlations between changes in radiocarpal T1rho and changes in disease activity as assessed by clinical and patient-reported outcomes. There is a large potential role for compositional techniques such as T1rho (Figure 4) and T2 mapping amongst others, in the assessment of RA disease activity and treatment response (91).
Figure 4 –
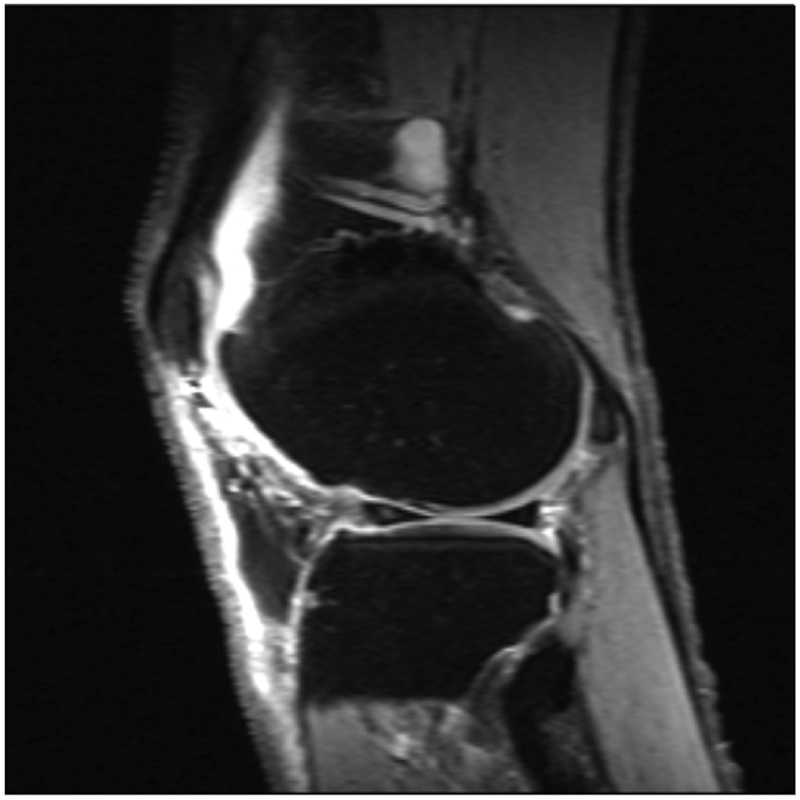
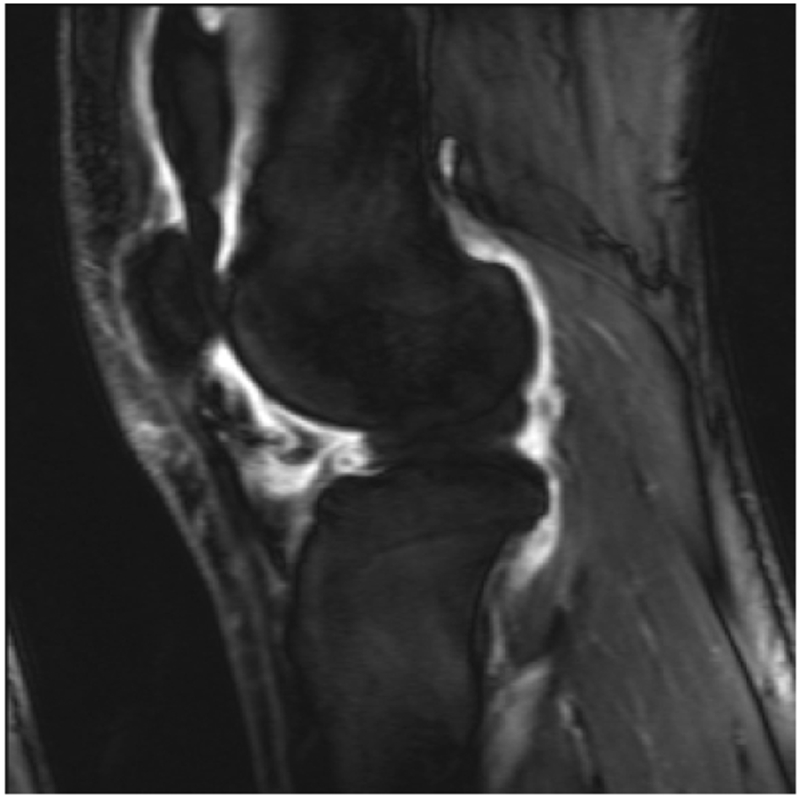
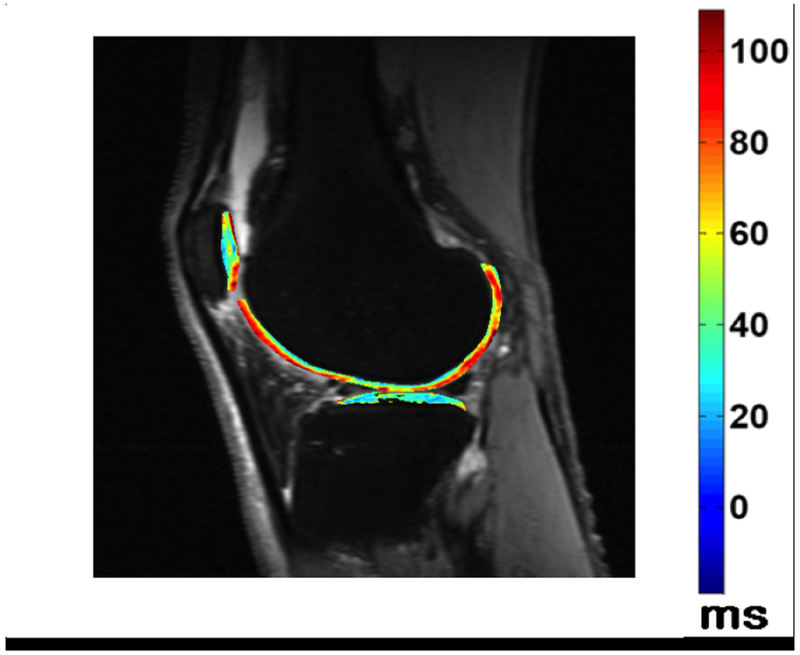
Fluid sensitive images in a patient with knee pain, demonstrating intraarticular increased signal intensity (a), which corresponds to increased synovial volume on contrast enhanced images (b). T1rho imaging with a color map of the cartilage in the lateral tibiofemoral compartment denoting areas of cartilage degradation.
Magnetic Field Strength In The Assessment Of Synovitis
The use of low field strength extremity MRI scanners has increasingly become commonplace amongst rheumatologists and other healthcare practitioners. Several studies have compared these low field strength MRI scanners with higher field strength magnets (92) (93). Ejbjerg et al. compared a 0.2T with a 1.0T MRI scanner and found the mean sensitivity, specificity, accuracy, and ICC of low-field MRI for detection of synovitis, where high-field MRI was considered the reference standard, to be 90%, 96%, 94%, and 0.923 (P < 0.05), respectively (93). It is noteworthy that Ejbjerg et al. found the overall sensitivity for detection of BME on the low-field scanner was only 39%, which may limit the usefulness of this type of scanner in RA since BME has been proposed to be a pathological event of major prognostic significance (67) (94). Lindegaard et al. demonstrated that low-field-strength extremity systems are superior to clinical examination for the detection of synovitis (95). Additional work is required to assess the reproducibility of results using low-field MRI units and inter-scanner reproducibility for DCE-MRI synovitis.
MRI Assessment of the Synovium in the Pediatric Population
There is particular interest in the utility of MRI in the assessment of juvenile idiopathic arthropathy (JIA) patients. Nusman et al. compared contrast-enhanced MRI detected synovitis in a group of clinically active JIA patients with a normal control group using the Juvenile Arthritis MRI Scoring system (JAMRIS) score. They found enhancing synovium (≥2 mm) to be present in 52 % of unaffected children and overall no difference between the 2 groups using the total JAMRIS score for synovitis. The authors concluded that mild synovial thickening is commonly present in children unaffected by JIA and that infrapatellar and cruciate ligament synovial involvement were more specific for JIA (96).
Hemke et al. attempted to define the contrast-enhanced MRI standards for the normal pediatric knee, using JAMRIS. The overall mean thickness of the normal synovial membrane was 0.4 mm (range, 0.0–1.8mm), with the synovium being most thick around the cruciate ligaments, and in the retropatellar and suprapatellar regions. The mean overall diameter of the largest pocket of joint fluid was 2.8 mm (min-max; 0.9–8.0mm). The investigators concluded that the JAMRIS cut-off value of 2 mm might be considered a valid measure for evaluating synovial hypertrophy (97).
MRI Assessment of Synovitis After Arthroplasty
MRI is increasingly being used in the clinical setting to investigate joint pain following arthroplasty. The presence of lamellated hyperintense synovitis on MRI of knee arthroplasty has a high sensitivity and specificity for infection (98). Diagnostic accuracy of MRI has been reported to differ between index and revision total knee arthroplasty (TKA). A study by Li et al., utilizing surgical pathology and microbiology as a reference, found that MRI could distinguish between particle-induced synovitis, infection, and nonspecific synovitis, with almost perfect reliability and diagnostic accuracy, which was higher for index TKA than for a revision TKA (99).
MRI Assessment Of Other Miscellaneous Synovial Diseases
Psoriatic arthritis (PA)
Psoriatic arthritis (PsA) is a chronic, systemic inflammatory disease, which is histologically characterized by less pronounced hyperplasia of the intimal lining layer, marked vascularity, and a synovial infiltrate composed of B cells, plasma cells, dendritic cells, CD 163+ macrophages, larger influx of neutrophils, and fewer synovial T cells compared to RA.
The OMERACT Psoriatic Arthritis MRI Score (PsAMRIS) has been developed as a tool for MRI assessment of hands and feet in PsA clinical trials. This scoring system has shown overall good intra-reader agreement in the hand and foot and has been found to be responsive to change over time (100). A recent study found that MRI of the feet may demonstrate subclinical inflammatory joint disease in psoriasis patients without clinically evident arthritis (101).
Gout
Gout is a crystalline arthropathy characterized by deposition of monosodium urate (MSU) crystals in soft tissues and joints due to hyperuricemia. The deposition of MSU crystals incite a synovial inflammatory process and arthropathy as well as causing a formation of gout tophi, which are foreign body granulomas that include macrophages and MSU crystals. Chronic arthropathy develops after several years of recurring acute arthritis attacks. Thus, chronic gout arthritis generally affects older patients. The first metatarsophalangeal joints and knees are the most frequently affected (Figure 5).
Figure 5.
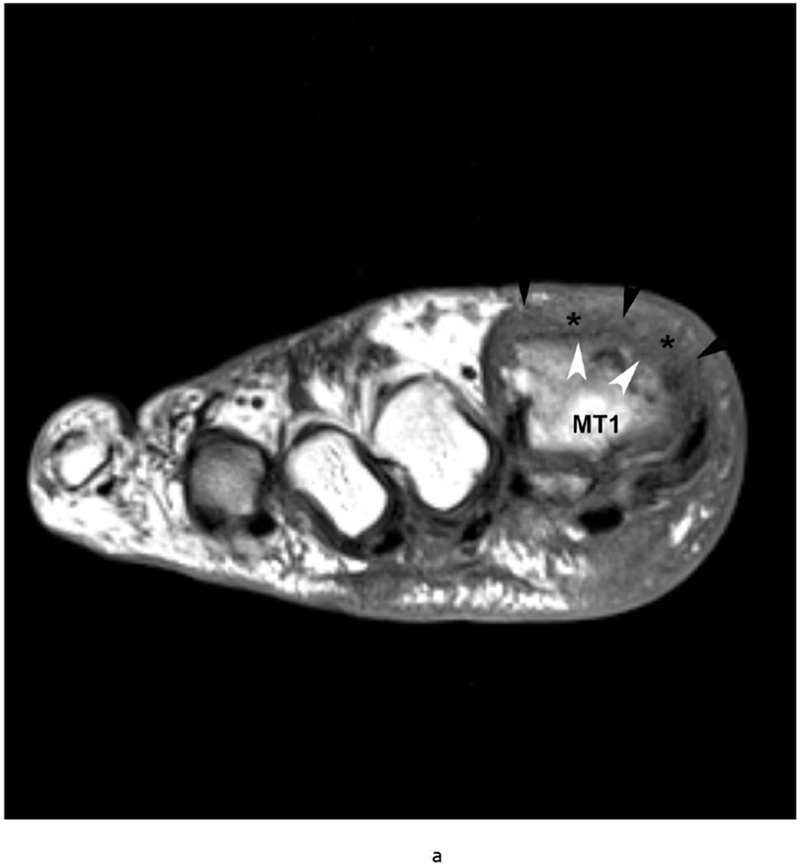
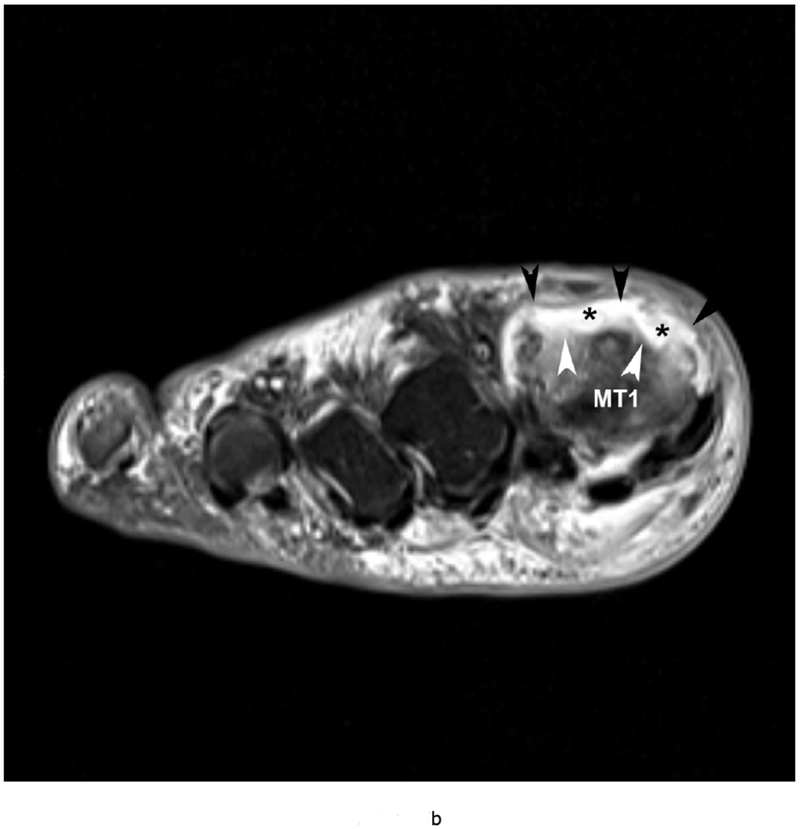
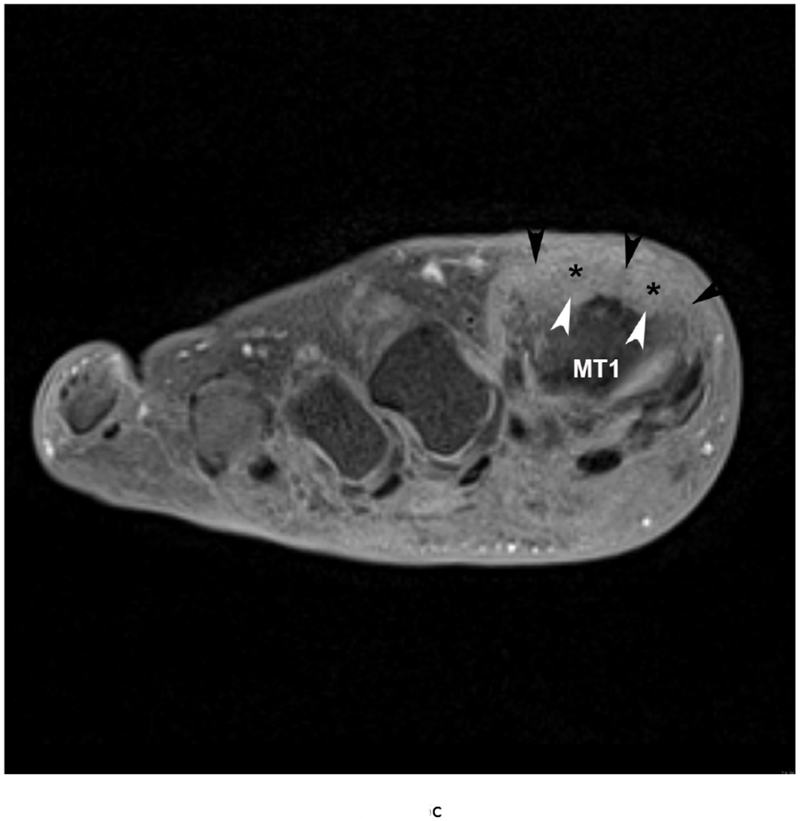
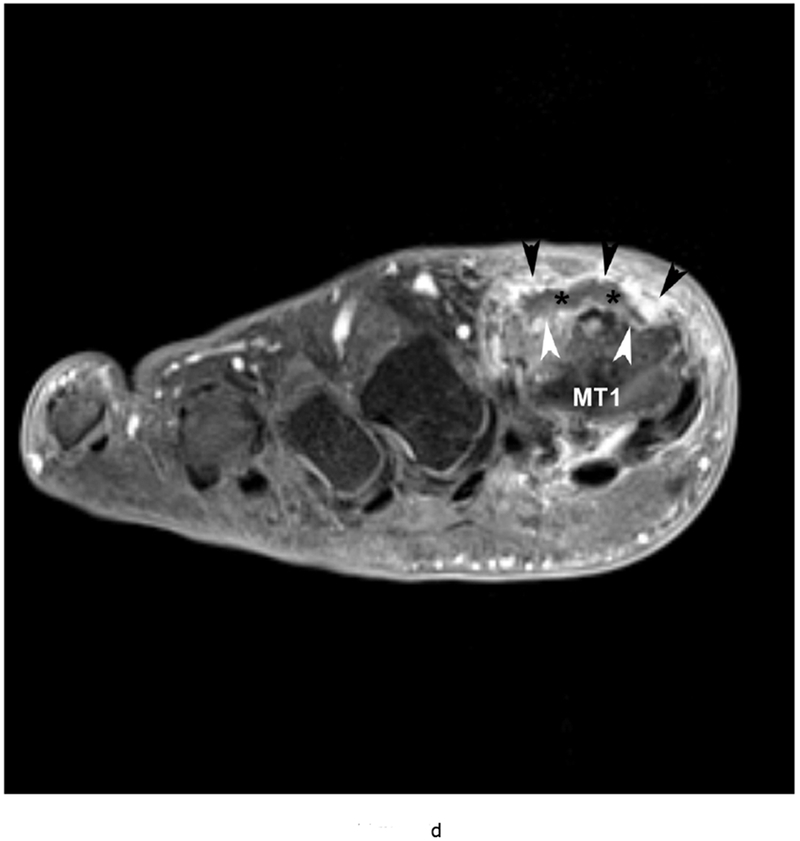
79 year old male with gout, confirmed by aspiration of monosodium urate (MSU) crystals. Short axis (a) T1 (TR 528 / TE 10) (b) T2 FS (TR 5610/TE 40), (c) T1 FS pre ( TR 612/TE 10) and (d) post Gadovist contrast images (TR 670/TE 12) demonstrating an effusion (*) in association with synovitis of the first metatarsophalangeal joint distending the joint capsule (black arrowheads). There are osseous erosions (white arrowheads) of the first metatarsal head (MT1) with subjacent bone marrow edema.
Pigmented villonodular synovitis (PVNS)
PVNS is a form of villonodular proliferation of the synovium with hemosiderin pigment deposition, which may develop in the bursa and tendon sheaths. The most common type of intraarticular PVNS is the diffuse form, but a localized form of PVNS may rarely be encountered. MRI reveals prominent diffuse villous or nodular proliferation of synovium and associated joint effusion. Synovial thickening is visualized as increased girth and intermediate to low signal intensity of the synovium on T1-weighted imaging. There are hypointense areas on T2-weighted imaging due to hemosiderin which also causes blooming artifacts on gradient echo sequences because of its magnetic susceptibility, almost pathognomonic in all forms of PVNS. These lesions also show enhancement after intravenous contrast administration.
Lipoma arborescens
Lipoma arborescens is a rare idiopathic disorder most frequently affecting the knee joint and characterized by villous lipomatous proliferation of the synovium. MRI exhibits synovial proliferation with frond-like fatty content, which has similar signal intensity to subcutaneous fat on all sequences and shows suppression on fat-saturated images.
MRI versus Ultrasound (US) in Assessment of Synovitis
Ultrasound has been recommended for diagnosing and monitoring disease activity in RA, evaluating subclinical synovitis and detecting disease progression (102). The presence of inflammation detected on US, as with MRI, can be used to predict the progression from undifferentiated inflammatory arthritis to clinical RA (103) (Figure 6). A recent systematic review which used MRI as a reference standard found US to be a valid and reproducible technique for assessment of synovitis in the wrist, metacarpophalangeal, proximal interphalangeal and knee joints (104). MRI does have several important advantages, however. It can visualize synovium located deep within the joint and is less susceptible to patient body habitus. Furthermore, MRI can detect additional BME lesions suggestive of osteitis, whereas US cannot. Volumetric measurements of synovium are also difficult with US.
Figure 6.
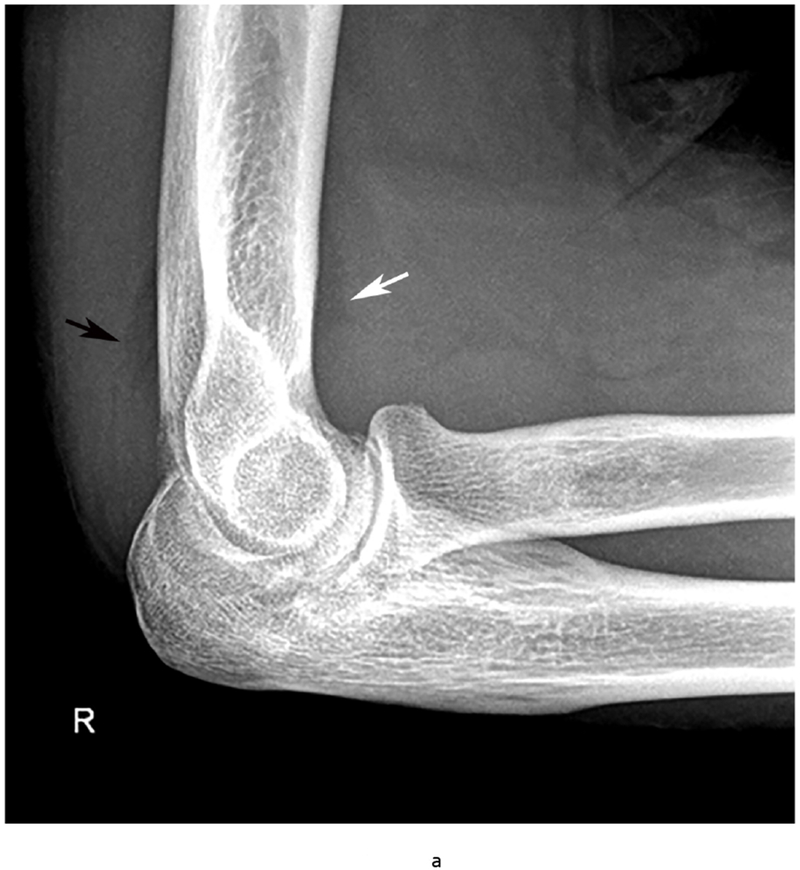
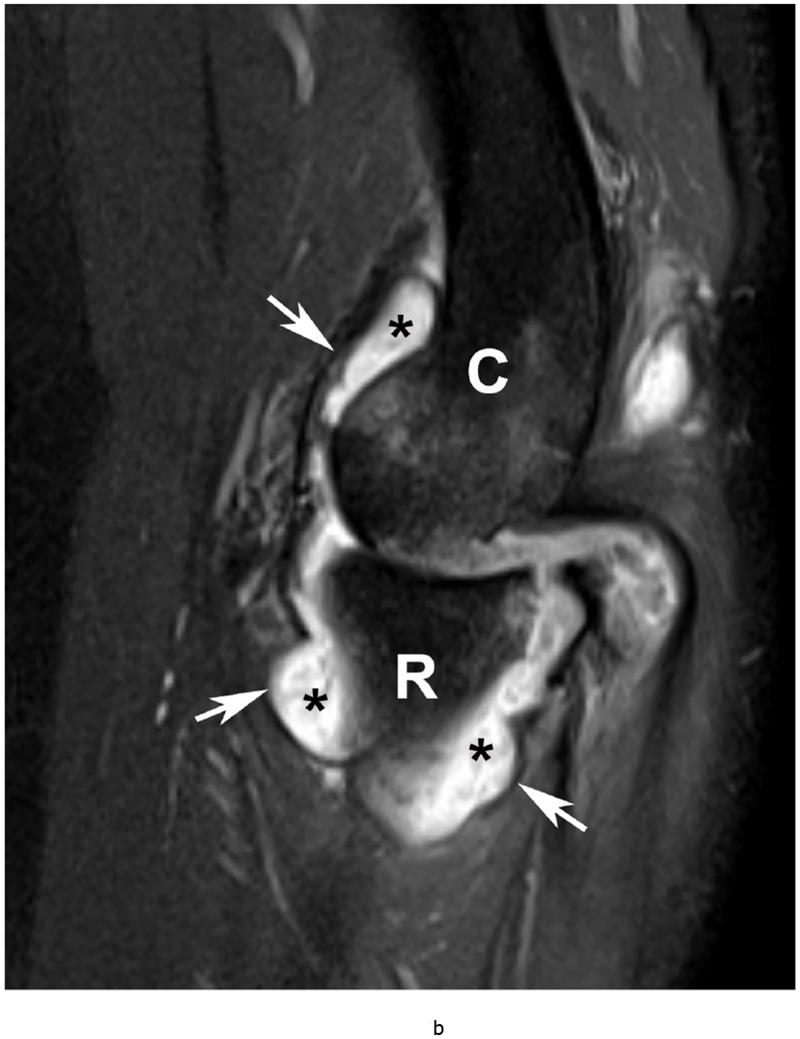
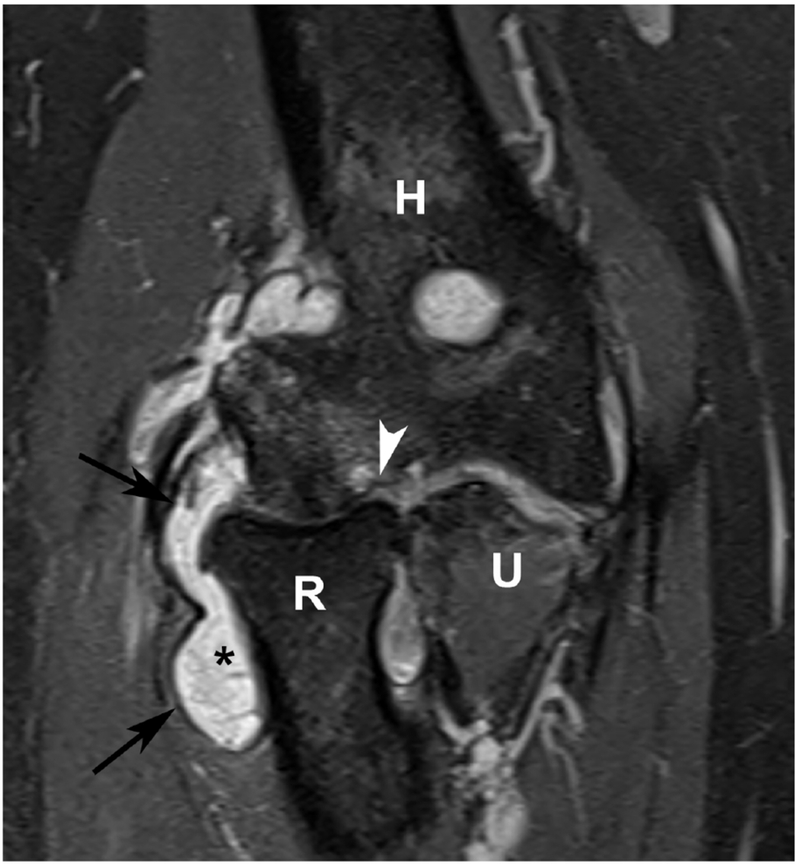
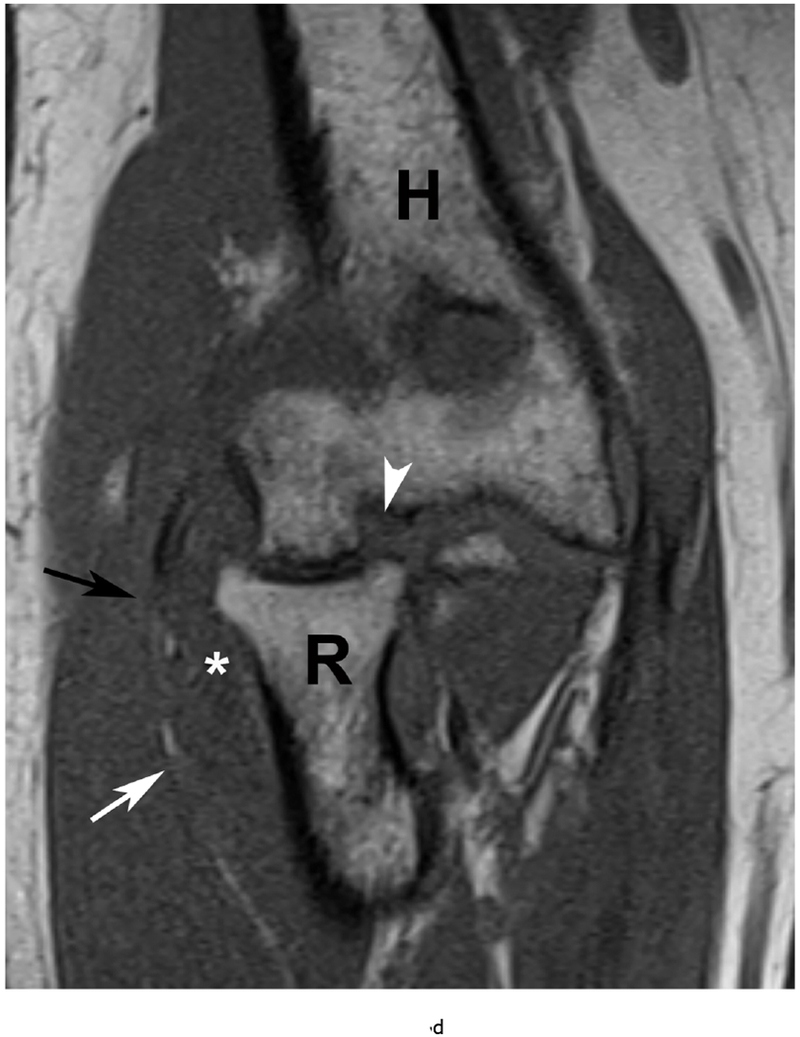
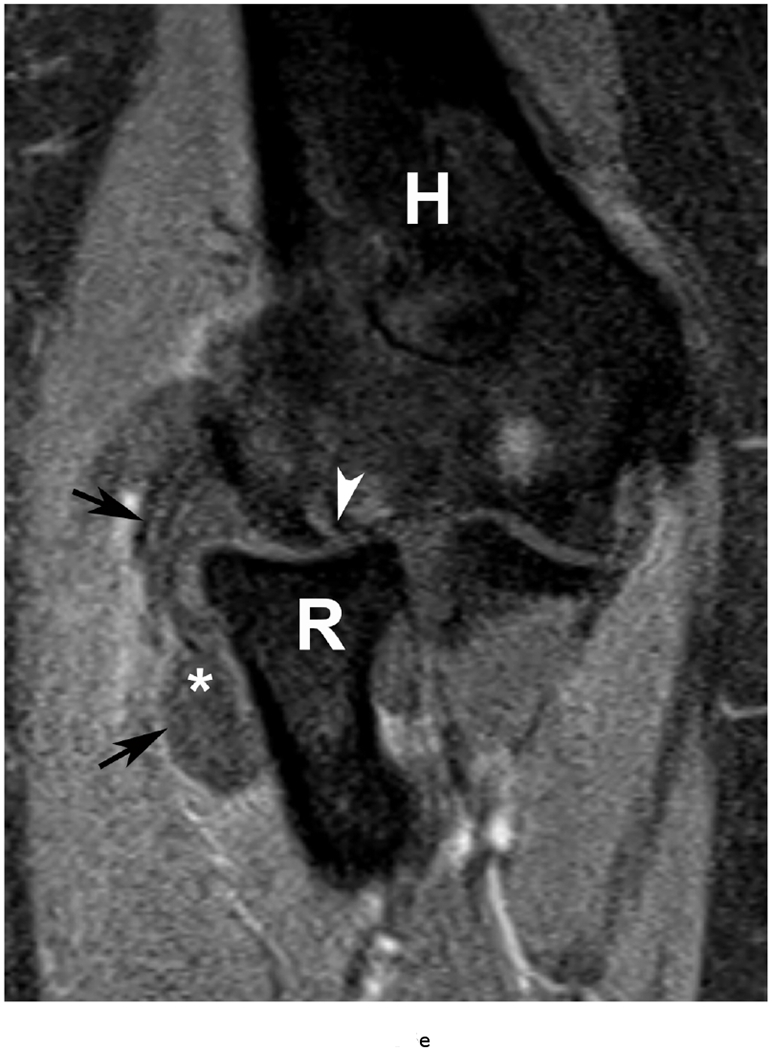
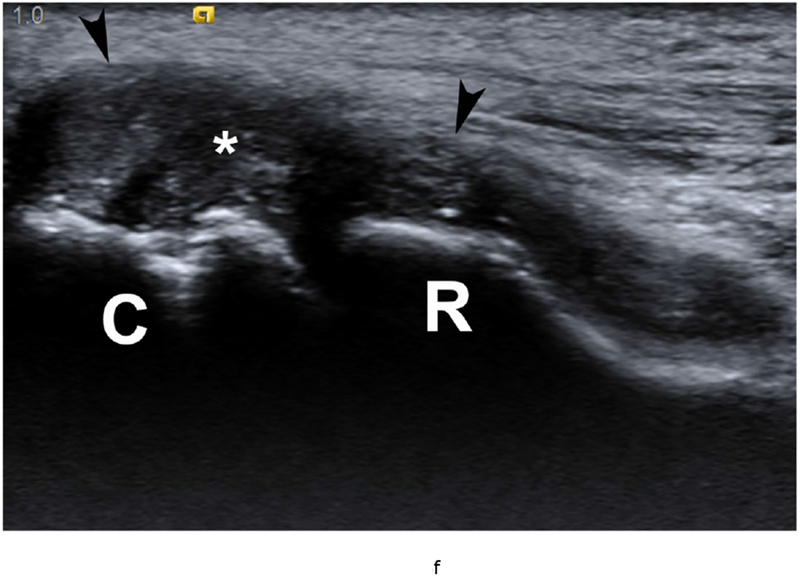
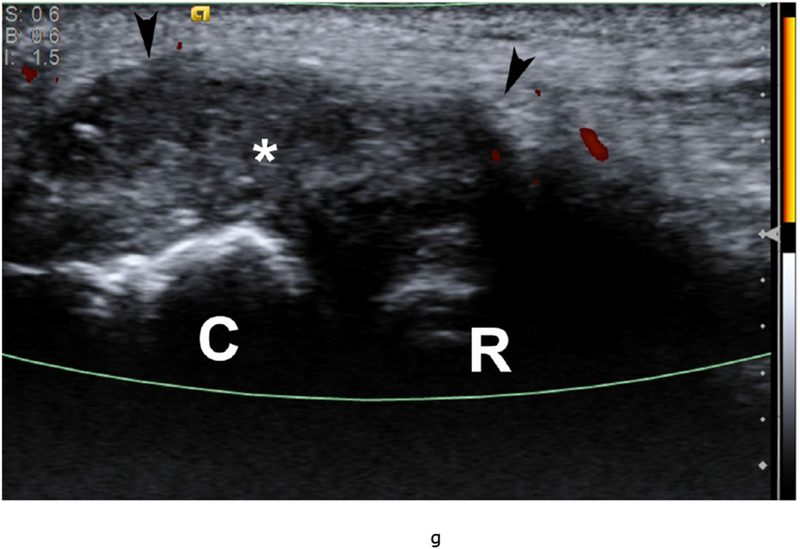
37 year old female with RA. (a) Lateral elbow radiograph demonstrating elevation of the anterior (white arrow) and posterior (black arrow) fat pads, considered a plain radiographic sign of an effusion however cannot differentiate between synovitis and effusion. (b) Sagittal T2 FS (TR 4400 / TE 50), coronal (c) T2 FS (TR 4210 / TE 33), (d) T1 (TR 645 / TE 8.9) and (e) T1 FS post contrast (TE 846 / TE 8.9) images demonstrating high T2 signal non-enhancing synovitis and pannus formation (*) diffusely expanding the joint capsule (black arrows). A small osseous erosion is seen involving the capitellum (white arrowheads) with subjacent bone marrow edema. Gray scale (f) and Power Doppler (g) ultrasound images in the same patient demonstrating non vascularized hypertrophied synovium (*) distending the joint capsule (black arrowheads) compatible with the absence of enhancement on MRI. C – Capitellum; R – Radial Head; H - Humerus.
Hybrid PET-MRI
Positron emission tomography (PET) provides quantitative information about molecular and physiologic changes that often precede structural and biochemical changes within the synovium. PET-MRI systems potentially represent a new complete integrated imaging tool for the diagnosis and assessment of synovial disease, in the form of both the high-resolution morphologic detail of the synovium and contrast enhancement patterns in conjunction with metabolic information. Higher FDG activity has been shown to correlate with intra-articular derangement, with the maximum standardized uptake value (SUVmax) significantly associated with cartilage loss, the degree of synovitis and meniscal tearing on MRI (105). MRI PET also allows localization of active synovitis for example within the intercondylar notch, which may represent the most metabolically active region of the knee (105) (Figure 7).
Figure 7.
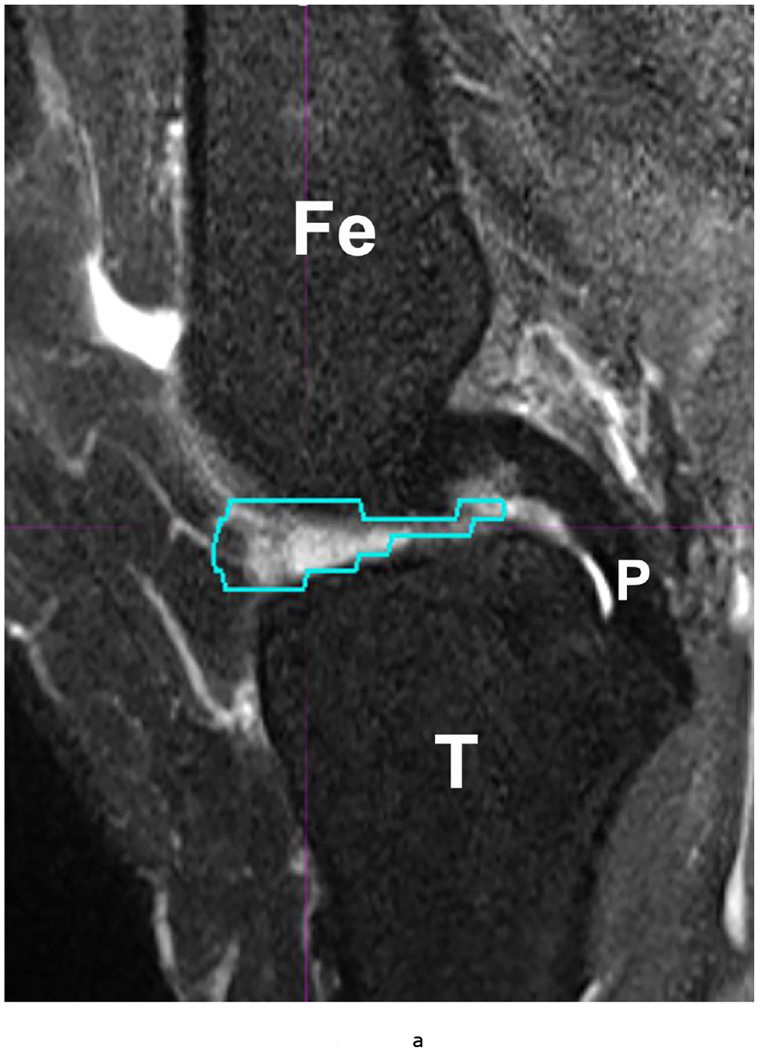
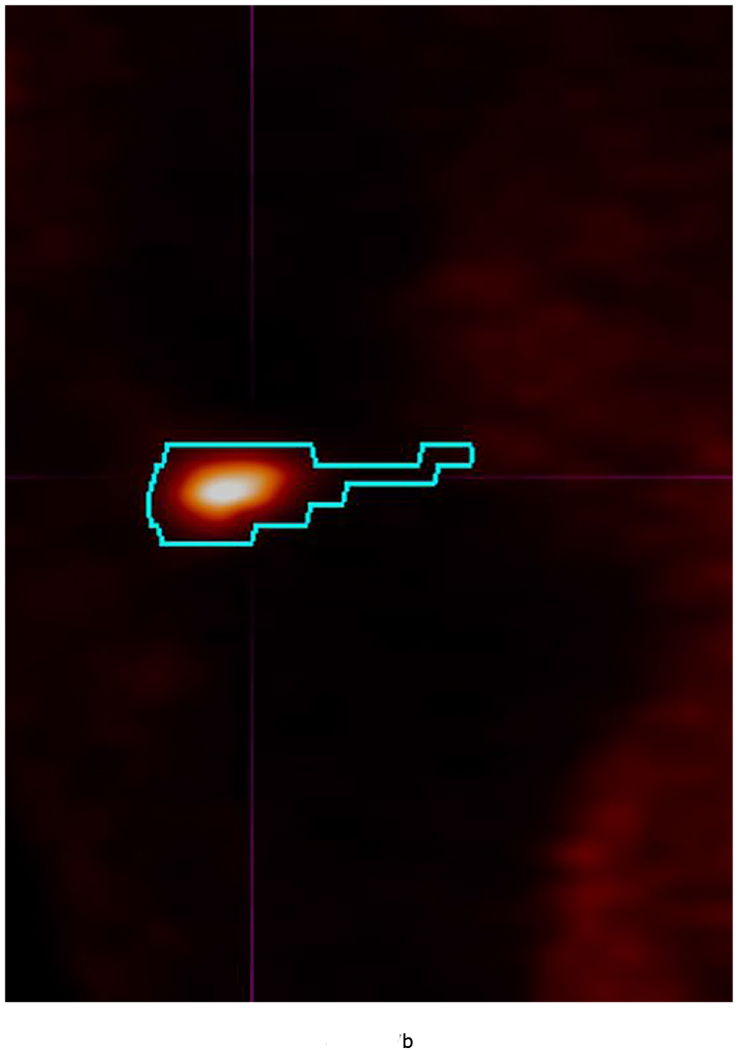
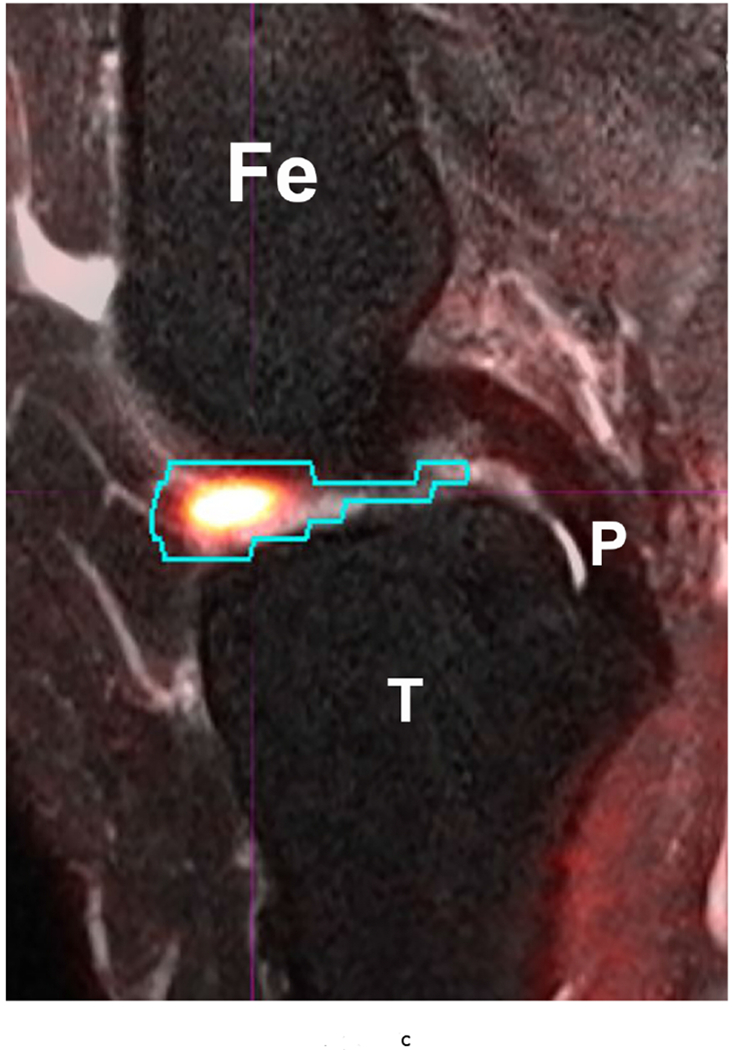
53 year-old female with knee pain and early OA. Sagittal (a) T2 FS (TR 5160/TE 56) (b) 18-FDG PET and (c) fused Hybrid MR PET images demonstrating 18-F FDG avidity corresponding to synovitis in the anterior intercondylar notch. The region of interest is demarcated in turquoise and the SUVMax measured as 10.97. Fe – Femur; T – Tibia; P – Posterior Cruciate Ligament.
Although technical considerations require further innovation and improvement for accurate and optimized PET-MRI protocols, there appears to be a scientific drive to resolve these limitations. However, in order to be incorporated into widespread routine practice, PET-MRI will need to demonstrate sufficient clinical benefit to justify the additional cost and complexity.
MRI Based Molecular Imaging using Contrast Agents
Molecular imaging of inflammation is a rapidly growing specialty with multiple potential applications. The range of molecular targets continues to expand and MRI-based molecular imaging will gain momentum with the advent of new magnetic nanoparticles that can be adapted for specific targets.
Accumulating magnetic nanoparticles cause shortening of the MRI T2 and T2* relaxation times of the surrounding tissues, which causes a signal reduction (negative contrast). Monocytes and macrophages have been targeted in the setting of inflammation using a variety of nanomaterials, such as the small paramagnetic iron oxide nanoparticles (SPIO) and ultra-small paramagnetic iron oxide nanoparticles (USPIO). Studies have shown that accumulation of USPIOs in experimental septic arthritis allows the identification of early synovitis and therapy monitoring (106).
Nuclear medicine techniques may also be fused with MR imaging to improve assessment of synovitis. Kraus and colleagues demonstrated direct in vivo evidence of activated macrophages in human OA. Through binding to folate receptor-β (FR-β), the new (99m) Tc-EC20 (Etarfolatide) imaging technique was found to detect activated, but not resting, macrophages in vivo. The quantity of knee-related macrophages was significantly associated with knee pain severity and radiographic knee OA severity including joint space narrowing and osteophytosis. Macrophages were also localized to joints commonly affected by OA including hand finger joints (12%), thumb bases (28%), shoulders (26%), great toes (18%) and ankles (12%). The presence of joint pain at fingers, wrists, ankles and great toes was significantly positively associated with the presence of activated macrophages at these sites. This study provided the first direct in vivo evidence for macrophage involvement in OA in a substantial proportion of human knees (Figure 8)(107). Fusion of these images with the morphological images obtained via MRI may increase sensitivity and specificity for active synovitis.
Figure 8.
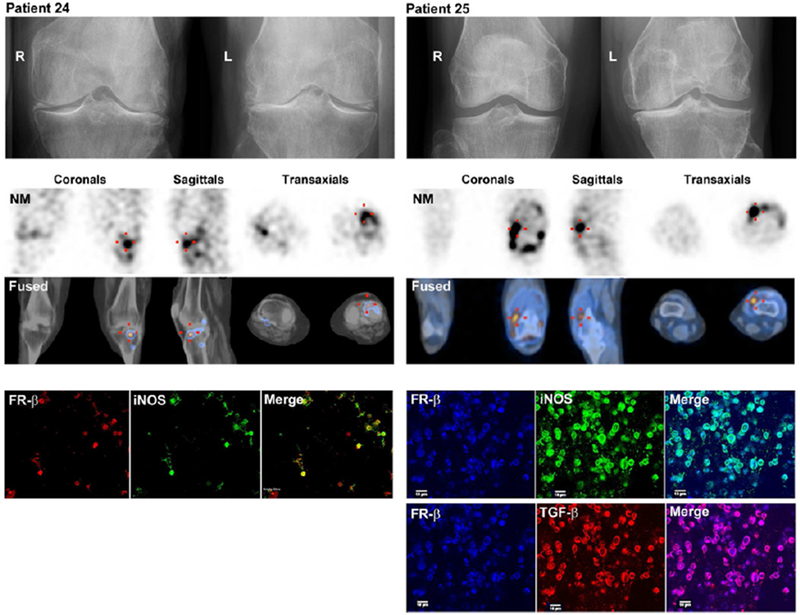
Representative images (top row) of Etarfolatide uptake in the: A) joint ‘capsule’ (showing capsular and/or underlying synovial uptake, indicated in coronal view by arrowhead); B) ‘synovium’ (showing uptake by proliferative synovium in the posterior synovial recess, indicated in coronal and sagittal views by arrow); C) ‘synovium’ and joint ‘capsule’ (indicated in sagittal view by arrow and arrowhead, respectively); and D) bone (indicated in coronal view by asterisk). Heat map graphic (bottom) representing the uptake intensity for each knee as quantified for three regions: joint ‘capsule’, ‘synovium’ and subchondral bone; the maximum score for each joint region was 6, 6 and 5, respectively. Reprinted from Kraus et al Osteoarthritis Cartilage 2016; 24 (9): 1613-1621, with permission.
Summary.
MRI provides an unparalleled non-invasive assessment of synovitis and may serve as a robust outcome measure in clinical trials of pharmaceutical therapies for the rheumatic diseases. With the advent of new therapies capable of preventing joint destruction, there is increased emphasis on MRI for early diagnostic and prognostic imaging as well as disease monitoring. Several semi-quantitative scores have been established for this purpose, which may have applications in the clinical settings. The continual advancement of MRI techniques and the advent of new hybrid-MRI imaging modalities such as PET-MRI hold promise in further improving the assessment of synovial disease.
Acknowledgments
Grant Support: Contract grant sponsor: National Institutes of Health (NIH); contract grant numbers: R01 AR067156; R01 AR068966;
References
- 1.McQueen FM, Stewart N, Crabbe J, et al. Magnetic resonance imaging of the wrist in early rheumatoid arthritis reveals a high prevalence of erosions at four months after symptom onset. Annals of the rheumatic diseases 1998;57(6):350–356. [DOI] [PMC free article] [PubMed] [Google Scholar]
- 2.Ostergaard M, Bird P, Gandjbakhch F, et al. The OMERACT MRI in Arthritis Working Group - Update on Status and Future Research Priorities. J Rheumatol 2015;42(12):2470–2472. [DOI] [PubMed] [Google Scholar]
- 3.Bird P, Conaghan P, Ejbjerg B, et al. The development of the EULAR-OMERACT rheumatoid arthritis MRI reference image atlas. Ann Rheum Dis 2005;64 Suppl 1:i8–10. [DOI] [PMC free article] [PubMed] [Google Scholar]
- 4.Mathiessen A, Conaghan PG. Synovitis in osteoarthritis: current understanding with therapeutic implications. Arthritis research & therapy 2017;19(1):18. [DOI] [PMC free article] [PubMed] [Google Scholar]
- 5.Smith MD. The normal synovium. The open rheumatology journal 2011;5:100–106. [DOI] [PMC free article] [PubMed] [Google Scholar]
- 6.Atukorala I, Kwoh CK, Guermazi A, et al. Synovitis in knee osteoarthritis: a precursor of disease? Annals of the rheumatic diseases 2016;75(2):390–395. [DOI] [PMC free article] [PubMed] [Google Scholar]
- 7.Roemer FW, Kwoh CK, Hannon MJ, et al. What comes first? Multitissue involvement leading to radiographic osteoarthritis: magnetic resonance imaging-based trajectory analysis over four years in the osteoarthritis initiative. Arthritis & rheumatology (Hoboken, NJ) 2015;67(8):2085–2096. [DOI] [PMC free article] [PubMed] [Google Scholar]
- 8.Houard X, Goldring MB, Berenbaum F. Homeostatic mechanisms in articular cartilage and role of inflammation in osteoarthritis. Current rheumatology reports 2013;15(11):375. [DOI] [PMC free article] [PubMed] [Google Scholar]
- 9.Siebuhr AS, Bay-Jensen AC, Jordan JM, et al. Inflammation (or synovitis)-driven osteoarthritis: an opportunity for personalizing prognosis and treatment? Scandinavian journal of rheumatology 2016;45(2):87–98. [DOI] [PubMed] [Google Scholar]
- 10.Ponchel F, Burska AN, Hensor EM, et al. Changes in peripheral blood immune cell composition in osteoarthritis. Osteoarthritis and cartilage 2015;23(11):1870–1878. [DOI] [PMC free article] [PubMed] [Google Scholar]
- 11.Prieto-Potin I, Largo R, Roman-Blas JA, Herrero-Beaumont G, Walsh DA. Characterization of multinucleated giant cells in synovium and subchondral bone in knee osteoarthritis and rheumatoid arthritis. BMC musculoskeletal disorders 2015;16:226. [DOI] [PMC free article] [PubMed] [Google Scholar]
- 12.Scanzello CR, Goldring SR. The role of synovitis in osteoarthritis pathogenesis. Bone 2012;51(2):249–257. [DOI] [PMC free article] [PubMed] [Google Scholar]
- 13.de Lange-Brokaar BJ, Ioan-Facsinay A, van Osch GJ, et al. Synovial inflammation, immune cells and their cytokines in osteoarthritis: a review. Osteoarthritis and cartilage 2012;20(12):1484–1499. [DOI] [PubMed] [Google Scholar]
- 14.Sokolove J, Lepus CM. Role of inflammation in the pathogenesis of osteoarthritis: latest findings and interpretations. Therapeutic advances in musculoskeletal disease 2013;5(2):77–94. [DOI] [PMC free article] [PubMed] [Google Scholar]
- 15.Goldring MB. Chondrogenesis, chondrocyte differentiation, and articular cartilage metabolism in health and osteoarthritis. Therapeutic advances in musculoskeletal disease 2012;4(4):269–285. [DOI] [PMC free article] [PubMed] [Google Scholar]
- 16.Berenbaum F Osteoarthritis as an inflammatory disease (osteoarthritis is not osteoarthrosis!). Osteoarthritis and cartilage 2013;21(1):16–21. [DOI] [PubMed] [Google Scholar]
- 17.Tehranzadeh J, Ashikyan O, Dascalos J. Magnetic resonance imaging in early detection of rheumatoid arthritis. Seminars in musculoskeletal radiology 2003;7(2):79–94. [DOI] [PubMed] [Google Scholar]
- 18.Di Franco M, Spadaro A, Mauceri MT, Cortese A, Guerrisi R, Ciocci A. Relationship of rheumatoid factor isotype levels with joint lesions detected by magnetic resonance imaging in early rheumatoid arthritis. Revue du rhumatisme (English ed) 1999;66(5):251–255. [PubMed] [Google Scholar]
- 19.Taylor PC. VEGF and imaging of vessels in rheumatoid arthritis. Arthritis research 2002;4 Suppl 3:S99–107. [DOI] [PMC free article] [PubMed] [Google Scholar]
- 20.Farrant JM, O’Connor PJ, Grainger AJ. Advanced imaging in rheumatoid arthritis. Part 1: synovitis. Skeletal radiology 2007;36(4):269–279. [DOI] [PubMed] [Google Scholar]
- 21.Huebner KD, Shrive NG, Frank CB. New surgical model of post-traumatic osteoarthritis: isolated intra-articular bone injury in the rabbit. Journal of orthopaedic research : official publication of the Orthopaedic Research Society 2013;31(6):914–920. [DOI] [PubMed] [Google Scholar]
- 22.Jackson MT, Moradi B, Zaki S, et al. Depletion of protease-activated receptor 2 but not protease-activated receptor 1 may confer protection against osteoarthritis in mice through extracartilaginous mechanisms. Arthritis & rheumatology (Hoboken, NJ) 2014;66(12):3337–3348. [DOI] [PubMed] [Google Scholar]
- 23.Lewis JS, Hembree WC, Furman BD, et al. Acute joint pathology and synovial inflammation is associated with increased intra-articular fracture severity in the mouse knee. Osteoarthritis and cartilage 2011;19(7):864–873. [DOI] [PMC free article] [PubMed] [Google Scholar]
- 24.Lieberthal J, Sambamurthy N, Scanzello CR. Inflammation in joint injury and post-traumatic osteoarthritis. Osteoarthritis and cartilage 2015;23(11):1825–1834. [DOI] [PMC free article] [PubMed] [Google Scholar]
- 25.Asquith DL, Miller AM, McInnes IB, Liew FY. Animal models of rheumatoid arthritis. European journal of immunology 2009;39(8):2040–2044. [DOI] [PubMed] [Google Scholar]
- 26.Watrin-Pinzano A, Loeuille D, Goebel JC, et al. Quantitative dynamic contrast enhanced MRI of experimental synovitis in the rabbit knee: comparison of macromolecular blood pool agents vs. Gadolinium-DOTA. Bio-medical materials and engineering 2008;18(4-5):261–272. [PubMed] [Google Scholar]
- 27.Ostergaard M, Stoltenberg M, Lovgreen-Nielsen P, Volck B, Jensen CH, Lorenzen I. Magnetic resonance imaging-determined synovial membrane and joint effusion volumes in rheumatoid arthritis and osteoarthritis: comparison with the macroscopic and microscopic appearance of the synovium. Arthritis and rheumatism 1997;40(10):1856–1867. [DOI] [PubMed] [Google Scholar]
- 28.Ostendorf B, Peters R, Dann P, et al. Magnetic resonance imaging and miniarthroscopy of metacarpophalangeal joints: Sensitive detection of morphologic changes in rheumatoid arthritis. Arthritis & Rheumatism 2001;44(11):2492–2502. [DOI] [PubMed] [Google Scholar]
- 29.Vordenbäumen S, Schleich C, Lögters T, et al. Dynamic contrast-enhanced magnetic resonance imaging of metacarpophalangeal joints reflects histological signs of synovitis in rheumatoid arthritis. Arthritis research & therapy 2014;16(5):452. [DOI] [PMC free article] [PubMed] [Google Scholar]
- 30.Takase K, Ohno S, Takeno M, et al. Simultaneous evaluation of long-lasting knee synovitis in patients undergoing arthroplasty by power Doppler ultrasonography and contrast-enhanced MRI in comparison with histopathology. Clinical and experimental rheumatology 2012;30(1):85–92. [PubMed] [Google Scholar]
- 31.Veale D, Reece R, Parsons W, et al. Intra-articular primatised anti-CD4: efficacy in resistant rheumatoid knees. A study of combined arthroscopy, magnetic resonance imaging, and histology. Annals of the rheumatic diseases 1999;58(6):342–349. [DOI] [PMC free article] [PubMed] [Google Scholar]
- 32.Bresnihan B, Pontifex E, Thurlings RM, et al. Synovial tissue sublining CD68 expression is a biomarker of therapeutic response in rheumatoid arthritis clinical trials: consistency across centers. The Journal of rheumatology 2009;36(8):1800–1802. [DOI] [PubMed] [Google Scholar]
- 33.Konig H, Sieper J, Wolf KJ. Rheumatoid arthritis: evaluation of hypervascular and fibrous pannus with dynamic MR imaging enhanced with Gd-DTPA. Radiology 1990;176(2):473–477. [DOI] [PubMed] [Google Scholar]
- 34.Gaffney K, Cookson J, Blades S, Coumbe A, Blake D. Quantitative assessment of the rheumatoid synovial microvascular bed by gadolinium-DTPA enhanced magnetic resonance imaging. Annals of the rheumatic diseases 1998;57(3):152–157. [DOI] [PMC free article] [PubMed] [Google Scholar]
- 35.Maijer KI, van der Leij C, de Hair MJ, et al. Dynamic Contrast-Enhanced Magnetic Resonance Imaging Using Pharmacokinetic Modeling: Initial Experience in Patients With Early Arthritis. Arthritis & rheumatology (Hoboken, NJ) 2016;68(3):587–596. [DOI] [PubMed] [Google Scholar]
- 36.Loeuille D, Sauliere N, Champigneulle J, Rat AC, Blum A, Chary-Valckenaere I. Comparing non-enhanced and enhanced sequences in the assessment of effusion and synovitis in knee OA: associations with clinical, macroscopic and microscopic features. Osteoarthritis and cartilage 2011;19(12):1433–1439. [DOI] [PubMed] [Google Scholar]
- 37.Roemer FW, Kassim Javaid M, Guermazi A, et al. Anatomical distribution of synovitis in knee osteoarthritis and its association with joint effusion assessed on non-enhanced and contrast-enhanced MRI. Osteoarthritis and cartilage 2010;18(10):1269–1274. [DOI] [PubMed] [Google Scholar]
- 38.Roemer FW, Guermazi A, Felson DT, et al. Presence of MRI-detected joint effusion and synovitis increases the risk of cartilage loss in knees without osteoarthritis at 30-month follow-up: the MOST study. Annals of the rheumatic diseases 2011;70(10):1804–1809. [DOI] [PMC free article] [PubMed] [Google Scholar]
- 39.Ostergaard M, Klarlund M, Lassere M, et al. Interreader agreement in the assessment of magnetic resonance images of rheumatoid arthritis wrist and finger joints--an international multicenter study. The Journal of rheumatology 2001;28(5):1143–1150. [PubMed] [Google Scholar]
- 40.Ostergaard M, Peterfy C, Conaghan P, et al. OMERACT Rheumatoid Arthritis Magnetic Resonance Imaging Studies. Core set of MRI acquisitions, joint pathology definitions, and the OMERACT RA-MRI scoring system. The Journal of rheumatology 2003;30(6):1385–1386. [PubMed] [Google Scholar]
- 41.McQueen F, Lassere M, Edmonds J, et al. OMERACT Rheumatoid Arthritis Magnetic Resonance Imaging Studies. Summary of OMERACT 6 MR Imaging Module. The Journal of rheumatology 2003;30(6):1387–1392. [PubMed] [Google Scholar]
- 42.Pelletier JP, Raynauld JP, Abram F, Haraoui B, Choquette D, Martel-Pelletier J. A new non-invasive method to assess synovitis severity in relation to symptoms and cartilage volume loss in knee osteoarthritis patients using MRI. Osteoarthritis and cartilage 2008;16 Suppl 3:S8–13. [DOI] [PubMed] [Google Scholar]
- 43.Roemer FW, Hunter DJ, Guermazi A. Semiquantitative assessment of synovitis in osteoarthritis on non contrast-enhanced MRI. Osteoarthritis and cartilage 2009;17(6):820–821; author reply 822–824. [DOI] [PubMed] [Google Scholar]
- 44.Hill CL, Hunter DJ, Niu J, et al. Synovitis detected on magnetic resonance imaging and its relation to pain and cartilage loss in knee osteoarthritis. Annals of the rheumatic diseases 2007;66(12):1599–1603. [DOI] [PMC free article] [PubMed] [Google Scholar]
- 45.Fernandez-Madrid F, Karvonen RL, Teitge RA, Miller PR, An T, Negendank WG. Synovial thickening detected by MR imaging in osteoarthritis of the knee confirmed by biopsy as synovitis. Magnetic resonance imaging 1995;13(2):177–183. [DOI] [PubMed] [Google Scholar]
- 46.Roemer FW, Guermazi A, Zhang Y, et al. Hoffa’s Fat Pad: Evaluation on Unenhanced MR Images as a Measure of Patellofemoral Synovitis in Osteoarthritis. AJR American journal of roentgenology 2009;192(6):1696–1700. [DOI] [PubMed] [Google Scholar]
- 47.Loeuille D, Rat AC, Goebel JC, et al. Magnetic resonance imaging in osteoarthritis: which method best reflects synovial membrane inflammation? Correlations with clinical, macroscopic and microscopic features. Osteoarthritis and cartilage 2009;17(9):1186–1192. [DOI] [PubMed] [Google Scholar]
- 48.Loeuille D, Chary-Valckenaere I, Champigneulle J, et al. Macroscopic and microscopic features of synovial membrane inflammation in the osteoarthritic knee: correlating magnetic resonance imaging findings with disease severity. Arthritis and rheumatism 2005;52(11):3492–3501. [DOI] [PubMed] [Google Scholar]
- 49.Song IH, Althoff CE, Hermann KG, et al. Knee osteoarthritis. Efficacy of a new method of contrast-enhanced musculoskeletal ultrasonography in detection of synovitis in patients with knee osteoarthritis in comparison with magnetic resonance imaging. Annals of the rheumatic diseases 2008;67(1):19–25. [DOI] [PubMed] [Google Scholar]
- 50.Baker K, Grainger A, Niu J, et al. Relation of synovitis to knee pain using contrast-enhanced MRIs. Annals of the rheumatic diseases 2010;69(10):1779–1783. [DOI] [PMC free article] [PubMed] [Google Scholar]
- 51.Guermazi A, Hayashi D, Roemer FW, et al. Synovitis in knee osteoarthritis assessed by contrast-enhanced magnetic resonance imaging (MRI) is associated with radiographic tibiofemoral osteoarthritis and MRI-detected widespread cartilage damage: the MOST study. The Journal of rheumatology 2014;41(3):501–508. [DOI] [PMC free article] [PubMed] [Google Scholar]
- 52.Liu L, Ishijima M, Futami I, et al. Correlation between synovitis detected on enhanced-magnetic resonance imaging and a histological analysis with a patient-oriented outcome measure for Japanese patients with end-stage knee osteoarthritis receiving joint replacement surgery. Clinical rheumatology 2010;29(10):1185–1190. [DOI] [PubMed] [Google Scholar]
- 53.Ostergaard M, Ejbjerg B. Magnetic resonance imaging of the synovium in rheumatoid arthritis. Seminars in musculoskeletal radiology 2004;8(4):287–299. [DOI] [PubMed] [Google Scholar]
- 54.Winalski CS, Aliabadi P, Wright RJ, Shortkroff S, Sledge CB, Weissman BN. Enhancement of joint fluid with intravenously administered gadopentetate dimeglumine: technique, rationale, and implications. Radiology 1993;187(1):179–185. [DOI] [PubMed] [Google Scholar]
- 55.Peterfy CG. Magnetic resonance imaging of rheumatoid arthritis: the evolution of clinical applications through clinical trials. Seminars in arthritis and rheumatism 2001;30(6):375–396. [DOI] [PubMed] [Google Scholar]
- 56.Ostergaard M, Klarlund M. Importance of timing of post-contrast MRI in rheumatoid arthritis: what happens during the first 60 minutes after IV gadolinium-DTPA? Annals of the rheumatic diseases 2001;60(11):1050–1054. [DOI] [PMC free article] [PubMed] [Google Scholar]
- 57.Rhodes LA, Grainger AJ, Keenan AM, Thomas C, Emery P, Conaghan PG. The validation of simple scoring methods for evaluating compartment-specific synovitis detected by MRI in knee osteoarthritis. Rheumatology (Oxford, England) 2005;44(12):1569–1573. [DOI] [PubMed] [Google Scholar]
- 58.Kirkhus E, Bjornerud A, Thoen J, Johnston V, Dale K, Smith HJ. Contrast-enhanced dynamic magnetic resonance imaging of finger joints in osteoarthritis and rheumatoid arthritis: an analysis based on pharmacokinetic modeling. Acta radiologica (Stockholm, Sweden : 1987) 2006;47(8):845–851. [DOI] [PubMed] [Google Scholar]
- 59.Ostergaard M, Conaghan PG, O’Connor P, et al. Reducing invasiveness, duration, and cost of magnetic resonance imaging in rheumatoid arthritis by omitting intravenous contrast injection -- Does it change the assessment of inflammatory and destructive joint changes by the OMERACT RAMRIS? The Journal of rheumatology 2009;36(8):1806–1810. [DOI] [PubMed] [Google Scholar]
- 60.Riis RG, Gudbergsen H, Henriksen M, et al. Synovitis assessed on static and dynamic contrast-enhanced magnetic resonance imaging and its association with pain in knee osteoarthritis: A cross-sectional study. European journal of radiology 2016;85(6):1099–1108. [DOI] [PubMed] [Google Scholar]
- 61.Tamai K, Yamato M, Yamaguchi T, Ohno W. Dynamic magnetic resonance imaging for the evaluation of synovitis in patients with rheumatoid arthritis. Arthritis and rheumatism 1994;37(8):1151–1157. [DOI] [PubMed] [Google Scholar]
- 62.Gaffney K, Cookson J, Blake D, Coumbe A, Blades S. Quantification of rheumatoid synovitis by magnetic resonance imaging. Arthritis and rheumatism 1995;38(11):1610–1617. [DOI] [PubMed] [Google Scholar]
- 63.Ostergaard M, Stoltenberg M, Lovgreen-Nielsen P, Volck B, Sonne-Holm S, Lorenzen I. Quantification of synovistis by MRI: correlation between dynamic and static gadolinium-enhanced magnetic resonance imaging and microscopic and macroscopic signs of synovial inflammation. Magnetic resonance imaging 1998;16(7):743–754. [DOI] [PubMed] [Google Scholar]
- 64.Huang J, Stewart N, Crabbe J, et al. A 1-year follow-up study of dynamic magnetic resonance imaging in early rheumatoid arthritis reveals synovitis to be increased in shared epitope-positive patients and predictive of erosions at 1 year. Rheumatology (Oxford, England) 2000;39(4):407–416. [DOI] [PubMed] [Google Scholar]
- 65.Klarlund M, Ostergaard M, Rostrup E, Skjodt H, Lorenzen I. Dynamic magnetic resonance imaging of the metacarpophalangeal joints in rheumatoid arthritis, early unclassified polyarthritis, and healthy controls. Scandinavian journal of rheumatology 2000;29(2):108–115. [DOI] [PubMed] [Google Scholar]
- 66.Ostergaard M, Hansen M, Stoltenberg M, et al. Magnetic resonance imaging-determined synovial membrane volume as a marker of disease activity and a predictor of progressive joint destruction in the wrists of patients with rheumatoid arthritis. Arthritis and rheumatism 1999;42(5):918–929. [DOI] [PubMed] [Google Scholar]
- 67.Savnik A, Malmskov H, Thomsen HS, et al. MRI of the wrist and finger joints in inflammatory joint diseases at 1-year interval: MRI features to predict bone erosions. European radiology 2002;12(5):1203–1210. [DOI] [PubMed] [Google Scholar]
- 68.Neogi T, Guermazi A, Roemer F, et al. Association of Joint Inflammation With Pain Sensitization in Knee Osteoarthritis: The Multicenter Osteoarthritis Study. Arthritis & rheumatology (Hoboken, NJ) 2016;68(3):654–661. [DOI] [PMC free article] [PubMed] [Google Scholar]
- 69.Guermazi A, Hayashi D, Roemer FW, et al. Synovitis in Knee Osteoarthritis Assessed by Contrast-enhanced Magnetic Resonance Imaging (MRI) is Associated with Radiographic Tibiofemoral Osteoarthritis and MRI-detected Widespread Cartilage Damage: The MOST Study. The Journal of rheumatology 2014;41(3):501–508. [DOI] [PMC free article] [PubMed] [Google Scholar]
- 70.Felson DT, Niu J, Neogi T, et al. Synovitis and the risk of knee osteoarthritis: the MOST Study. Osteoarthritis and cartilage 2016;24(3):458–464. [DOI] [PMC free article] [PubMed] [Google Scholar]
- 71.Damman W, Liu R, Bloem JL, Rosendaal FR, Reijnierse M, Kloppenburg M. Bone marrow lesions and synovitis on MRI associate with radiographic progression after 2 years in hand osteoarthritis. Annals of the rheumatic diseases 2017;76(1):214–217. [DOI] [PubMed] [Google Scholar]
- 72.Peterfy CG, Guermazi A, Zaim S, et al. Whole-Organ Magnetic Resonance Imaging Score (WORMS) of the knee in osteoarthritis. Osteoarthritis and cartilage 2004;12(3):177–190. [DOI] [PubMed] [Google Scholar]
- 73.Hunter DJ, Lo GH, Gale D, Grainger AJ, Guermazi A, Conaghan PG. The reliability of a new scoring system for knee osteoarthritis MRI and the validity of bone marrow lesion assessment: BLOKS (Boston Leeds Osteoarthritis Knee Score). Annals of the rheumatic diseases 2008;67(2):206–211. [DOI] [PubMed] [Google Scholar]
- 74.Kornaat PR, Ceulemans RY, Kroon HM, et al. MRI assessment of knee osteoarthritis: Knee Osteoarthritis Scoring System (KOSS)--inter-observer and intra-observer reproducibility of a compartment-based scoring system. Skeletal radiology 2005;34(2):95–102. [DOI] [PubMed] [Google Scholar]
- 75.Guermazi A, Burstein D, Conaghan P, et al. Imaging in osteoarthritis. Rheumatic diseases clinics of North America 2008;34(3):645–687. [DOI] [PubMed] [Google Scholar]
- 76.Guermazi A, Eckstein F, Hellio Le Graverand-Gastineau MP, et al. Osteoarthritis: current role of imaging. The Medical clinics of North America 2009;93(1):101–126, xi. [DOI] [PubMed] [Google Scholar]
- 77.Nieuwenhuis WP, van Steenbergen HW, Stomp W, et al. The Course of Bone Marrow Edema in Early Undifferentiated Arthritis and Rheumatoid Arthritis: A Longitudinal Magnetic Resonance Imaging Study at Bone Level. Arthritis & rheumatology (Hoboken, NJ) 2016;68(5):1080–1088. [DOI] [PubMed] [Google Scholar]
- 78.Conaghan PG, O’Connor P, McGonagle D, et al. Elucidation of the relationship between synovitis and bone damage: a randomized magnetic resonance imaging study of individual joints in patients with early rheumatoid arthritis. Arthritis and rheumatism 2003;48(1):64–71. [DOI] [PubMed] [Google Scholar]
- 79.McQueen F, Clarke A, McHaffie A, et al. Assessment of cartilage loss at the wrist in rheumatoid arthritis using a new MRI scoring system. Annals of the rheumatic diseases 2010;69(11):1971–1975. [DOI] [PubMed] [Google Scholar]
- 80.McQueen FM, McHaffie A, Clarke A, et al. MRI osteitis predicts cartilage damage at the wrist in RA: a three-year prospective 3T MRI study examining cartilage damage. Arthritis research & therapy 2014;16(1):R33–R33. [DOI] [PMC free article] [PubMed] [Google Scholar]
- 81.Ostergaard M, Hansen M, Stoltenberg M, et al. New radiographic bone erosions in the wrists of patients with rheumatoid arthritis are detectable with magnetic resonance imaging a median of two years earlier. Arthritis and rheumatism 2003;48(8):2128–2131. [DOI] [PubMed] [Google Scholar]
- 82.Sugimoto H, Takeda A, Hyodoh K. Early-stage rheumatoid arthritis: prospective study of the effectiveness of MR imaging for diagnosis. Radiology 2000;216(2):569–575. [DOI] [PubMed] [Google Scholar]
- 83.Freeston JE, Bird P, Conaghan PG. The role of MRI in rheumatoid arthritis: research and clinical issues. Current opinion in rheumatology 2009;21(2):95–101. [DOI] [PubMed] [Google Scholar]
- 84.Woodworth TG, Morgacheva O, Pimienta OL, Troum OM, Ranganath VK, Furst DE. Examining the validity of the rheumatoid arthritis magnetic resonance imaging score according to the OMERACT filter-a systematic literature review. Rheumatology (Oxford, England) 2017;56(7):1177–1188. [DOI] [PMC free article] [PubMed] [Google Scholar]
- 85.Sewerin P, Buchbender C, Vordenbaumen S, et al. Advantages of a combined rheumatoid arthritis magnetic resonance imaging score (RAMRIS) for hand and feet: does the RAMRIS of the hand alone underestimate disease activity and progression? BMC musculoskeletal disorders 2014;15:104. [DOI] [PMC free article] [PubMed] [Google Scholar]
- 86.Gait AD, Hodgson R, Parkes MJ, et al. Synovial volume vs synovial measurements from dynamic contrast enhanced MRI as measures of response in osteoarthritis. Osteoarthritis and cartilage 2016;24(8):1392–1398. [DOI] [PMC free article] [PubMed] [Google Scholar]
- 87.Durez P, Malghem J, Nzeusseu Toukap A, et al. Treatment of early rheumatoid arthritis: a randomized magnetic resonance imaging study comparing the effects of methotrexate alone, methotrexate in combination with infliximab, and methotrexate in combination with intravenous pulse methylprednisolone. Arthritis and rheumatism 2007;56(12):3919–3927. [DOI] [PubMed] [Google Scholar]
- 88.Reece RJ, Kraan MC, Radjenovic A, et al. Comparative assessment of leflunomide and methotrexate for the treatment of rheumatoid arthritis, by dynamic enhanced magnetic resonance imaging. Arthritis and rheumatism 2002;46(2):366–372. [DOI] [PubMed] [Google Scholar]
- 89.Kraan MC, Reece RJ, Barg EC, et al. Modulation of inflammation and metalloproteinase expression in synovial tissue by leflunomide and methotrexate in patients with active rheumatoid arthritis. Findings in a prospective, randomized, double-blind, parallel-design clinical trial in thirty-nine patients at two centers. Arthritis and rheumatism 2000;43(8):1820–1830. [DOI] [PubMed] [Google Scholar]
- 90.Kennedy A, Ng Chin T, Chang Ting C, et al. Tumor necrosis factor blocking therapy alters joint inflammation and hypoxia. Arthritis & Rheumatism 2011;63(4):923–932. [DOI] [PubMed] [Google Scholar]
- 91.Ku E, Pedoia V, Tanaka M, et al. Evaluating radiocarpal cartilage matrix changes 3-months after anti-TNF treatment for rheumatoid arthritis using MR T1ρ imaging. Journal of Magnetic Resonance Imaging 2016;45(5):1514–1522. [DOI] [PubMed] [Google Scholar]
- 92.Savnik A, Malmskov H, Thomsen HS, et al. MRI of the arthritic small joints: comparison of extremity MRI (0.2 T) vs high-field MRI (1.5 T). European radiology 2001;11(6):1030–1038. [DOI] [PubMed] [Google Scholar]
- 93.Ejbjerg BJ, Narvestad E, Jacobsen S, Thomsen HS, Ostergaard M. Optimised, low cost, low field dedicated extremity MRI is highly specific and sensitive for synovitis and bone erosions in rheumatoid arthritis wrist and finger joints: comparison with conventional high field MRI and radiography. Annals of the rheumatic diseases 2005;64(9):1280–1287. [DOI] [PMC free article] [PubMed] [Google Scholar]
- 94.McQueen FM, Benton N, Perry D, et al. Bone edema scored on magnetic resonance imaging scans of the dominant carpus at presentation predicts radiographic joint damage of the hands and feet six years later in patients with rheumatoid arthritis. Arthritis and rheumatism 2003;48(7):1814–1827. [DOI] [PubMed] [Google Scholar]
- 95.Lindegaard H, Vallo J, Horslev-Petersen K, Junker P, Ostergaard M. Low field dedicated magnetic resonance imaging in untreated rheumatoid arthritis of recent onset. Annals of the rheumatic diseases 2001;60(8):770–776. [DOI] [PMC free article] [PubMed] [Google Scholar]
- 96.Nusman CM, Hemke R, Benninga MA, et al. Contrast-enhanced MRI of the knee in children unaffected by clinical arthritis compared to clinically active juvenile idiopathic arthritis patients. European radiology 2016;26(4):1141–1148. [DOI] [PMC free article] [PubMed] [Google Scholar]
- 97.Hemke R, van den Berg JM, Nusman CM, et al. Contrast-enhanced MRI findings of the knee in healthy children; establishing normal values. European radiology 2018;28(3):1167–1174. [DOI] [PMC free article] [PubMed] [Google Scholar]
- 98.Plodkowski AJ, Hayter CL, Miller TT, Nguyen JT, Potter HG. Lamellated hyperintense synovitis: potential MR imaging sign of an infected knee arthroplasty. Radiology 2013;266(1):256–260. [DOI] [PubMed] [Google Scholar]
- 99.Li AE, Sneag DB, Greditzer HGt, Johnson CC, Miller TT, Potter HG. Total Knee Arthroplasty: Diagnostic Accuracy of Patterns of Synovitis at MR Imaging. Radiology 2016;281(2):499–506. [DOI] [PubMed] [Google Scholar]
- 100.Glinatsi D, Bird P, Gandjbakhch F, et al. Validation of the OMERACT Psoriatic Arthritis Magnetic Resonance Imaging Score (PsAMRIS) for the Hand and Foot in a Randomized Placebo-controlled Trial. The Journal of rheumatology 2015;42(12):2473–2479. [DOI] [PubMed] [Google Scholar]
- 101.Mathew AJ, Bird P, Gupta A, George R, Danda D. Magnetic resonance imaging (MRI) of feet demonstrates subclinical inflammatory joint disease in cutaneous psoriasis patients without clinical arthritis. Clinical rheumatology 2018;37(2):383–388. [DOI] [PubMed] [Google Scholar]
- 102.Yoshimi R, Hama M, Takase K, et al. Ultrasonography is a potent tool for the prediction of progressive joint destruction during clinical remission of rheumatoid arthritis. Modern rheumatology 2013;23(3):456–465. [DOI] [PubMed] [Google Scholar]
- 103.Machado PM, Koevoets R, Bombardier C, van der Heijde DM. The value of magnetic resonance imaging and ultrasound in undifferentiated arthritis: a systematic review. The Journal of rheumatology Supplement 2011;87:31–37. [DOI] [PubMed] [Google Scholar]
- 104.Takase-Minegishi K, Horita N, Kobayashi K, et al. Diagnostic test accuracy of ultrasound for synovitis in rheumatoid arthritis: systematic review and meta-analysis. Rheumatology (Oxford, England) 2018;57(1):49–58. [DOI] [PubMed] [Google Scholar]
- 105.Burke CJ, Walter WR, Gaddam S, et al. Correlation of benign incidental findings seen on whole-body PET-CT with knee MRI: patterns of (18)F-FDG avidity, intra-articular pathology, and bone marrow edema lesions. Skeletal radiology 2018. [DOI] [PubMed] [Google Scholar]
- 106.Bierry G, Lefevre S, Dietemann JL, Jehl F. In vivo macrophage imaging using MR targeted contrast agent for longitudinal evaluation of septic arthritis. Journal of visualized experiments : JoVE 2013(80):e50296. [DOI] [PMC free article] [PubMed] [Google Scholar]
- 107.Kraus VB, McDaniel G, Huebner JL, et al. Direct in vivo evidence of activated macrophages in human osteoarthritis. Osteoarthritis and cartilage 2016;24(9):1613–1621. [DOI] [PMC free article] [PubMed] [Google Scholar]


