

Abstract
The quantification of changes in gene copy number is critical to our understanding of tumor biology and for the clinical management of cancer patients. DNA fluorescence in situ hybridization is the gold standard method to detect copy number alterations, but it is limited by the number of genes one can quantify simultaneously. To increase the throughput of this informative technique, a fluorescent bar-code system for the unique labeling of dozens of genes and an automated image analysis algorithm that enabled their simultaneous hybridization for the quantification of gene copy numbers were devised. We demonstrate the reliability of this multiplex approach on normal human lymphocytes, metaphase spreads of transformed cell lines, and cultured circulating tumor cells. It also opens the door to the development of gene panels for more comprehensive analysis of copy number changes in tissue, including the study of heterogeneity and of high-throughput clinical assays that could provide rapid quantification of gene copy numbers in samples with limited cellularity, such as circulating tumor cells.
CME Accreditation Statement: This activity (“JMD 2019 CME Program in Molecular Diagnostics”) has been planned and implemented in accordance with the accreditation requirements and policies of the Accreditation Council for Continuing Medical Education (ACCME) through the joint providership of the American Society for Clinical Pathology (ASCP) and the American Society for Investigative Pathology (ASIP). ASCP is accredited by the ACCME to provide continuing medical education for physicians.
The ASCP designates this journal-based CME activity (“JMD 2019 CME Program in Molecular Diagnostics”) for a maximum of 18.0 AMA PRA Category 1 Credit(s)™. Physicians should claim only credit commensurate with the extent of their participation in the activity.
CME Disclosures: The authors of this article and the planning committee members and staff have no relevant financial relationships with commercial interests to disclose.
Fluorescence in situ hybridization (FISH) is the gold standard technique for the detection of gene copy number changes, including amplifications and deletions critical in the diagnosis and management of cancer. The utility of FISH has been limited by the number of genes that can be evaluated at a time, and its use has diminished in the era of genome-wide approaches, such as array comparative genomic hybridization (aCGH) and next-generation sequencing (NGS). Nonetheless, it is still extremely powerful as it allows absolute copy number quantification at the single-cell level in the context of tumor section architecture. In the era of precision cancer medicine, efficient genotyping screens are now considered critical. To enhance the utility of FISH in the genomic era, we sought to increase its multiplicity, so one could more rapidly determine copy number alterations among genes believed to play a role in oncogenesis.
The simultaneous use of different color combinations in FISH has been previously used with chromosome paint probes used in spectral karyotyping1 or multicolor FISH2, 3, 4 for the analysis of numerical and structural abnormalities of whole human chromosomes. Such techniques are only applicable to metaphase preparations, and so they have a limited role for the analysis of interphase nuclei and fixed tissues. The feasibility of similar combinatorial labeling approaches for gene locus–specific regions has been previously explored, but the recent advances in fluorescence digital imaging, data processing technologies, and more stable fluorophores have improved the ability to simultaneously examine multiple genes.5 Single-cell NGS is another powerful approach, but the accuracy of copy number calling is still in its early stages,6, 7 and the cost is prohibitive for routine use in the clinic.
Highly multiplexed gene FISH probes could have important research and clinical applications. We believe the study of genetic heterogeneity in cancerous cells could be greatly enhanced by the availability of a reliable multiplex FISH assay. Earlier work in human glioblastoma (GBM) showed a remarkable degree of copy number heterogeneity, in which tumors with intermingled tumor cell populations containing high-level amplifications of EGFR, MET, or PDGFRA were observed in different cells using three-color FISH.8 There might be additional examples of such copy number mosaicism in GBM; more than three genes in each hybridization procedure can be interrogated. More important, mosaicism was only detected by FISH, as aCGH and NGS did not have the sensitivity to detect minor amplified subpopulations.8 Clinically, this heterogeneity may, in part, explain the numerous failures of clinical trials of targeted therapies against kinases in GBM.9, 10, 11, 12 A multiplex FISH assay can be expected to have direct clinical applicability in simultaneously assaying many actionable copy number changes in tumor samples. The approach may be especially powerful when samples have a limited number of cells, such as isolated circulating tumor cells (CTCs). In these settings, multiplex FISH would be faster and less expensive than other options, such as NGS.
Herein, we report the development of a multiplex, locus-specific FISH method using combinatorial labeling of up to 15 genes with two or three fluorophores each. Hybridized cells were imaged with a laser-scanning confocal microscope, and the spectral signature of each fluorophore was identified by linear unmixing. A custom-automated image analysis pipeline, allowing rapid and accurate gene quantification, was developed. The approach was validated by measuring the gene copy number of normal lymphocytes, cultured tumor cell lines, and CTCs; and comparing with known copy numbers obtained via traditional methods. This approach may have numerous research applications, and it may be effectively deployed in the clinic as an adjunct to NGS.
Materials and Methods
Cells and Cell Preparation
Established tumor cell lines were obtained from ATCC (Manassas, VA) (H1975, MCF10A, PC3, H460, UACC62, HCC1954, 293T, LM2, Sk-Mel, BL209, BUML, and LNCaP) and by collaboration with Dr. Hiroaki Wakimoto (Department of Neurosurgery, Massachusetts General Hospital, Boston, MA) (GBM18 and GBM29)13; and they were grown according to standard protocols specified for each cell line. Patient-derived CTC lines (BRX-07, BRX-42, BRX-50, BRX-61, BRX-68, BRX-82, and BRX-142) were previously described.14 Normal lymphocytes were obtained from blood draws from five healthy donors (three males and two females). The cells used in this study are listed in Table 1.
Table 1.
List of Cell Lines Used in This Study Encompassing a Variety of Human Cancers
| Cell line | Tissue | Source |
|---|---|---|
| H1975 | Lung | ATCC (Manassas, VA) |
| MCF10A | Breast | ATCC |
| PC3 | Prostate | ATCC |
| H460 | Lung | ATCC |
| UACC62 | Skin | ATCC |
| HCC1954 | Breast | ATCC |
| 293T | Embryonic kidney | ATCC |
| LM2 | Breast | ATCC |
| SKMEL | Skin | ATCC |
| BL209 | Peripheral blood (B lymphoblast) | ATCC |
| BUML | Skin | ATCC |
| GBM18 | Brain | Department of Neurosurgery, MGH (Boston, MA) |
| GBM29 | Brain | Department of Neurosurgery, MGH |
| LNCAP | Prostate | ATCC |
| BRX-07 | CTC-breast | Cancer Center, MGH |
| BRX-42 | CTC-breast | Cancer Center, MGH |
| BRX-50 | CTC-breast | Cancer Center, MGH |
| BRX-61 | CTC-breast | Cancer Center, MGH |
| BRX-68 | CTC-breast | Cancer Center, MGH |
| BRX-82 | CTC-breast | Cancer Center, MGH |
| BRX-142 | CTC-breast | Cancer Center, MGH |
CTC, circulating tumor cell; MGH, Massachusetts General Hospital.
Cell Suspension
Cell suspensions were fixed and processed for FISH, following the method described by Ronne et al,15 with minor changes. Grown cells were dissociated either mechanically or by trypsin treatment, washed with phosphate-buffered saline, and treated with a hypotonic solution of 0.075 mol/L potassium chloride to promote osmotic swelling for 20 to 40 minutes at 37°C, followed by three fixative washes with methanol/acetic acid solution (3:1). Interphase cell suspensions were kept in −20°C until use. Cell suspension slides were prepared by dropping the cell suspension on a clean, uncoated slide, heated at 65°C for 3 minutes.
Lymphocyte spreads were further processed by preheating with 2× saline sodium citrate (SSC) with 0.25% Triton X-100 (Sigma-Aldrich, St. Louis, MO) until boiling. Slides were then immersed for 2 minutes, followed by rinsing in 2× SSC at room temperature; dehydrated in 95% ethanol, followed by three changes of 100% ethanol; air dried; and heated at 65°C for 3 minutes.
Multiplex FISH Analysis
The multiplex FISH assay consists of three principal steps: i) probe construction and hybridization, ii) image acquisition, and iii) automated image analysis.
Probe Construction and Hybridization
BAC Probes
FISH probes were derived from 40 locus-specific DNA sequences from bacterial artificial chromosome (BAC) clones. Their specificity was checked in metaphase spreads. BAC clone searches were performed using the University of California, Santa Cruz, Genome Browser (http://genome.ucsc.edu, last accessed June 2018) mapped to February 2009 (GRCh37/hg19) and December 2013 (GRCh38/hg38) Human Genome Assemblies. BACs were purchased from the Children's Hospital Oakland Research Institute (Oakland, CA). BAC clones included in this study are specified in Table 2.
Table 2.
List of BAC Clones Used in This Study
| Gene | BAC clones | Chromosomal band | Position | Length, bp |
|---|---|---|---|---|
| MDM4 | RP11-681D2 | 1q32.1 | Chr1: 204287357-204490377 | 203,021 |
| MDM4 | RP11-433N15 | 1q32.1 | Chr1: 204488529-204685959 | 197,431 |
| MDM4 | RP11-1083G20 | 1q32.1 | Chr1: 204669361-204836114 | 166,754 |
| nMYC | RP11-348M12 | 2p24.3 | Chr2: 15694022-15891362 | 197,341 |
| nMYC | RP11-68A23 | 2p24.3 | Chr2: 15800370-15954586 | 154,215 |
| nMYC | RP11-480N14 | 2p24.3 | Chr2: 15900428-16068176 | 167,749 |
| VHL | RP11-412A7 | 3p25.3 | Chr3: 10051200-10210999 | 159,799 |
| FGFR3 | RP11-585J22 | 4p16.3 | Chr4: 1540716-1729475 | 188,760 |
| FGFR3 | RP11-42F9 | 4p16.3 | Chr4: 1652635-1814151 | 161,517 |
| FGFR3 | RP11-709N10 | 4p16.3 | Chr4: 1914710-2092430 | 177,721 |
| PDGFRA | RP11-367L1 | 4q12 | Chr4: 53944497-54123661 | 179,165 |
| PDGFRA | RP11-1150L6 | 4q12 | Chr4: 54270489-54435017 | 164,529 |
| PDGFRA | RP11-819d11 | 4q12 | Chr4: 54996277-55189141 | 192,865 |
| APC | RP11-141I11 | 5q22.2 | Chr5: 112685539-112863059 | 177,521 |
| ROS1 | RP11-621B8 | 6q22.1 | Chr6: 117225375-117393195 | 167,821 |
| EGFR | RP11-23F4 | 7p11.2 | Chr7: 54844843-55014552 | 169,710 |
| EGFR | RP11-815K24 | 7p11.2 | Chr7: 55014550-55210975 | 196,426 |
| EGFR | RP11-1055P9 | 7p11.2 | Chr7: 55142508-55355546 | 213,039 |
| MET | RP11-994L8 | 7q31.2 | Chr7: 116416808-116628125 | 211,318 |
| MET | RP11-114O6 | 7q31.2 | Chr7: 116599129-116785513 | 186,385 |
| MET | RP11-1018C18 | 7q31.2 | Chr7: 116683912-116868259 | 184,348 |
| BRAF | RP11-1065D4 | 7q34 | Chr7: 140726319-140903706 | 177,388 |
| MYC | RP11-1136L8 | 8q24.21 | Chr8: 127543567-127702694 | 159,128 |
| MYC | CTD-3066D1 | 8q24.21 | Chr8: 127622027-127789248 | 167,222 |
| MYC | RP11-125A17 | 8q24.21 | Chr8: 127853175-128024415 | 171,241 |
| CDKN2A/2B | RP11-55A19 | 9p21.3 | Chr9: 21811736-21981390 | 169,655 |
| CDKN2A/2B | RP11-478M20 | 9p21.3 | Chr9: 21947306-22110181 | 162,876 |
| CDKN2A/2B | RP11-134B17 | 9p21.3 | Chr9: 22110304-22262751 | 152,448 |
| RET | RP11-351D16 | 10q11.21 | Chr10: 43001743-43207538 | 205,795 |
| CCND1 | RP11-156B3 | 11q13.3 | Chr11: 69582754-69773689 | 190,936 |
| KRAS | RP11-295I5 | 12p12.1 | Chr12: 25077532-25273591 | 196,060 |
| CDK4 | RP11-571M6 | 12q13.3-12q14.1 | Chr12: 57606087-57817625 | 211,538 |
| TP53 | RP11-89D11 | 17p13.1 | Chr17: 7592397-7759725 | 167,329 |
| TP53 | RP11-107F4 | 17p13.1 | Chr17: 7723778-7882647 | 158,870 |
| ERBB2 | RP11-94L15 | 17q12-17q21.1 | Chr17: 39655584-39817309 | 161,726 |
| ERBB2 | RP11-1044P23 | 17q12-17q21.1 | Chr17: 39715531-39910359 | 194,829 |
| ERBB2 | RP11-661A13 | 17q21.1 | Chr17: 39878297-40048779 | 170,483 |
| SMAD4 | RP11-729G3 | 18q21.2 | Chr18: 50951919-51108118 | 156,200 |
| CCNE1 | RP11-345J21 | 19q12 | Chr19: 29644930-29841126 | 196,197 |
| AR | RP11-479J1 | Xq12 | ChrX: 67557245-67723235 | 165,991 |
List of BAC clones used in this study with respective identified gene, chromosomal band position, sequence position, and length (http://genome.ucsc.edu). All clones were purchased from Children's Hospital Oakland Research Institute (CHORI; Oakland, CA).
BAC, bacterial artificial chromosome; Chr, chromosome.
Escherichia coli, transformed with individual BAC clones, were cultured using Luria-Bertani media (Sigma-Aldrich) containing 12.5 μg/mL chloramphenicol (Teknova, Hollister, CA). Overnight cultures were extracted using the Qiagen Midiprep Kit (Qiagen, Valencia, CA), following the manufacturer's protocol. Extracted BAC DNA was then amplified by multiple displacement amplification with the Qiagen Repli-G midi kit (Qiagen), following the manufacturer's protocol before proceeding to labeling by nick translation.
DNA Labeling by Nick Translation
DNAs were labeled by a nick translation kit (Abbott Molecular Inc., Des Plaines, IL) with fluorophore-conjugated dUTPs (Enzo Life Sciences Inc., Farmingdale, NY), including the following: aqua 431-dUTP (excitation, 431 nm/emission, 480 nm), green 496-dUTP (excitation, 496 nm/emission, 520 nm), gold 525-dUTP (excitation, 525 nm/emission, 551 nm), orange 552-dUTP (excitation, 552 nm/emission, 576 nm), red 580-dUTP (excitation, 580 nm/emission, 603 nm), and red 650 (Cy5)-dUTP (excitation, 650 nm/emission, 662 nm). For combinatorial labeling, two or three fluorophore combinations were chosen to minimize spectral overlap. Optimal fluorophore-conjugated dUTP mixture concentrations were empirically determined after probe visualization under the microscope. The number of possible C combinations is a function of n fluorophores and k encoding sets, C(n, k) = n!/k!(n-k)!. Therefore, with six fluorophores and using two-color encoding, 6!/2!(6-2)! or 15 unique combinations can be generated; for three-color encoding, 6!/3!(6-3!) or 20 unique combinations are possible. Ethanol-precipitated nick translation reactions were resuspended in hybridization buffer.
First, the labeling scheme or bar code was chosen for each gene. For labeling reactions, nucleotide working dilutions were prepared by mixing 0.3 mmol/L ATP, 0.3 mmol/L GTP, and 0.3 mmol/L CTP to obtain 0.1 mmol/L dNTP. Nuclease-free water was added to 0.3 mmol/L dTTP to a final 0.1 mmol/L working solution. dUTPs were reconstituted to 0.2 mmol/L working solutions. The UTP/TTP/NTP mix was prepared in one tube for each color combination, by first adding the amounts of dUTPs and TTPs, following the formula in Table 3.
Table 3.
Nick Translation Schema for Labeling Multiplex FISH Probes
| Fluorophore-labeled dUTP and dTTP concentrations | |||
|---|---|---|---|
| dUTP | EX/EM, nm | 0.2 mmol/L dUTP, μL∗ | 0.1 mmol/L dTTP, μL† |
| 0.2 mmol/L Aqua | 433/480 | 3 | 4.5 |
| 0.2 mmol/L Green | 497/524 | 3 | 4.5 |
| 0.2 mmol/L Gold | 550/564 | 3 | 4.5 |
| 0.2 mmol/L Orange | 559/588 | 2.5 | 5 |
| 0.2 mmol/L Red | 580/603 | 2.5 | 5 |
| 0.2 mmol/L Cy5 | 650/662 | 3 | 4.5 |
| MIX for nick translation reaction | |||
|---|---|---|---|
| Reagent | Volume, μL | ||
| 0.2 mmol/L dUTP | ∗ | ||
| 0.1 mmol/L dTTP | † | ||
| 0.1 mmol/L dNTP | 20 | ||
| 10× Nick translation buffer | 10 | ||
| Total | 45 | ||
| Nick translation reaction components (in duplicate) | |||
|---|---|---|---|
| Probe label | Amount (×2 tubes) | ||
| DNA | 1 μg | ||
| dH2O | 17.5 μL, volume of DNA | ||
| MIX | 22.5 μL | ||
| Nick translation enzyme | 10 μL | ||
| Total | 50 μL | ||
Table depicting the quantities of each of nick translation reaction components. Labeled dUTP is selected and added to the master mix. Nick translation is performed by combining 1 μg of DNA, the master mix, and the nick translation enzyme.
dH2O, distilled water; EM, emission; EX, excitation; FISH, fluorescence in situ hybridization; MIX, solution mixture.
As specified in fluorophore-labeled dUTP concentrations.
As specified in fluorophore-labeled dTTP concentrations.
Ideally, the fluorescence intensity of each dye should be equivalent, but this was not observed in practice, requiring adjustments in concentration during probe preparation. Table 3 specifies the optimal amount of each fluorophore and respective dTTP for each reaction. For example, if green and orange were chosen to label an individual gene, 3 μL of green dUTP, 2.5 μL of orange dUTP, and 9.5 μL of dTTP should be pipetted in the mix. The nick translation reaction master mix was prepared, as indicated in Table 3; combined with 1 μg of BAC DNA, as indicated in Table 3, at 15°C for 3 hours; and terminated by heating to 70°C for 10 minutes. Samples were then placed on ice and protected from light.
The efficiency of the nick translation reaction was confirmed by analyzing the product size distribution using agarose gel electrophoresis (Supplemental Figures S1 and S2). Gel electrophoresis was performed with 2% agarose diluted in Tris base, acetic acid, and EDTA buffer; 10,000X GelRed was then added (1× final concentration; Phenix Research Products, Candler, NC). Each reaction (5 μL) was run at 120 V for 30 to 40 minutes. Gel images were captured using a Gel Doc XR+ Imager (Bio-Rad, Hercules CA).
Purification of Nick-Translated Probes
The nick translation reactions for each gene were pooled at equal volumes, and a 1.5× amount of Cot-1 human DNA (Life Technologies, Carlsbad, CA) was added (>1.5× began to suppress fluorescent signals), followed by the addition of a 1:10 total volume of 3 mol/L sodium acetate (pH 5.2) and 2 to 3 volumes of 100% ethanol. For a 5-plex assay, the reaction would contain a total of 5 μg of various BAC DNAs, plus 7.5 μg of Cot-1. The mixture was centrifuged at 18,000 × g for 20 minutes at 4°C to pellet the labeled DNA. The supernatant was discarded, and the pellet was washed with 70% ethanol and centrifuged at 18,000 × g for 10 minutes. Supernatants were discarded, and the pellet was air dried in the dark for 5 to 10 minutes. The probe was resuspended with nuclease-free water, and five volumes of hybridization buffer were added and mixed well. The mixture was denatured by heating at 72°C and immediately placed on ice. Probes were stored at −20°C until use.
Hybridization Buffer
Hybridization buffer was composed of 50% v/v deionized formamide, 2× SSC, 50 mmol/L potassium dihydrogen phosphate/disodium hydrogen phosphate buffer (pH 7.0), 1 mmol/L EDTA, and 5% to 10% v/v dextran sulfate.
Mounting Media
Antifade chemicals contained in mounting media as well as pH can interfere with the stability of some fluorophores. Commercially available options (Vectashield, Vector Laboratories, Burlingame, CA; ProLong Gold and ProLong Diamond, Life Technologies) as well as home-brewed media [1,4-diazabicyclo[2.2.2]octane (DABCO), Mowiol, and 2,2′-thiodiethanol (TDE); all from Sigma-Aldrich] were tested. The best fluorophore stability across the entire spectra (from aqua to far red spectra) was obtained with the home-brewed glycerol-based medium, following protocol from (Nikon Imaging Center at Harvard Medical School, http://nic.med.harvard.edu/resources/media, last accessed January 29, 2018). The glycerol-based medium was composed of 0.5% w/v n-propyl gallate, 90% glycerol, and 20 mmol/L Tris (pH 8). No counterstain, such as DAPI, was added to minimize unwanted background fluorescence.
Hybridization
Fixed cells were dropped onto microscope glass slides, air dried, and treated with Digest-all (Thermo Fisher, Waltham, MA) at 37°C for 3 minutes; washed with 2× SSC; and dehydrated in ethanol. Cells were codenatured with FISH probe mixes using a Hybrite slide processor (Abbott Molecular, Des Plaines, IL) at 75°C for 5 minutes, followed by incubation for 36 hours at 40°C. For formalin-fixed, paraffin-embedded samples, denaturation was performed at 85°C for 5 minutes. After hybridization, slides were washed two times in 2× SSC/0.1% Nonidet-40 for 3 minutes each at 72°C. After washing, slides were mounted in the glycerol-based media without DAPI.
Image Acquisition
Images were acquired with an ELYRA Zeiss LSM 710 (Carl Zeiss Microscopy, Jena, Germany) laser confocal microscope because of its ability to produce optical sections (stacks), which are amenable to volume-rendered three-dimensional (3D) reconstructions of the specimens, with reasonable accuracy. The microscope was configured with four lasers, diode (440 nm), argon (488 nm), diode-pumped solid state (561 nm), and helium-neon (633 nm); a high-efficiency triple band pass beam splitter (488/561/633 nm); and a single line MBS (445 nm). Two objective lenses were used in this study: a Plan-Apochromat 100×/1.46 numerical aperture (Carl Zeiss Microscopy) and a Plan-Apochromat 63×/1.40 numerical aperture (Carl Zeiss Microscopy). Shifts in the optical path were checked and corrected for by using a TetraSpeck Fluorescent Microspheres Size kit (Life Technologies, Carlsbad, CA) as well as with cells hybridized with a Y-chromosome BAC (DYZ1) labeled simultaneously with all six fluorophores (see additional details below in Image Registration). Images were collected with a 100× objective lens with a bit depth of 16 bits and a frame size of 512 × 512 pixels, with an image pixel size of 0.06 μm. Multiple Z-stacks were collected at an interval of 0.10 μm. Analysis of the 100× objective lens captured images that allowed us to broaden the pixel size and intervals and adopt the 63× objective lens. Images acquired with the 63× objective lens had a bit depth of 16 bits; a frame size of 256 × 256 pixels, with an image pixel size of 0.12 μm; and Z-stack intervals of 0.20 μm.
Fluorescence colors were detected using λ mode and spectral unmixing with a 34-channel photomultiplier tube for high-resolution spectral image acquisition. The reference spectrum for each fluorophore was determined by obtaining the profile from slides hybridized with each gene labeled as a single color. The resulting spectra were stored in the Spectra Database of the microscope. Linear unmixing separated mixed signals pixel by pixel, using the algorithm in Zen Black 2011, the Zeiss proprietary software. This algorithm encompasses the entire emission spectrum of each of the fluorescent markers in the sample. All image data were further used to build the image analysis algorithm.
Image Analysis Pipeline
Image Registration
Chromatic aberration, the vertical shift in apparent position of objects, is a concern when imaging samples with multiple fluorophores. Blue wavelengths are focused closer to the lens than red wavelengths. Without corrective measures, two spots of different wavelengths appear as significantly separated and risk being undetected as a pair, despite actually overlapping. Although the search radius for each spot was increased to compensate for the shift, this caused several false-positive problems in certain genes, especially between pairs of spots originating from neighboring wavelengths, where the shift is not as large.
To correct for chromatic aberration, separate tumor cell samples were hybridized with Y-chromosome BACs (DYZ1) labeled with all six fluorophores simultaneously (Figure 1). Because it was observed that the extent of the shift differed between acquisition sessions, new samples were prepared and imaged as quality control for each experiment. Z-stacks from three randomly selected cells were acquired per image acquisition session, allowing the development of a transformation matrix to register the Y-chromosome channels. This matrix was then applied to the actual data sets stained with FISH probes. Channels 2 to 6 were registered to the reference channel, channel 1. Optical aberrations were observed in the axial and lateral directions, and to correct for this, only translational corrections in x, y, and z were implemented. Because optical aberrations are less expected to cause rotational and scaling differences between channels, such transformations were not used to decrease computation time. The registered Z-stack for each corrected data set was then saved as an ome.tiff format, which could be read using a bioformats reader.
Figure 1.

Color shift correction. Channels show significant shift in the lateral (A) and axial (B) dimensions. Each fluorophore (green) was registered to the reference channel, aqua 431 (purple). Transformations were constrained to translations in x, y, and z.
Nuclear Segmentation
The nuclear mask was obtained by thresholding a channel with highest background using an Otsu method–derived threshold value.16 With a 100×/1.46 NA objective lens, cells were limited to just one cell per field of view. However, as the image acquisition setup changed to using a 63×/1.4 NA objective lens, it was possible to fit more cells into a field of view to increase throughput. The watershed algorithm17 was implemented to split touching cells, where present, and each nucleus was analyzed separately.
Spot Detection
Fluorescence spots are composed of point sources as well as extended sources. Point source detection algorithms were applied to detect the probes in each channel. This approach relies on statistical comparison of image intensity local maxima with a model of the microscope point-spread function as a Laplacian of Gaussian function to detect low signal/noise ratio (SNR) spots in a manner that is adaptive to local variations in the signal and background, without requiring specification of arbitrary thresholds.18 This approach allowed us to measure accurately diffraction-limited fluorescence signals, taking into account the uncertainties of the fitted amplitude and local background when individually testing for the significance of each candidate signal. The σ factor for the Laplacian of Gaussian function in the lateral and axial directions was measured and averaged over several data sets for each magnification. For each detected local maximum, the amplitude intensity and the variation of noise in the background were extracted to approximate the SNR, as well as the calculated position in x, y, and z. Local maxima that were below a set threshold were eliminated. This threshold was optimized for each channel so that there were no false negatives but with a low amount of false positives, as visualized in Imaris version 9.0 (BitPlane AG, Zurich, Switzerland).
During spot detection, genes such as MYC in the lung cell line H1975 could be highly amplified to such an extent that the captured image manifested large blob-like shapes as opposed to spots. For each channel, the blobs were segmented by first excluding areas of the nucleus with spots, as determined by filtering with a Laplacian of Gaussian filter. Once the spots had been removed, the remaining nucleus region (ie, background) intensity was sampled, and a threshold for segmenting blobs was robustly set as 3 SDs above the median intensity of this background. Noise was approximated by measuring the variance of the background from an annulus around the blob. The number of copies of highly amplified genes (like MYC in H1975) was estimated by taking the volume of each blob and dividing it by the approximate volume of one gene spot. Figure 2 shows an example of a nucleus with a mixture of spots and blobs.
Figure 2.

Quantification of highly amplified genes. Volume rendering of an H1975 cell with spots and large blobs (indicating areas of highly amplified MYC gene) coinciding in the green 496 (green) and red 650 (purple) channel. The detection algorithm is able to detect single copies of gene spots (each identified with a single overlapping red sphere) and highly amplified genes seen as blobs (white). The extent to which a gene has been highly amplified is the ratio of the volume of a blob/the size of an average spot for that particular gene. Scale bar = 2.0 μm.
Coincident Spot Detection
The analysis algorithm requires a label matrix in the form of a .csv file that contains a list of pairs of channels for each gene. Briefly, coincident points for all possible combinations of fluorophores were identified as being spots within four pixels of each other. Any pairs that did not exist in the label matrix were immediately eliminated. In cases in which there were more than two spots located at a position, the most likely combination was determined on the basis of brightest intensity.
Gene Count Reporting
For each nucleus, the number of coincident spots for each gene and SNR for each channel were stored as .csv files. The algorithm can also be run in a batch analysis mode, which loops through multiple data sets and reports a summary of the average, median, and SD of the gene count.
Analysis Algorithm
Automated algorithms were developed to isolate bar-coded probe signals and to quantify their copy number per nucleus. The automated quantification algorithm was tested by assessing cell lines with the assumption that each gene would have to match the reference database obtained by manual quantification by single-probe/centromere control FISH. For each slide, 10 randomly selected nuclei were imaged; and automated copy number counts for each color combination, representing each gene, were undertaken, with the results displayed as median copy number per cell.
aCGH Analysis
For aCGH studies, genomic DNA was extracted from tumor tissue using the QIAamp Blood Mini Kit using a modified protocol incorporating deparaffinization and protease digestion (Qiagen). Agilent Sureprint 4×180k CGH + SNP microarrays (Agilent Technologies, Santa Clara, CA) containing approximately 180,000 copy number probes, covering both coding and noncoding human sequences, were used. Briefly, 1.0 μg of human reference DNA, male genomic control DNA (Coriell Institute, Camden, NJ), and 1.0 μg of tumor DNA were digested with AluI and RsaI, and then heat treated at 95°C for 5 minutes. Control and tumor DNAs were labeled by random priming with CY3-dUTP and CY5-dUTP dyes, respectively, using the Agilent SureTag Complete DNA Labeling Kit. The labeled DNAs were purified with the SureTag Reaction Purification Column and mixed in equal proportion for hybridization to the array in the presence of Cot-1 DNA (Invitrogen, Carlsbad, CA) using the Agilent Oligo aCGH Hybridization Kit. Hybridization steps included 3 minutes of denaturation at 95°C, prehybridization for 30 minutes at 37°C, and hybridization for 40 hours at 65°C. After hybridization, the slides were washed with Agilent Oligo Array CGH Wash Buffer 1 and Buffer 2. Washed slides were scanned using the Agilent G2565CA Microarray Scanner. Microarray TIFF (.tif) images were processed and analyzed with Agilent CytoGenomics software version 2.7.
Validation
The multiplex FISH profiles were validated in two ways. First, to confirm the multiplex FISH results, the baseline copy number of each gene in each cell line was verified by traditional single-FISH manual quantification (Supplemental Table S1). Second, in addition to the locus-specific probe, the correspondent centromere enumeration probe was used as an internal reference control. Normal cutoff values were established by scoring 200 interphase nuclei for each tumor cell line, 100 interphase nuclei for each cultured CTC, and 200 interphase nuclei of normal peripheral blood. The mean copy number value and ranges were obtained and used as reference to establish the scoring criteria and acceptable values for the multiplex assay.
Analysis of Reproducibility and Accuracy
Statistical guidance was obtained from the Massachusetts General Hospital Biostatistics Center, and analyses were performed independently. Analysis of variance was conducted on independent repeated hybridizations of normal lymphocytes (25 replicates) and cell lines 293T (12 replicates) and H1975 (9 replicates) to establish whether there was significant variation between the scoring distributions of each replicate. P < 0.05 was considered statistically significant. GraphPad Prism 5.0 software (GraphPad Software, San Diego, CA) and R-Studio 3.4.3 software (RStudio, Boston, MA) were used.
Results
The evaluation of the multiplex locus-specific FISH assay was initiated using BACs labeled in multiple colors and hybridized to cells of known gene copy number, with images acquired with a scanning laser confocal microscope combined with a custom analysis pipeline, as detailed below.
Probe Development
Before developing a multiplex assay, single BAC probes, labeled with two or three fluorophores hybridized to control cells, were imaged (Figure 3A). This step allowed setting initial parameters for image capture, such as laser power, and correcting for chromatic aberrations in the z axis. A prototype two-color multiplex labeling scheme, using mixtures of six fluorophores, was designed for five important cancer genes, first using BACs overlapping the gene coding regions (PDGFRA, MET, EGFR, MYC, and RET genes) (Figure 3B). Although the BAC labeling reactions were performed with standard nick translation protocols, significant troubleshooting was required to determine which fluorophores could be combined together and in what ratios. Given different emission and excitation spectra, different quantum yields, different incorporation efficiencies, and unpredictable quenching effects, empirical testing of combinations was required. In total, three working probe pools of different plex levels were designed and tested (Figure 3, C–E). The labeling schemes are detailed for the 5-plex mix (Figure 3C), a larger 10-plex mix (Figure 3D), and a 15-plex mix (Figure 3E).
Figure 3.

Combinations of fluorophores were used to bar code each gene. A: Multiplex fluorescence in situ hybridization probe mixes were constructed with the goal of bar coding each gene probe with a unique combination of two (left panel) or three (right panel) fluorophores. B: A 5-plex probe hybridization assay (PDGFRA, MET, EGFR, MYC, and RET genes) was tested with a two-fluorophore bar code. C–E: The probe labeling scheme or probe matrix is shown for 5 (C), 10 (D), and 15 (E) genes. Each column shows the respective color combinations for each gene. Each gene was labeled by nick translation separately, and the products were then combined in a single tube and concentrated to produce the probe mix. The scheme is used by the image analysis algorithm for identification of colocalized signals that are considered statistically significant and assign the corresponding gene. Scale bars = 2 μm (A). Chr, chromosome; Em, emission; Ex, excitation.
With optimized fluorophore labeling combinations, signal intensity and SNR of the pool of five probes were evaluated in a cell line using a Zeiss LSM 710 laser-scanning confocal microscope (Figure 4). Images reveal discrete nuclear spots with minimal background noise, reflecting efficient fluorophore incorporation and a robust probe-specific activity. Individual channel images were evaluated to ensure colocalization of fluorophores, according to the expected labeling scheme. On the basis of this preliminary work, a standard recipe was established for optimally combining fluorophores for two- or three-color encoding. Because two-color bar coding produces larger and brighter spots (Figure 3A), subsequent microscopy settings and image analysis algorithm development used this approach.
Figure 4.

Hybridization of a 5-plex probe mix to the cell line. Representative single z-plane image showing the five combined channels (A) and single-color channels (B–F), with efficient fluorophore incorporation and robust probe-specific activity. The expected colocalization of fluorophores was evident and reflected the expected preexperimental labeling plan. Scale bars = 10 μm (A–F). Em, emission; Ex, excitation.
Imaging
Two major imaging challenges were as follows: what imaging parameters allowed for the most sensitive detection and localization of spots, and what parameters allowed colocalized spots to be optimally resolved. Images were acquired with a Zeiss multicolor confocal microscope using simultaneous excitation with four lasers, using a 100× objective, and capturing approximately 60 z planes. Confocal microscopy was used to reduce out-of-focus blur and, therefore, obtain optimal resolution in the z axis. Multispectral imaging combined with linear unmixing was used to obtain optimal identification of fluorophores; and serial optical z sections, required for 3D renderings, were generated and used to build the image analysis algorithm. Standard clinical FISH imaging systems generally use maximum intensity projections, which would result in a high false-positive rate because spots from different z planes would erroneously appear to overlap. A reference spectrum was obtained for each of our six fluorophores individually from normal lymphocytes hybridized with BAC probes labeled with only the fluorophore of interest. The reference spectra libraries were used to evaluate the contributions of mixed fluorophore signals in the pooled probe hybridization.
Analysis
Automated algorithms were developed to detect and localize bar-coded probe signals and to quantify their copy number per nucleus (Figure 5). These algorithms comprised the sequential operations: i) acquisition of serial optical sections of fluorescent signals to generate 3D renderings (Figure 5A); ii) nuclear segmentation with delimitation of the region of interest, then defining spots with a high probability of containing a point-source signal (including the estimation of the spot signal intensity and spot 3D subpixel localization) (Figure 5B); and iii) matching of colocalized fluorescent spots with the gene panel matrix to identify and quantify each gene (Figure 5C). This approach relies on statistical comparison of intensity of local fluorescence maxima with a model of the microscope point-spread function to rigorously detect low SNR spots in a manner that is adaptive to local variations in the signal and background, without requiring specification of arbitrary thresholds.18 This approach allowed us to accurately measure diffraction-limited fluorescence signals, taking into account the uncertainties of the fitted amplitude and local background when individually testing for the significance of each candidate signal.
Figure 5.

Workflow for quantifying gene count. A: Volumetric rendering of a circulating tumor cell hybridized with 15 genes. B: Nuclear masking to eliminate false-positive point source detection outside of nucleus and point source detection based on fitting a three-dimensional Laplacian of Gaussian model across the data set. Maxima of each channel are shown. C: Coincident spots that are located within a predefined radius are matched to genes based on a label matrix. Scale bars = 10 μm (A–C).
The automated gene quantification algorithm established that two spots in different channels colocalized if the centers of the spots were within four pixels. Because each gene should be represented by two spots that match the established labeling schema, the gene copy number count is determined by the number of colocalized spots. The definition and elimination of nonnoise disruptive features and accurate identification of probe bar codes in nonuniform background spectra are the major challenges that were addressed to improve automated counting.
Validation
Twenty-one cell lines were selected for validation (Table 1). To establish the true gene copy in each line, single-color FISH was performed for each gene locus and the spots were scored manually by eye. Reference gene counts were established by manually scoring 200 (tumor cell line) or 100 (CTC) interphase nuclei for each cell preparation. The mean copy number value and ranges were obtained and used as a reference to establish the accuracy of the automated count for the multiplex assay (Supplemental Table S1). Multiplex FISH was performed first using the 10-plex version of the assay, showing strong and discrete signals in cells in 3D (Figure 6A). Because most tumor lines are aneuploid, the accuracy of automated scoring was first tested in interphase primary lymphocytes, for which the copy number state was ascertained, and the scores were compared to single-gene manual scoring (Figure 6B). Manual scoring of single-probe FISH confirmed that the cells possessed two signals for each probe, confirming the normal diploid state of the lymphocytes. Multiplex FISH with 10 nuclei captured, followed by automated counting, revealed accurate scoring, with the caveat that the probes for MET, EGFR, and MYC averaged lower than two copies, although error bars did extend to two copies for all genes (Figure 6B).
Figure 6.

Gene quantification of a 10-gene probe mix. A: Confocal image of circulating tumor cell hybridized with the 10-gene probe mix. B–G: Representative copy number analyses of normal lymphocytes (B), cultured circulating tumor cells BRX-7 (C), BRX-42 (D), and BRX-61 (E), and tumor cell lines H1975 (F) and GBM18 (G). A 10-plex probe mix was used to fine-tune the software detection sensitivity. The presence of noise due to the nonhomogeneous nature of the nucleus results in false-positive calls increasing the detected number. Closed bars represent copy number values obtained by automated quantification [multicolor fluorescence in situ hybridization (M-FISH)], and open bars represent copy number values obtained by manual standard single FISH evaluation, our gold standard. F: The H1975 cell line shows amplification of MYC that was captured by the automated quantification and supported by traditional analysis. Data are expressed as means ± SD (B–G). Scale bar = 10 μm (A).
With the first hurdle of accurate copy number assessment in lymphocytes overcome, the same 10-gene panel was applied to transformed cancer cell lines and breast cancer CTCs (Figure 6, C–G). High-level amplification of the MYC gene was detected, as expected, in lung cancer line H1975 (Figure 6F). In addition, high-level ERBB2 amplification was detected in the breast cancer transformed line HCC1954, as has been previously described.19 TP53 was underlined in the glioblastoma cell line (Figure 6G) using the multiplex assay, likely reflecting challenges with the overlapping spectra of the dual labels used (red and orange) or challenges with SNR in those specific experiments.
Cell lines were also investigated by aCGH, and results were plotted against single and multicolor FISH. aCGH showed overall good agreement with multicolor FISH across multiple cell lines (Figures 7, 8, and 9) and confirmed amplification of MYC observed in H1975 (Figure 7, A–C). However, single FISH showed a stronger agreement with aCGH, indicating some improvement in the multiplex analysis is still needed (Figure 7, D and E). Some genes, particularly CDKN2A, showed poor performance in the multiplex probe mix compared with aCGH, as seen in BUML (Figure 8, A and B), UACC62 (Figure 8, C and D), and MCF10A (Figure 8, E and F). TP53 underperformed in GBM18 (Figure 2, Figure 4, Figure 9, A and B), and MDM4 and ERBB2 underperformed in PC3 (Figure 9, C and D). The definition and elimination of nonnoise disruptive features and accurate identification of probe bar codes in nonuniform background spectra are the major challenges that were addressed to improve quantification in the multiplex assay.
Figure 7.

Array comparative genomic hybridization (aCGH) analysis of the 293T and H1975 cell lines. A: Multicolor fluorescence in situ hybridization [multiplex-FISH (M-FISH)] automated quantification and reference single FISH analysis of 10 genes in the H1975 cell line. Red dots indicate the copy number derived from aCGH, as an average of probes spanning the relevant genes. B: Genome copy number summary for aCGH analysis of H1975. The horizontal axis represents the linear position along the chromosome, whereas the vertical axis represents the measured log2 signal ratio (−2 to 2). Relevant gene names are placed in the appropriate genomic positions. C: Zoomed-in view of chromosome 8 view, depicting high-level copy number gain for MYC. D: M-FISH automated quantification and reference single FISH analysis of 10 genes in the 293T cell line, with red dots indicating the copy number derived from aCGH. E: Genome copy number summary for aCGH analysis of 293T. Data are expressed as means ± SD (A and D). Chr, chromosome.
Figure 8.

Array comparative genomic hybridization (aCGH) and fluorescence in situ hybridization (FISH) validation for cell lines. Multiplex FISH quantification and comparison to single FISH and aCGH (red dots) for BUML (A), UACC62 (C), and MCF10A (E) cell lines. Corresponding aCGH genomic profiles, shown as log2 ratios, for BUML (B), UACC62 (D), and MCF10A (F) cell lines. Data are expressed as means ± SD (A, C, and E). Chr, chromosome; M-FISH, multiplex-FISH.
Figure 9.

Array comparative genomic hybridization (aCGH) and fluorescence in situ hybridization (FISH) validation for cell lines. Multiplex FISH quantification for 10 genes in GBM18 (A) and 15 genes in PC3 (C) cell lines and comparison to single FISH and aCGH (red dots). Corresponding aCGH genomic profiles, shown as log2 ratios, for GBM18 (B) and PC3 (D). Data are expressed as means ± SD (A and C). Chr, chromosome; M-FISH, multiplex-FISH.
To assess multiplex FISH reproducibility, multiple replicates of the assay were performed in 293T cells, H1975 cells, and the normal lymphocyte preparation. These data are summarized in Figure 10, as box-and-whisker plots for each gene replicate, and include >5000 single-probe data points. Analysis of variance was performed to compare across replicates, and the P values for the analysis of variance are listed in each panel. For the lymphocyte data set, 7 of 10 genes showed no statistically significant variation across the 25 replicates. For the three genes with an analysis of variance P < 0.01, the mean copy number values of each replicate are actually near the expected value of two copies. 293T and H1975 have higher variability than lymphocytes based on the number of genes with significant P values by analysis of variance. This variability correlates with the degree of aneuploidy, which perhaps increases the assay noise and generates challenges for spot detection. Even with variability seen in H1975, only one gene, MYC, in H1975 would have been called amplified. This is most clearly seen when the same data are visualized without autoscaling, but with a fixed Y scale up to 40 copies (Supplemental Figure S3). A scatterplot of duplicate hybridization experiments of 293T and H1975 showed good correlation, with an R2 of 0.93 (Figure 11).
Figure 10.

Reproducibility analysis of multiplex fluorescence in situ hybridization (FISH). Box-and-whisker plots are shown for mean and interquartile range for copy number counts for each replicate experiment. Panels show grouped replicates for 293T (left column), H1975 (middle column), and normal lymphocyte preparations (right column), with a different gene in each row. The y axis is scaled to optimize the ability to visualize the full range of copies per gene across the three lines. Displayed P values are for analysis of variance performed within each group of replicates. Above each replicate is indicated either significant (red triangles) or nonsignificant (green circles) deviation from gold standard single FISH in the same cell lines. n = 12 replicates (left column); n = 9 (middle column); n = 25 (right column).
Figure 11.

Reproducibility analyzed by duplicate multiplex fluorescence in situ hybridization analysis of H1975 and 293T cells. Scatterplot of average gene automated copy number counts in two independent hybridizations using the 10-plex probe mix for H1975 (blue circles) and 293T (red triangle) cell lines. Correlation coefficient for the replicates is shown. Dotted line indicates linear regression line. Error bars indicate 1 SD.
To help visualize assay accuracy, above each replicate in Figure 10, it is indicated whether that individual replicate copy number mean deviates significantly from the gold standard single FISH score. Some genes, such as FGFR3, show little variation from the expected values across all replicates. Others, such as MDM4, show a systemic variation from the expected values. This is not necessarily clinically problematic because, in general, the variations from the gold standard are systematic but minor, as shown for the lymphocyte MDM4 panel. This is shown in detail for the same MDM4 data in Supplemental Figure S4. For this probe, there is a small bias to detect more than the expected two copies. Deviation for each of the 10 genes from the expected is shown in detail for the lymphocyte data, revealing that 9 of 10 probes have a mean deviation of <0.5 copies, with only MET being just beyond a -0.5 deviation.
Hybridizations with a higher plex level of 15 genes (Figure 12A) demonstrated that the biggest hurdle is to minimize false negatives that can lead to some of the genes being underrepresented during quantification, such as CDK4 and MYCN (Figure 12, B and C). One possible explanation can be poor probe intensity for one of the colors, preventing from a match being made to the label matrix and resulting in that spot being ignored by the quantification algorithm. Reductions in probe labeling variability will be essential for clinical implementation.
Figure 12.

Gene quantification of a 15-gene probe mix. A: Confocal image of circulating tumor cell hybridized with the 15-gene probe mix. B and C: Representative images of copy number analyses of cultured circulating tumor cells BRX-68 (B) and BRX-82 (C). Cells were hybridized with a probe mix containing 15 genes bar coded with two fluorophores. The presence of noise due to the nonhomogeneous nature of the nucleus results in false-negative calls for MYCN and CDK4 in BRX-68 (B) and BRX-82 (C). Copy number values obtained by automated quantification [multiplex-FISH (M-FISH)], and copy number values obtained by manual standard single FISH evaluation. Data are expressed as means ± SD. Scale bar = 10 μm (A).
Although the current imaging pipeline uses a laser-scanning confocal microscope with spectral imaging and produces images with high contrast, detail, and reduced cross talk between fluorophores (Figure 13A), it is impractical for clinical applications because it has only a throughput of approximately 10 nuclei per hour. Therefore, moving to a widefield platform will be essential for clinical use. To explore the use of a more standard and higher-throughput widefield fluorescence microscopy system, the multiplex assay was piloted on the Zeiss Cell Observer widefield system. For confocal images, the data suggested that a sampling rate of 0.2 μm in the axial direction is sufficient to resolve spots in the z axis. Because the axial resolution on a confocal microscope is only marginally better, this step size was retained for widefield microscopy. Bright high-quality probe signals were easily detected, with good SNR (Figure 13B), by using a 63× objective and a sensitive sCMOS camera (Hamamatsu Photonics, Hamamatsu City, Japan). More important, the 63× objective, along with the large camera chip, allowed for rapid capture time, increasing the system throughput to >100 nuclei per hour.
Figure 13.
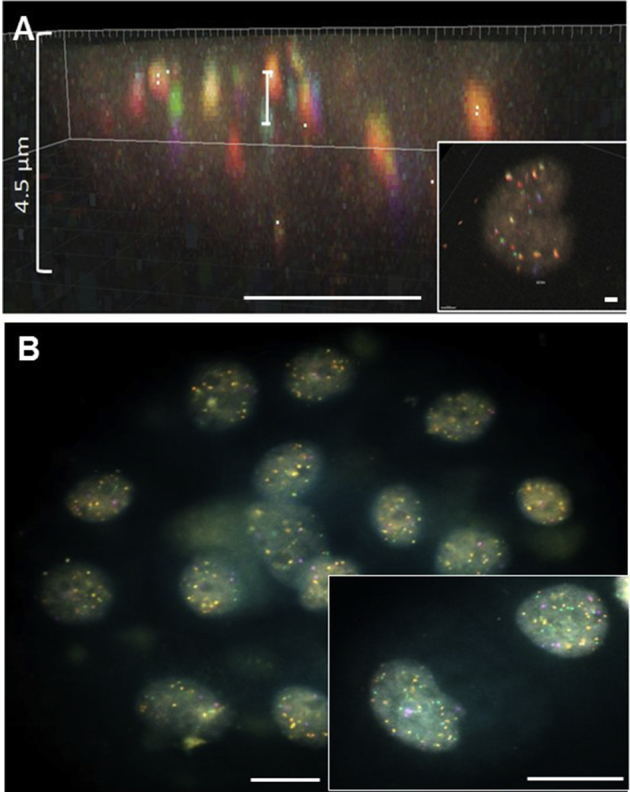
Parameters collected with the confocal microscope help build the image analysis platform and will allow shifting the imaging acquisition to a widefield optical system to decrease its turnaround time. A: Serial optical sections were acquired by confocal microscopy and visualized as three-dimensional renderings to aid in the development of the image analysis algorithm. Side projections were used to determine a suitable axial step size to adequately sample neighboring spots in widefield microscopy. The bracket illustrates the separation between two neighboring, but nonoverlapping, spots that, if not resolvable, would otherwise be erroneously considered colocalized. Side projection is shown in the main panel. Inset: Upper view is shown. The time required to acquire each image turns confocal into an impractical solution in a clinical laboratory setting. B: Same cells captured with the Zeiss Cell Observer widefield fluorescence microscope. Images were captured with a 63× objective lens (numerical aperture = 1.40). The widefield microscope provides larger fields of view and better photon collection efficiency, producing brighter nuclei (inset) and a faster image acquisition time. Substantial compromise of z-axis resolution is not seen. The higher throughput of the widefield scope is more suited for a clinical setting. Scale bars: 2 μm (A, main image and inset); 20 μm (B, main image and inset).
Discussion
The assessment of gene copy number is important in the management of cancer patients and is standard of care for the ERBB2 gene in breast20, 21, 22 and esophagogastric tumors.23, 24, 25, 26 As the number of targeted therapies grow, gene amplifications and deletions are likely to be of growing importance as predictive biomarkers.27, 28, 29 A growing unmet need for such tests is seen in our clinical diagnostics operation and in our clinical trial support, with trials focused on copy number changes in ERBB2, EGFR, MET, PDGFRA, KIT, FGFR1, FGFR2, MYC, NMYC, CDK4, CDK6, and CDKN2A. There are 20 to 30 genes involved in well-annotated amplification and deletion events in cancer. There is currently no simple and accurate method to simultaneously assay this many genes in larger panels and more comprehensive analysis. Therefore, a robust and reproducible multiplex FISH assay, such as the one developed herein, has the potential to be clinically useful and therapeutically informative. With the current limitation of a 15-plex FISH with the current assay, analyses of one sample of cells across two slides could render copy number quantification of up to 30 genes.
There are several other technologies to assess copy number at a genome-wide scale, so the role of multiplex FISH must be questioned. The two most prominent competing technologies are aCGH30, 31 and NGS,32, 33 which still have challenges with accurate somatic copy number assessment in cancer. Because both techniques use DNA extracted from whole tissue sections, there is always substantial dilution of the tumor cell contribution by normal stromal or inflammatory cells. The degree of dilution depends on the tumor cell fraction and the actual true copy state of the genes in tumor cells. Thus, analysis of a gene like ERBB2, for which a copy number ratio for a positive call is 2.0 by FISH,34 will show signals that do not exceed noise using aCGH or NGS and will not be called positive. FISH, by definition an in situ assay, has the major advantage of determining absolute gene spot counts within the tumor cell population only. Single-cell sequencing is an exciting alternative technology, but currently it is expensive, and DNA copy number has not yet been accurately proved at the single gene level. Genomic in situ assays, such as Multiplexed Ion Beam Imaging,35 using multiple probes labeled with different mass metals and localized with mass spectrometry, or fluorescent in situ RNA sequencing,36, 37 which is essentially NGS with sequencing directly on nucleic acid molecules fixed in situ in tissue, does not currently have the resolution for gene locus required for copy number assessment.
The multiplex FISH assay described herein may be a possible stand-alone clinical assay, but more likely serves as an adjunct performed side by side with NGS mutational panels in comprehensive genotyping laboratories. Because only one or two slides will be required, an efficient, automated, and cost-effective workflow can be established in the clinical laboratory. Likewise, automation reduces intraobserver and intralaboratory variability. This assay may be especially powerful in small samples as well as in those with low tumor fraction. The optimal sample for this technology may, in fact, be CTCs, for which one often obtains only a few cells per blood draw. One would be able to render an accurate copy number assessment even with 5 to 10 cells. In research, there will be numerous uses of multiplex FISH, especially the critical study of copy number genetic heterogeneity in cancer. Single-cell sequencing is allowing great strides in these studies of heterogeneity; however, accurate copy number calls are possible only for large segment gains and losses, not for single genes.38 Copy number heterogeneity is clinically understudied, and it likely underlies poor clinical response to targeted therapies (eg, with EGFR amplification in GBM) and the failure of multiple anti–EGFR-targeted trials.
For clinical copy number assessment, the described approach still has significant limitations that need to be overcome, including the following: i) nuclear truncation or artifactual losses of gene counts by tissue sectioning (ie, inherent to histologic sectioning), ii) confounding effects of tissue autofluorescence, iii) batch-to-batch probe labeling variability, and iv) the low-cell throughput and high cost of confocal microscopy. Confocal microscopy is impractical in the clinical setting, its handling requires more expertise, and its maintenance is expensive. A customized widefield microscope system, such as used routinely for multicolor FISH, would be needed. We piloted a Zeiss-based system equipped with sensitive optics that favors detection of even dim spots; however, additional filter sets will be needed to allow for the full six-fluorophore assay. Without spectral imaging, a filter cube–based approach will have challenges with fluorophore overlap.
These challenges are outweighed by several important advantages, including the following: i) more accurate copy number assessment than other genomic methods (eg, NGS), ii) more comprehensive assessment than current single or low plex-level FISH assays, and iii) the power to multiplex genes even in small samples/single cells.
In summary, we have demonstrated the use of combinatorial probe labeling to allow highly multiplexed FISH copy number analysis of up to 15 genes simultaneously. This approach was validated with cells and cell lines of known copy number and offers an accurate and practical method for absolute gene copy number assessment in cancer.
Acknowledgments
We thank Dr. Hang Lee for the assistance with statistical analysis and the Harvard Center for Biological Imaging for infrastructure and support.
H.L.E. and A.J.I. conceived the multiplex fluorescence in situ hybridization strategies and supervised the project; M.L.O. and C.Y. designed the experiments and interpreted the data; D.R., Z.Z., V.C., J.L., J.P.S., M.W.M., H.S.S., M.L., and Q.H. collected data; C.Y. and H.L.E. designed the image analysis tool; M.L.O., C.Y., B.C., H.L.E., and A.J.I. wrote the manuscript; J.K.L. evaluated all data and performed the statistical analysis; all authors critically revised the manuscript and gave final approval of the version to be submitted for publication; A.J.I. is the guarantor of this work and, as such, had full access to all data and takes responsibility for the integrity of the data and the accuracy of the data analysis.
Footnotes
Supported by a NIH–National Cancer Institute grant; Innovative Molecular Analysis Technologies program grant 1R21CA183686-01A1; Harvard Catalyst/The Harvard Clinical and Translational Science Center, NIH, National Center for Advancing Translational Sciences grant UL1 TR001102; and Harvard University and its affiliated academic health care centers' financial contributions. NIH–Shared Instrumentation Grant (SIG) award 1S10RR029237-01 was used to acquire the ELYRA Zeiss LSM 710 microscope.
M.L.O. and C.Y. contributed equally to this work.
H.L.E. and A.J.I. contributed equally to this work as senior authors.
Disclosures: None declared.
Supplemental material for this article can be found at https://doi.org/10.1016/j.jmoldx.2019.01.010.
Supplemental Data
Supplemental Figure S1.

Nick translation gels. Pilot studies were performed to determine the protocol for probe labeling by nick translation that would result in the most efficient label time with the best performance of hybridization. To evaluate efficiency of labeling time, nick translation was performed at different time points (16, 8, 4, 3, and 2.5 hours), and labeling efficiency was checked by gel electrophoresis. A: Time points of 16 and 8 hours result in shorter fragments (200 to 100 bp); however, the quality of hybridization is lower, with speckles in the background and weaker-intensity signals. B and C: Time points of 4, 3, and 2.5 hours were studied, which result in fragments of predominantly 100 to 400 bp and higher quality of specimen hybridization. Aq, aqua; Gd/Gld, gold; Gr, green; Or, orange; R/Rd, red.
Supplemental Figure S2.

Three-hour nick translation product gels. Nick translations of 3 and 4 hours show comparable results, so 3 hours was adopted as the standard nick translation time. A: A 3-hour nick translation 2% agarose gel showing unlabeled DNA bands on the left and DNA labeled with combinations of two fluorophores and size range of 100 to 400 bp. B: Gel showing DNA on the left and DNA labeled with two and three fluorophores. A/Aq, aqua; Cy, Cy5; Gd, gold; Gn, green; Or, orange; Rd, red.
Supplemental Figure S3.

Reproducibility analysis of lymphocyte (right column) and cell lines 293T (left column) and H1975 (middle column). Same data shown as in Figure 10, with a fixed y-axis range of 0 to 40 copies, to optimally visualize the difference between amplified (MYC) and nonamplified genes.
Supplemental Figure S4.
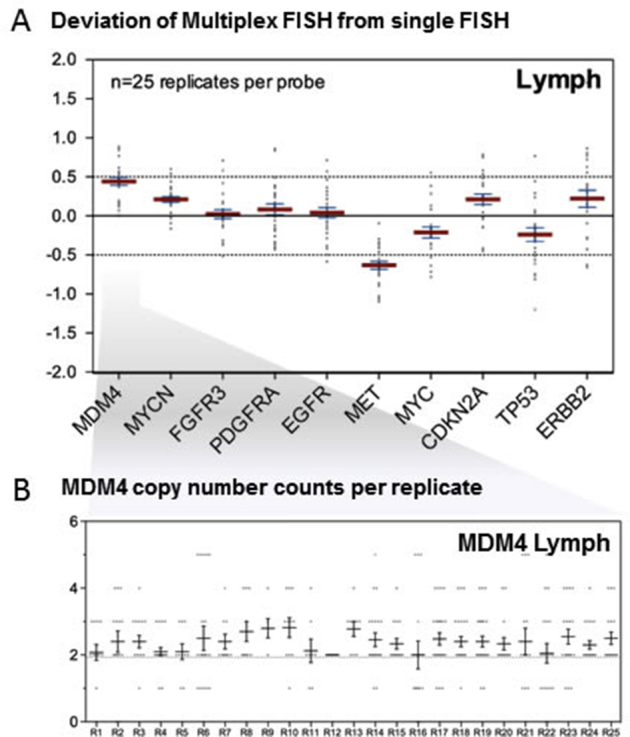
A: Accuracy displayed as a deviation plot of mean copy number for the lymphocyte data set. The y axis shows the absolute copy number deviation of automated multiplex fluorescence in situ hybridization (FISH) replicates (R) from the expected two copies. Of 10 probes, 9 have a mean deviation of <0.5, with MET being undercalled by multiplex FISH slightly. Mean (red lines) and SD (blue lines) are indicated. B: Detailed MDM4 data showing copy number counts for each individual replicate, with each dot representing a single-cell count and with mean and SD indicated. A small bias to slightly more than two copies is demonstrated.
References
- 1.Schrock E., du Manoir S., Veldman T., Schoell B., Wienberg J., Ferguson-Smith M.A., Ning Y., Ledbetter D.H., Bar-Am I., Soenksen D., Garini Y., Ried T. Multicolor spectral karyotyping of human chromosomes. Science. 1996;273:494–497. doi: 10.1126/science.273.5274.494. [DOI] [PubMed] [Google Scholar]
- 2.Speicher M.R., Gwyn Ballard S., Ward D.C. Karyotyping human chromosomes by combinatorial multi-fluor FISH. Nat Genet. 1996;12:368–375. doi: 10.1038/ng0496-368. [DOI] [PubMed] [Google Scholar]
- 3.Tanke H.J., Wiegant J., van Gijlswijk R.P., Bezrookove V., Pattenier H., Heetebrij R.J., Talman E.G., Raap A.K., Vrolijk J. New strategy for multi-colour fluorescence in situ hybridisation: COBRA: COmbined Binary RAtio labelling. Eur J Hum Genet. 1999;7:2–11. doi: 10.1038/sj.ejhg.5200265. [DOI] [PubMed] [Google Scholar]
- 4.Henegariu O., Artan S., Greally J.M., Chen X.N., Korenberg J.R., Vance G.H., Stubbs L., Bray-Ward P., Ward D.C. Cryptic translocation identification in human and mouse using several telomeric multiplex fish (TM-FISH) strategies. Lab Invest. 2001;81:483–491. doi: 10.1038/labinvest.3780256. [DOI] [PubMed] [Google Scholar]
- 5.Li R., Liu Z., Fan T., Jiang F. A novel multiple FISH array for the detection of genetic aberrations in cancer. Lab Invest. 2006;86:619–627. doi: 10.1038/labinvest.3700408. [DOI] [PubMed] [Google Scholar]
- 6.Van Loo P., Voet T. Single cell analysis of cancer genomes. Curr Opin Genet Dev. 2014;24:82–91. doi: 10.1016/j.gde.2013.12.004. [DOI] [PubMed] [Google Scholar]
- 7.Gawad C., Koh W., Quake S.R. Single-cell genome sequencing: current state of the science. Nat Rev Genet. 2016;17:175–188. doi: 10.1038/nrg.2015.16. [DOI] [PubMed] [Google Scholar]
- 8.Snuderl M., Fazlollahi L., Le L.P., Nitta M., Zhelyazkova B.H., Davidson C.J., Akhavanfard S., Cahill D.P., Aldape K.D., Betensky R.A., Louis D.N., Iafrate A.J. Mosaic amplification of multiple receptor tyrosine kinase genes in glioblastoma. Cancer Cell. 2011;20:810–817. doi: 10.1016/j.ccr.2011.11.005. [DOI] [PubMed] [Google Scholar]
- 9.Lau D., Magill S.T., Aghi M.K. Molecularly targeted therapies for recurrent glioblastoma: current and future targets. Neurosurg Focus. 2014;37:E15. doi: 10.3171/2014.9.FOCUS14519. [DOI] [PMC free article] [PubMed] [Google Scholar]
- 10.Johnson D.R., O'Neill B.P. Glioblastoma survival in the United States before and during the temozolomide era. J Neurooncol. 2012;107:359–364. doi: 10.1007/s11060-011-0749-4. [DOI] [PubMed] [Google Scholar]
- 11.Vredenburgh J.J., Desjardins A., Herndon J.E., 2nd, Marcello J., Reardon D.A., Quinn J.A., Rich J.N., Sathornsumetee S., Gururangan S., Sampson J., Wagner M., Bailey L., Bigner D.D., Friedman A.H., Friedman H.S. Bevacizumab plus irinotecan in recurrent glioblastoma multiforme. J Clin Oncol. 2007;25:4722–4729. doi: 10.1200/JCO.2007.12.2440. [DOI] [PubMed] [Google Scholar]
- 12.Stewart L.A. Chemotherapy in adult high-grade glioma: a systematic review and meta-analysis of individual patient data from 12 randomised trials. Lancet. 2002;359:1011–1018. doi: 10.1016/s0140-6736(02)08091-1. [DOI] [PubMed] [Google Scholar]
- 13.Wakimoto H., Mohapatra G., Kanai R., Curry W.T., Jr., Yip S., Nitta M., Patel A.P., Barnard Z.R., Stemmer-Rachamimov A.O., Louis D.N., Martuza R.L., Rabkin S.D. Maintenance of primary tumor phenotype and genotype in glioblastoma stem cells. Neuro Oncol. 2012;14:132–144. doi: 10.1093/neuonc/nor195. [DOI] [PMC free article] [PubMed] [Google Scholar]
- 14.Jordan N.V., Bardia A., Wittner B.S., Benes C., Ligorio M., Zheng Y., Yu M., Sundaresan T.K., Licausi J.A., Desai R., O'Keefe R.M., Ebright R.Y., Boukhali M., Sil S., Onozato M.L., Iafrate A.J., Kapur R., Sgroi D., Ting D.T., Toner M., Ramaswamy S., Haas W., Maheswaran S., Haber D.A. HER2 expression identifies dynamic functional states within circulating breast cancer cells. Nature. 2016;537:102–106. doi: 10.1038/nature19328. [DOI] [PMC free article] [PubMed] [Google Scholar]
- 15.Ronne M., Andersen O., Erlandsen M. Effect of colcemid exposure and methanol acetic acid fixation on human metaphase chromosome structure. Hereditas. 1979;90:195–201. doi: 10.1111/j.1601-5223.1979.tb01306.x. [DOI] [PubMed] [Google Scholar]
- 16.Otsu N. A threshold selection method from gray-level histograms. IEEE Trans Syst Man Cybern. 1979;9:62–66. [Google Scholar]
- 17.Vincent L.S., Soille P. Watersheds in digital spaces: an efficient algorithm based on immersion simulations. IEEE Trans Pattern Anal Mach Intell. 1991;13:583–598. [Google Scholar]
- 18.Aguet F., Antonescu C.N., Mettlen M., Schmid S.L., Danuser G. Advances in analysis of low signal-to-noise images link dynamin and AP2 to the functions of an endocytic checkpoint. Dev Cell. 2013;26:279–291. doi: 10.1016/j.devcel.2013.06.019. [DOI] [PMC free article] [PubMed] [Google Scholar]
- 19.Grigoriadis A., Mackay A., Noel E., Wu P.J., Natrajan R., Frankum J., Reis-Filho J.S., Tutt A. Molecular characterisation of cell line models for triple-negative breast cancers. BMC Genomics. 2012;13:619. doi: 10.1186/1471-2164-13-619. [DOI] [PMC free article] [PubMed] [Google Scholar]
- 20.Slamon D.J., Clark G.M., Wong S.G., Levin W.J., Ullrich A., McGuire W.L. Human breast cancer: correlation of relapse and survival with amplification of the HER-2/neu oncogene. Science. 1987;235:177–182. doi: 10.1126/science.3798106. [DOI] [PubMed] [Google Scholar]
- 21.Wolff A.C., Hammond M.E., Hicks D.G., Dowsett M., McShane L.M., Allison K.H., Allred D.C., Bartlett J.M., Bilous M., Fitzgibbons P., Hanna W., Jenkins R.B., Mangu P.B., Paik S., Perez E.A., Press M.F., Spears P.A., Vance G.H., Viale G., Hayes D.F., American Society of Clinical Oncology. College of American Pathologists Recommendations for human epidermal growth factor receptor 2 testing in breast cancer: American Society of Clinical Oncology/College of American Pathologists clinical practice guideline update. J Clin Oncol. 2013;31:3997–4013. doi: 10.1200/JCO.2013.50.9984. [DOI] [PubMed] [Google Scholar]
- 22.Yardley D.A., Kaufman P.A., Brufsky A., Yood M.U., Rugo H., Mayer M., Quah C., Yoo B., Tripathy D. Treatment patterns and clinical outcomes for patients with de novo versus recurrent HER2-positive metastatic breast cancer. Breast Cancer Res Treat. 2014;145:725–734. doi: 10.1007/s10549-014-2916-8. [DOI] [PMC free article] [PubMed] [Google Scholar]
- 23.Gerson J.N., Skariah S., Denlinger C.S., Astsaturov I. Perspectives of HER2-targeting in gastric and esophageal cancer. Expert Opin Investig Drugs. 2017;26:531–540. doi: 10.1080/13543784.2017.1315406. [DOI] [PMC free article] [PubMed] [Google Scholar]
- 24.Bartley A.N., Washington M.K., Ventura C.B., Ismaila N., Colasacco C., Benson A.B., 3rd, Carrato A., Gulley M.L., Jain D., Kakar S., Mackay H.J., Streutker C., Tang L., Troxell M., Ajani J.A. HER2 testing and clinical decision making in gastroesophageal adenocarcinoma: guideline from the College of American Pathologists, American Society for Clinical Pathology, and American Society of Clinical Oncology. Am J Clin Pathol. 2016;146:647–669. doi: 10.1093/ajcp/aqw206. [DOI] [PMC free article] [PubMed] [Google Scholar]
- 25.Lordick F., Janjigian Y.Y. Clinical impact of tumour biology in the management of gastroesophageal cancer. Nat Rev Clin Oncol. 2016;13:348–360. doi: 10.1038/nrclinonc.2016.15. [DOI] [PMC free article] [PubMed] [Google Scholar]
- 26.Ruschoff J., Hanna W., Bilous M., Hofmann M., Osamura R.Y., Penault-Llorca F., van de Vijver M., Viale G. HER2 testing in gastric cancer: a practical approach. Mod Pathol. 2012;25:637–650. doi: 10.1038/modpathol.2011.198. [DOI] [PubMed] [Google Scholar]
- 27.Albertson D.G. Gene amplification in cancer. Trends Genet. 2006;22:447–455. doi: 10.1016/j.tig.2006.06.007. [DOI] [PubMed] [Google Scholar]
- 28.Shlien A., Malkin D. Copy number variations and cancer susceptibility. Curr Opin Oncol. 2010;22:55–63. doi: 10.1097/CCO.0b013e328333dca4. [DOI] [PubMed] [Google Scholar]
- 29.Burford A., Little S.E., Jury A., Popov S., Laxton R., Doey L., Al-Sarraj S., Jurgensmeier J.M., Jones C. Distinct phenotypic differences associated with differential amplification of receptor tyrosine kinase genes at 4q12 in glioblastoma. PLoS One. 2013;8:e71777. doi: 10.1371/journal.pone.0071777. [DOI] [PMC free article] [PubMed] [Google Scholar]
- 30.Baudis M. Genomic imbalances in 5918 malignant epithelial tumors: an explorative meta-analysis of chromosomal CGH data. BMC Cancer. 2007;7:226. doi: 10.1186/1471-2407-7-226. [DOI] [PMC free article] [PubMed] [Google Scholar]
- 31.Krijgsman O., Carvalho B., Meijer G.A., Steenbergen R.D., Ylstra B. Focal chromosomal copy number aberrations in cancer: needles in a genome haystack. Biochim Biophys Acta. 2014;1843:2698–2704. doi: 10.1016/j.bbamcr.2014.08.001. [DOI] [PubMed] [Google Scholar]
- 32.Liu B., Morrison C.D., Johnson C.S., Trump D.L., Qin M., Conroy J.C., Wang J., Liu S. Computational methods for detecting copy number variations in cancer genome using next generation sequencing: principles and challenges. Oncotarget. 2013;4:1868–1881. doi: 10.18632/oncotarget.1537. [DOI] [PMC free article] [PubMed] [Google Scholar]
- 33.Haraksingh R.R., Abyzov A., Urban A.E. Comprehensive performance comparison of high-resolution array platforms for genome-wide copy number variation (CNV) analysis in humans. BMC Genomics. 2017;18:321. doi: 10.1186/s12864-017-3658-x. [DOI] [PMC free article] [PubMed] [Google Scholar]
- 34.Wolff A.C., Hammond M.E., Schwartz J.N., Hagerty K.L., Allred D.C., Cote R.J., Dowsett M., Fitzgibbons P.L., Hanna W.M., Langer A., McShane L.M., Paik S., Pegram M.D., Perez E.A., Press M.F., Rhodes A., Sturgeon C., Taube S.E., Tubbs R., Vance G.H., van de Vijver M., Wheeler T.M., Hayes D.F., American Society of Clinical Oncology; College of American Pathologists American Society of Clinical Oncology/College of American Pathologists guideline recommendations for human epidermal growth factor receptor 2 testing in breast cancer. J Clin Oncol. 2007;25:118–145. doi: 10.1200/JCO.2006.09.2775. [DOI] [PubMed] [Google Scholar]
- 35.Angelo M., Bendall S.C., Finck R., Hale M.B., Hitzman C., Borowsky A.D., Levenson R.M., Lowe J.B., Liu S.D., Zhao S., Natkunam Y., Nolan G.P. Multiplexed ion beam imaging of human breast tumors. Nat Med. 2014;20:436–442. doi: 10.1038/nm.3488. [DOI] [PMC free article] [PubMed] [Google Scholar]
- 36.Lee J.H., Daugharthy E.R., Scheiman J., Kalhor R., Yang J.L., Ferrante T.C., Terry R., Jeanty S.S., Li C., Amamoto R., Peters D.T., Turczyk B.M., Marblestone A.H., Inverso S.A., Bernard A., Mali P., Rios X., Aach J., Church G.M. Highly multiplexed subcellular RNA sequencing in situ. Science. 2014;343:1360–1363. doi: 10.1126/science.1250212. [DOI] [PMC free article] [PubMed] [Google Scholar]
- 37.Lee J.H., Daugharthy E.R., Scheiman J., Kalhor R., Ferrante T.C., Terry R., Turczyk B.M., Yang J.L., Lee H.S., Aach J., Zhang K., Church G.M. Fluorescent in situ sequencing (FISSEQ) of RNA for gene expression profiling in intact cells and tissues. Nat Protoc. 2015;10:442–458. doi: 10.1038/nprot.2014.191. [DOI] [PMC free article] [PubMed] [Google Scholar]
- 38.Venteicher A.S., Tirosh I., Hebert C., Yizhak K., Neftel C., Filbin M.G., Hovestadt V., Escalante L.E., Shaw M.L., Rodman C., Gillespie S.M., Dionne D., Luo C.C., Ravichandran H., Mylvaganam R., Mount C., Onozato M.L., Nahed B.V., Wakimoto H., Curry W.T., Iafrate A.J., Rivera M.N., Frosch M.P., Golub T.R., Brastianos P.K., Getz G., Patel A.P., Monje M., Cahill D.P., Rozenblatt-Rosen O., Louis D.N., Bernstein B.E., Regev A., Suva M.L. Decoupling genetics, lineages, and microenvironment in IDH-mutant gliomas by single-cell RNA-seq. Science. 2017;355:eaai8478. doi: 10.1126/science.aai8478. [DOI] [PMC free article] [PubMed] [Google Scholar]
Associated Data
This section collects any data citations, data availability statements, or supplementary materials included in this article.