

Abstract
Objective:
TKA outcomes are worse for patients from poor neighborhoods, but whether education mitigates the effect of poverty is not known. We assessed the interaction between education and poverty on 2-year WOMAC pain and function.
Methods:
Patient level variables from an institutional registry were linked to US Census Bureau data (census tract (CT) level). Statistical models including patient and CT level variables were constructed within multilevel frameworks. Linear mixed effect models with separate random intercepts for each CT were used to assess the interaction between education and poverty at the individual and community level on WOMAC scores.
Results:
Of 3970 TKA patients, 2438 (61%) had some college or more. Having no college was associated with worse pain and function at baseline and 2 years (p = 0.0001). Living in a poor neighborhood (>20% below poverty) was associated with worse 2-year pain (p = 0.02) and function (p = 0.006). There was a strong interaction between individual education and community poverty with WOMAC scores at two years. Patients without college living in poor communities had pain scores that were ~10 points worse than those with some college (83.4% vs. 75.7%, p < 0.0001); in wealthy communities, college was associated with 1 point difference in pain. Function was similar.
Conclusion:
In poor communities, those without college attain 2-year WOMAC scores that are 10 points worse than those with some college; education has no impact on TKA outcomes in wealthy communities. How education protects those in impoverished communities warrants further study.
Introduction
Social factors such as poverty are important determinants of health status. For example, pain after total knee replacement (TKA) is significantly worse two years after surgery in patients from high poverty neighborhoods (1, 2). Educational attainment has also been strongly associated with good health, including outcomes as varied as reduced all-cause mortality and higher birthweight (3–5). However, interactions between social factors can be complicated (6, 7). For example, we previously showed that pain and function 2 years after TKA is worse in blacks are compared to whites, but when poverty levels in the community are controlled for, the disparity only persists for blacks from poor communities, and not for blacks from wealthy communities (1). Whether education interacts with poverty in a similar way is unknown.
Area based socioeconomic factors can be studied when data at the individual level is lacking, and can provide a broader understanding of socioeconomic status. Features of community deprivation such as poverty are associated with sparse community resources needed for good health (8, 9), and poor health outcomes are consistently reported in communities where >20% of the population live below the poverty level (1, 10, 11). Studies suggest that higher community level education is associated with greater availability of health resources for residents (3, 12). Community level education is a useful measure because individual educational attainment can be difficult to ascertain (3, 12–14) Community level socioeconomics factors can be studied using Census Tract data. Census tract s are small geographic areas that typically contain 4,000 individuals and are designed for socioeconomic homogeneity (3). By linking individual patients to their Census Tract of origin, health outcomes can be studied across socioeconomic gradients (15), permitting the impact of social factors on outcomes to be assessed.
The primary objective of this study was to assess the impact of individual level education, community-level education, and community-level poverty on Western Ontario and McMaster Universities Osteoarthritis Index (WOMAC) pain and function scores 2 years after TKA. The second objective was to determine whether there is an interaction between individual level education and community level poverty as they impact those patient reported outcomes.
Methods
We performed a retrospective cohort study using prospectively acquired data in an institutional TKA registry at a high volume orthopedic hospital where over 4,000 TKA are performed yearly. All patients undergoing TKA between May 1, 2007 and February 25, 2011 were approached prior to surgery to participate in the registry, and data was collected at baseline and 2 years after TKA. The study was approved by the hospital’s institutional ethical review board.
Patients
Over 80% of patients approached prior to TKA consented to participate in the registry and provided data. We included patients undergoing primary TKA that provided both baseline and 2-year data, had identified race, were age 18 or older, and had a geocodeable U.S. address within New York, New Jersey, and Connecticut.
We excluded patients who underwent revision TKA or bilateral TKA, as well as those with a contralateral TKA within 2 years of the index surgery (so that the 2-year outcome data would reflect the index surgery). We used ICD-9 codes to exclude patients undergoing TKA for fracture.
Variables
Baseline data collected on all consented registry patients including age, gender, body mass index (BMI), ethnicity (non-Hispanic or Hispanic), race, insurance status (Medicare, Medicaid or other) and education (some college or above, or no college). Administrative data included Charlson-Deyo-comorbidities (16) and patient address, as well as race (if available) when not self-identified by the patient. Patient expectations were measured using the HSS Total Knee Replacement Expectations Survey (17), a validated instrument that specifically assesses patients’ preoperative expectations in areas specific to TKA, including pain relief and resumption of activities such as sports and recreation. The survey uses a 1–100 scale (with a higher score indicating higher expectations for the outcome of surgery). A difference of 7 is considered the minimum clinically important difference (MCID) (17, 18). We collected baseline and 2-year Knee Osteoarthritis Outcomes (KOOS) pain score and KOOS function score from which the WOMAC was derived (19, 20). The WOMAC is a lower extremity-specific scale that has been validated for TKA; in our study we used a 0–100 scale with a higher score indicating better status. The MCID for WOMAC pain and function is >10 points (21).
Census tract data
Education and poverty at the community level was determined using Census Tract data, by linking registry patients to specific Census Tract s after geocoding individual patients’ addresses. We obtained Census Tract -level socioeconomic variables from the American Community Survey/U.S. Census using the ARC Geographic Information Systems (ARCGIS) (15, 22). The Census Tract variables of interest were “percent of the population living below the poverty level” (Census Tract poverty), and “percent of the population 25 or older with bachelor’s degree or above” (Census Tract college). We dichotomized community poverty (<20% below poverty vs. ≥ 20% below poverty) to capture poverty levels associated with poor health outcomes. We dichotomized Census Tract college as < 15% vs ≥ 15% due to the statistical fit (23).
Outcomes:
The two primary outcomes were WOMAC pain and WOMAC function scores 2 years after TKA.
Statistics
Baseline characteristics and 2-year outcomes were summarized using descriptive statistics, and were compared using t-test or Wilcoxon rank sum test for continuous variables and chi-square or Fisher’s exact test for categorical variables. Census Tract level variables were summarized for all Census Tract s using descriptive statistics We assessed exclusion bias by comparing baseline characteristics of patients with and without individual education information and with and without WOMAC function scores at 2 years using t-test or Wilcoxon rank sum test for continuous variables and chi-square or Fisher’s exact test for categorical variables. Spearman’s correlation coefficient was calculated to quantify the correlation between Census Tract -level variables.
A univariable analysis was performed exploring age, sex, BMI, race, ethnicity, education, Charlson-Deyo comorbidities, insurance status, HSS Expectation score and baseline WOMAC pain and function for associations with WOMAC pain and function at 2 years, and included any terms with a p-value less than 0.1 in our model. A multivariable linear mixed-effect model with random intercept for each census tract was first performed by including only patient-level variables as predictors of WOMAC pain and function 2 years after TKA.
For multivariable analysis of predictors of WOMAC pain at 2 years, age, gender and Charlson comorbidities were forced to stay in the model as variables of interest; the model excluding insurance and ethnicity had smallest Akaike Information Criterion (AIC) reflecting the best fit for our data, comparing with the other candidate models (Table 2). For multivariable analysis of predictors of WOMAC function at 2 years, age, gender and Charlson-comorbidities were also forced to stay in the model as variables of interest; the model excluding insurance had smallest AIC comparing with the other candidate models,
Table 2.
WOMAC pain and function 2 years after total knee arthroplasty: interaction between education and percent below poverty at census-tract level
| Percent below poverty at Census-Tract Level‡ |
Education | WOMAC Pain at 2 Years* | WOMAC Function at 2 Years** | ||||
|---|---|---|---|---|---|---|---|
| Estimate (Standard Error) |
Estimated Difference (Standard Error) |
P-Value | Estimate (Standard Error) |
Estimated Difference (Standard Error) |
P-Value | ||
| 10% | Non-college College/above |
83.36 (0.76) 87.10 (0.75) |
−3.74 (0.60) | <0.0001 | 81.01 (0.76) 83.55 (0.75) |
−2.54 (0.61) | <0.0001 |
| 20% | Non-college College/above |
81.23 (0.90) 86.90 (0.97) |
−5.66 (1.11) | <0.0001 | 79.17 (0.90) 83.30 (0.99) |
−4.13 (1.13) | 0.0003 |
| 30% | Non-college College/above |
79.11 (1.27) 86.70 (1.37) |
−7.58 (1.80) | <0.0001 | 77.34 (1.27) 83.05 (1.41) |
−5.71 (1.82) | 0.0017 |
| 40% | Non-college College/above |
76.99 (1.74) 86.49 (1.85) |
−9.50 (2.51) | 0.0002 | 75.51 (1.74) 82.80 (1.90) |
−7.30 (2.55) | 0.0042 |
| 50% | Non-college College/above |
74.87 (2.25) 86.29 (2.34) |
−11.41 (3.24) | 0.0004 | 73.67 (2.24) 82.55 (2.41) |
−8.88 (3.29) | 0.0069 |
| 60% | Non-college College/above |
72.75 (2.77) 86.09 (2.85) |
−13.33 (3.97) | 0.0008 | 71.83 (2.76) 82.30 (2.93) |
−10.47 (4.03) | 0.0094 |
Estimation based on linear mixed-effect model assessing the effect of interaction between education and percent below poverty at census-tract level on WOMAC pain at 2 years after TKA, using the following assumptions: WOMAC pain at baseline=54; age at surgery=67; BMI=30/kg/m2; sex=female; comorbidities=0; race=black
Estimation based on linear mixed-effect model assessing the effect of interaction between race and percent of Medicaid coverage at census-tract level on WOMAC function at 2 years after THA, using the following assumptions: WOMAC function at baseline=54; age at surgery=67; BMI=30/kg/m2; sex=female; comorbidities=0; race=black
Percent below poverty at census-tract level was taken as a continuous variable in this model for prediction purposes
The two models (WOMAC pain and function) were then expanded to include Census Tract college (Table 3) and Census Tract poverty (Table 3). If a census tract-level variable was statistically significant in the model, the interaction between individual education level and this variable was assessed. The assumptions for the model for continuous variables (WOMAC pain, WOMAC function, age, and BMI) were the mean of the cohort. The categorical variables sex=female, comorbidities=0 and race=black were assumed because they were the non-reference group (with value of 1) in the model.
Table 3.
Characteristics of the cohort
| Characteristic | Total | College or above | Non-college | P-Value |
|---|---|---|---|---|
| Number of patients | 3970 (100%) | 2438 (61%) | 1532 (39%) | |
| Age at surgery (years), mean (SD) | 67.13(9.58) | 66.86 (9.35) | 67.55 (9.92) | 0.014 |
| Female, n (%) | 2437 (61.39%) | 1397 (57.30%) |
1040 (67.89%) |
<0.0001 |
| BMI (kg/m2), mean (SD) | 29.99 (5.92) | 29.29 (5.53) | 31.10 (6.34) | <0.0001 |
| Hispanic, n (%) | 81 (2.30%) | 39 (1.78%) |
42 (3.15%) |
0.008 |
| One or more comorbidities, n (%) | 1120 (28.21%) | 634 (26.00%) | 486 (31.72%) | <0.0001 |
| White, n (%) | 3780 (95.21%) |
2352 (96.47%) |
1428 (93.21%) |
<0.0001 |
|
Insurance payer, n (%) Medicaid Medicare Other insurance |
58 (1.46%) 2492 (62.77%) 1420 (35.77%) |
13 (0.53%) 1499 (61.48%) 926 (37.98%) |
45 (2.94%) 993 (64.82%) 494 (32.25%) |
<0.0001 |
|
ASA Class, n (%) Missing I-II III-IV |
2 3162 (79.69%) 806 (20.31%) |
1 1963 (80.55%) 474 (19.45%) |
1 1199 (78.31%) 332 (21.69%) |
0.09 |
|
Hospital for Special Surgery Expectations Score, mean (SD) |
78.50 (17.99) | 79.03 (17.56) | 77.59 (18.68) | 0.087 |
| WOMAC pain at baseline, mean (SD) | 54.32 (17.65) | 57.23 (16.92) | 49.63 (17.81) | <0.0001 |
| WOMAC pain at 2 Years, mean (SD) | 87.42 (16.05) | 89.21 (14.01) | 84.54 (18.52) | <0.0001 |
| Delta WOMAC pain, mean (SD) | 33.13 (20.30) | 32.08 (19.36) | 34.85 (21.65) | <0.0001 |
| WOMAC function at baseline, mean (SD) | 53.45 (17.76) | 56.95 (17.07) | 47.85 (17.39) | <0.0001 |
| WOMAC function at 2 Years, mean (SD) | 85.08 (16.49) | 86.94 (14.52) | 82.09 (18.86) | <0.0001 |
| Delta WOMAC function, mean (SD) | 31.58 (19.73) | 30.00 (18.87) | 34.11 (20.80) | <0.0001 |
|
Census Tract Percent Below Poverty Level, n (%) <10% 10%-20% >20% |
3174 (79.97%) 594 (14.97%) 201 (5.06%) |
2021 (82.93%) 318 (13.05%) 98 (4.02%) |
1153 (75.26%) 276 (18.02%) 103 (6.72%) |
<0.0001 |
|
Census Tract Percent Below Poverty Level, n (%) Low poverty <15% Middle to high poverty >=15% |
3174 (79.97%) 594 (14.97%) |
2247 (92.20%) 190 (7.80%) |
1346 (87.86%) 186 (12.14%) |
<0.0001 |
|
Census Tract Percent of 25 or older with Bachelor’s degree or above, n (%) Low Education <15% Middle Education 15%−39.9% High Education >=40% |
81 (2.04%) 1194 (30.08%) 2695 (67.88%) |
18 (0.74%) 537 (22.03%) 1883 (77.24%) |
63 (4.11%) 657 (42.89%) 812 (53.00%) |
<0.0001 |
BMI=body mass index; ASA=American Society of Anesthesiologists; HSS=Hospital for Special Surgery; WOMAC=Western Ontario and McMaster Universities Osteoarthritis Index.
RESULTS
Individual level data:
Patient characteristics are summarized in Table 1. The final cohort consisted of 3970 patients, 2438 (61%) of whom had at least some college (Figure 1). Patients with no college were older (mean 67.6 years (SD 9.9) vs 66.9 (SD 9.4), p = 0.014), and more likely to be female (67.9% vs. 57.3%, p < 0.0001) and Hispanic (3.2% vs 1.8%, p = 0.008), had higher BMI (mean 31.1 (SD 6.3) vs 29.3 (SD 5.5), p < 0.0001) and more likely to have one or more comorbidities (31.7% vs 26%, p < 0.0001). Patients without any college were also less likely to be white (93.2% vs 96.5%, p < 0.0001), and more likely to be insured by Medicaid (2.9% vs 0.5%, p < 0.0001). Overall mean WOMAC pain scores for patients without college were 7 points worse at baseline (p < 0.001) and 4 points worse at 2 years (p < 0.001) than for patients with some college or above. Mean WOMAC function scores for patients without college were 9 points lower at baseline (p < 0.001) and 5 points lower at 2 years (p < 0.001) compared to patients with some college or above. Patients without college had greater improvement in WOMAC pain and function scores over two years than those with some college or more (32.1 +/− 19.4 vs. 34.9 +/− 21.7 pain, p < 0.001; 30 +/− 18.9 vs. 34.1 +/− 20.8 function, p < 0.001), differences that are statistically but not clinically significant. Excluded patients with missing WOMAC pain and function scores at 2 years were older, had lower BMI and a higher percent had ≥ 1 comorbidities. Those with missing WOMAC function data were more often in ASA class III-IV.
Table 1:
Multivariable analysis of predictors of pain and function at 2 years*
| Individual level variable | WOMAC pain at 2 years | WOMAC Function at 2 years | ||
|---|---|---|---|---|
| Estimate (Standard error) |
p value | Estimate (standard error) |
p value | |
| Age at surgery | 0.02 (0.03) | 0.51 | −0.11 (0.03) | <0.0001 |
| Sex (female versus. male) | −0.55 (0.55) | 0.32 | −0.33 (0.54) | 0.55 |
| BMI | 0.01 (0.05) | 0.77 | −0.06 (0.05) | 0.17 |
|
Race (black versus white) |
−5.20 (1.34) | <0.0001 | −6.45 (1.34) | <0.0001 |
| Education (no college versus college or above) | −3.26 (0.56) | <0.0001 | −2.14 (0.56) | 0.0001 |
| Charlson-Deyo comorbidities (≥1 versus 0) | −0.55 (0.59) | 0.36 | −0.76 (0.60) | 0.20 |
| WOMAC pain at baseline | 0.21 (0.02) | <0.0001 | - | - |
| WOMAC function at baseline | - | - | 0.28 (0.02) | <0.0001 |
WOMAC=Western Ontario and McMaster Universities Osteoarthritis Index; BMI=body mass index.
Figure 1.
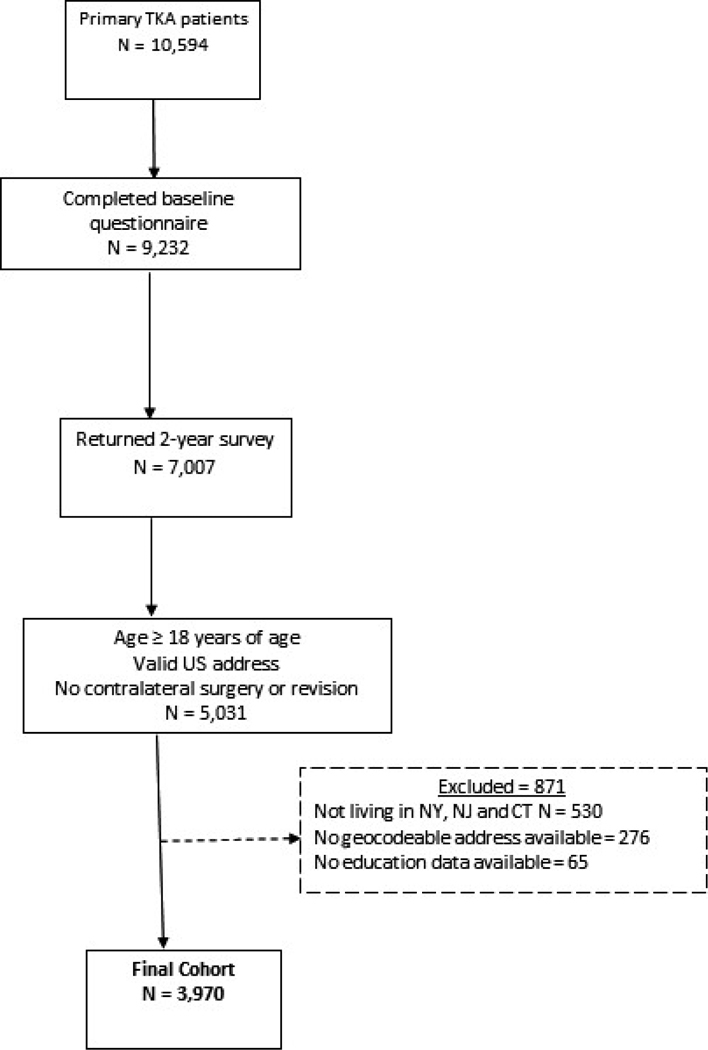
Flow diagram of patients in the Hospital for Special Surgery cohort. TKA = total knee arthroplasty.
Table 2 shows the results of the multivariable analysis of predictors of WOMAC pain and function at 2 years using individual level variables only, demonstrating a significant association between race, education, baseline pain and function, and 2 year WOMAC pain and function.
Census tract data:
The included patients came from a total of 1988 census tracts in New York, New Jersey, and Connecticut (out of a total of 7762 census tracts in these three states). Of these census tracts, 1106 (56%) were linked to only one registry patient, 749 (38%) were linked to two to four patients, and the remaining (6%) were linked to five to twenty patients (Appendix Table 1. Census tract distribution) No imputation of missing data was done since less than 3.5% was missing. The mean percent Census Tract poverty was 8% ± 9% (range 0%−74%) and the mean percent Census Tract college was 45% ± 19% (range 0%−91%). There was a moderate negative correlation at the Census Tract level between Census Tract college and Census Tract poverty (rho = −0.42; p<0.001).
More patients without (individual level) college lived in poor neighborhoods (Census Tract poverty ≥ 20%; 6.72% vs. 4.02%; p < 0.0001) and in neighborhoods where college education was less common (Census Tract college <15%, 4.11% vs. 0.74%; p < 0.0001) (Figure 2).
Figure 2.
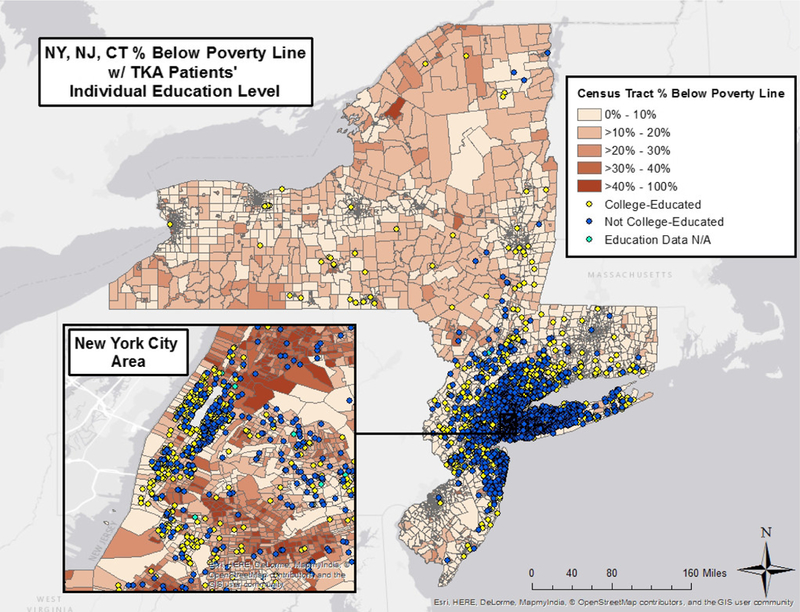
Census tract percentage below poverty line and total knee arthroplasty patients’ individual education level for New York, New Jersey, and Connecticut. N/A = not available.
High Census Tract poverty levels (≥ 20%) were a statistically significant predictor of worse WOMAC pain (p=0.02) and WOMAC function (p=0.006) at 2 years, but the difference was small. High levels of Census Tract education (>15%) predicted better WOMAC pain scores at 2 years (p=0.02) and low levels of Census Tract education were marginally associated with worse WOMAC function scores at 2 years (p=0.06), but the difference for both was small.
Interaction of Poverty and Education
We added an interaction term between individual education and Census Tract poverty into our models to determine the effect of education and poverty on the association of WOMAC pain and function at 2 years. We found a strong interaction between individual level education and Census Tract poverty for both WOMAC pain (Pinteraction term=0.001) and WOMAC function (Pinteraction=0.035) at 2 years (Table 3). Specifically, as Census Tract poverty levels increased, WOMAC pain and function progressively worsened for all patients, but the effect was much more pronounced among patients without college than patients with college (Table 3). For example, with the other variables in the model held constant (WOMAC pain = 54; age = 67; BMI = 30; sex = female; comorbidities = 0; race = black), in neighborhoods with little poverty (Census Tract poverty 10%), the estimated difference in WOMAC pain scores between patients with and without college was small (3.74 ± 0.60 points; p < 0.0001). However, in high poverty neighborhoods (Census Tract poverty > 60%), the estimated difference for those without college increased in a step wise fashion (13.3 ± 3.9 points; p = 0.0008). Similarly, estimated WOMAC function scores at 2 years were only 2.5 ± 0.6 lower for patients without college compared to those with college in communities with little poverty (10% Census Tract poverty, p < 0.0001), but was much worse (10.5 ± 4.03 lower) in impoverished communities (60% Census Tract poverty, p = 0.009). The relationship between 2-year WOMAC pain outcome and WOMAC function outcome and Census Tract poverty for patients with and without some college is shown in the scatterplots (Figure 3).
Figure 3.
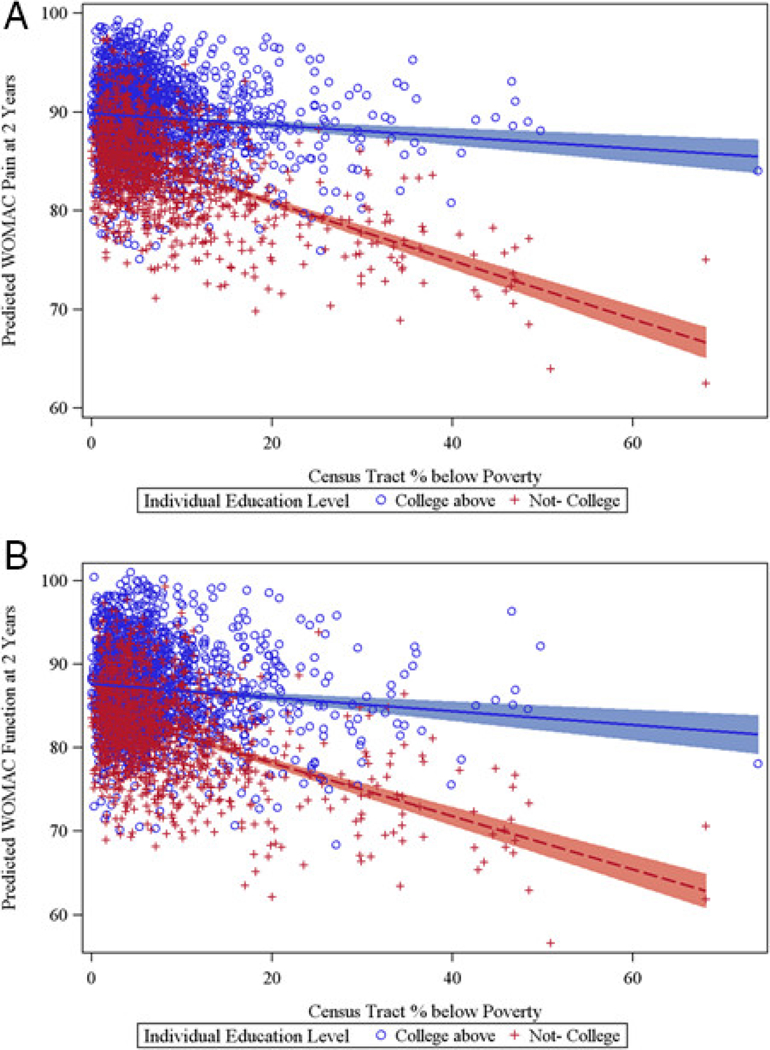
Scatterplots showing relationship of 2‐year Western Ontario and McMaster Universities Osteoarthritis Index (WOMAC) scores for pain (A) and function (B) with census tract percent below poverty for individual education level: no college, or college or above.
Unlike neighborhood poverty, the interaction between community education and individual level education impacting WOMAC pain at 2 years was weak, with no interaction impacting WOMAC function at 2 years (Appendix Table 2). Those without college in low education communities had slightly worse WOMAC pain than in high education neighborhoods, while for those with college, the results were similar in both neighborhoods.
Discussion
We demonstrate that the effects of community poverty are associated with a stepwise worsening of pain and function after TKA, but only in individuals without any college education. In poor communities, those with some college education achieve significantly better WOMAC scores than those without college education, whereas in wealthy communities, college education provides little additional benefit. Although the impact of poverty and low educational attainment on TKA outcomes has been previously described, (24–28), this is the first study to describe the interaction between community poverty and education as it impacts TKA outcomes.
Why education has such a strong protective effect on TKA outcomes is not clear. Education may be associated with healthy behaviors and better access to care (3). Low educational level has been associated with a variety of risk factors for poor health including smoking, poor blood pressure control, and poor diet (10, 29). In our cohort, those with some college education had lower BMI and fewer co-morbidities; however, these factors were not independently associated with poor TKA outcomes. Patients without any college had worse baseline WOMAC pain and function scores than those with some college, suggesting that they may have presented later for surgery, as has been reported in other vulnerable groups. The reasons for this are not clear, but may be due to low health literacy, or fear of risks of medical interventions (30, 31). These data additionally suggest that education may facilitate access to health resources and benefits, despite community poverty levels. Even in the poorest neighborhoods, those with at least some college education had outcomes that were not different from those in wealthy neighborhoods. In high poverty neighborhoods, where there is little access to resources necessary for health, those with some college education were protected from poorer outcomes, suggesting ability to access resources needed for health benefits(3).
Individual educational attainment can be difficult to study (3, 12–14) and is often recorded inaccurately for the elderly. In one study, only 38% of those recorded as being high school graduates on their death certificate had self-reported high school graduation on a previous household survey (5, 32) In the past, higher education was discouraged for women, so an elderly women’s educational attainment may not match her socioeconomic status and may effect arthroplasty studies, as the average age of patients undergoing arthroplasty is 68 (33). Although inaccuracies have been reported using individual level education data in this age group for other health outcomes (5), in our TKA cohort, self-reported individual level education was an accurate predictor of TKA outcome, and we did not rely on administrative data for this information. Our model was not strengthened by including the variable, Census Tract education.
Our results are limited by the low proportion of registry patients from impoverished neighborhoods, and the high proportion with some college education. There was also limited representation of patients from racial and ethnic minorities. All surgeries were performed at a single high volume tertiary care orthopedic center, which is not true of the majority of TKA procedures nationwide. We included patients who returned 2 year surveys, and those with poorer outcomes may not have responded. Although this could result in selection bias (34), the number of patients excluded on the basis of missing data was low. As in all observational studies, unmeasured confounders may have affected the results.
In summary, while we have affirmed the strong benefit of education on TKA outcomes, we demonstrate that this benefit is most significant for patients from neighborhoods with high poverty levels. Level of education should be collected on all preoperative patients, and a note made of the community in which they live. Patients without any college education who are from impoverished neighborhoods are a vulnerable group that should be targeted for pre- and postoperative interventions. In particular, they should be encouraged to undergo arthroplasty earlier than they may be inclined to, in order to minimize their postoperative pain and maximize their postoperative function.
Supplementary Material
SIGNIFICANCE AND INNOVATIONS.
We demonstrate that the effects of community poverty are associated with a stepwise worsening of pain and function after TKA, but only in individuals without any college education.
In poor communities, those with some college education achieve significantly better WOMAC scores than those without college education, whereas in wealthy communities, college education provides little additional benefit.
Although the impact of poverty and low educational attainment on TKA outcomes has been previously described, this is the first study to describe the interaction between community poverty and education as it impacts TKA outcomes.
Acknowledgments
financial support:
1. Susan M Goodman, MD – fees from The ACR and Celgene, outside the scope of the work.
2. Lisa A Mandl, MD, MPH – personal fees from Boehringer-Ingelheim, and Publishing Royalties/financial or material support from Up-To-Date, outside the submitted work
3. Bella Mehta, MD
4. Iris Navarro-Millan, MD – K-23 funding from the NIH (1K23AR068449–01A1)
5. Linda A Russell, MD
6. Michael L Parks, MD – personal fees from Zimmer, outside the submitted work
7. Shirin A Dey, BS
8. Daisy Crego, BA
9. Mark P Figgie, MD – receipt of royalties from Lima, stock or other stock options from Mekanika, outside the submitted work
10. Joseph T Nguyen, MPH
11. Jackie Szymonifka, MS
12. Meng Zhang, PhD
13. Anne R Bass, MD – personal fees from Abbott, and personal fees from Pfizer, outside the submitted work
Footnotes
Conflict of Interest Statement: We have no conflicts of interest to declare directly related to the submission of this manuscript. Other financial conflicts of interest and sources of funding reported by our authors are as stated above.
References
- 1.Goodman SM, Mandl LA, Parks ML, Zhang M, McHugh KR, Lee YY, et al. Disparities in TKA Outcomes: Census Tract Data Show Interactions Between Race and Poverty. Clin Orthop Relat Res 2016; 474:1986–95. [DOI] [PMC free article] [PubMed] [Google Scholar]
- 2.Goodman SM, Parks ML, McHugh K, Fields K, Smethurst R, Figgie MP, et al. Disparities in Outcomes for African Americans and Whites Undergoing Total Knee Arthroplasty: A Systematic Literature Review. J Rheumatol 2016; 43:765–70. [DOI] [PubMed] [Google Scholar]
- 3.Subramanian SV, Chen JT, Rehkopf DH, Waterman PD, Krieger N. Comparing individual- and area-based socioeconomic measures for the surveillance of health disparities: A multilevel analysis of Massachusetts births, 1989–1991. Am J Epidemiol 2006; 164:823–34. [DOI] [PubMed] [Google Scholar]
- 4.Chen JT, Rehkopf DH, Waterman PD, Subramanian SV, Coull BA, Cohen B, et al. Mapping and measuring social disparities in premature mortality: the impact of census tract poverty within and across Boston neighborhoods, 1999–2001. J Urban Health 2006; 83:1063–84. [DOI] [PMC free article] [PubMed] [Google Scholar]
- 5.Rehkopf DH, Haughton LT, Chen JT, Waterman PD, Subramanian SV, Krieger N. Monitoring socioeconomic disparities in death: comparing individual-level education and area-based socioeconomic measures. Am J Public Health 2006; 96:2135–8. [DOI] [PMC free article] [PubMed] [Google Scholar]
- 6.Mackenbach JP, Stirbu I, Roskam AJ, Schaap MM, Menvielle G, Leinsalu M, et al. Socioeconomic inequalities in health in 22 European countries. N Engl J Med 2008;358:2468–81. [DOI] [PubMed] [Google Scholar]
- 7.Martikainen P, Lahelma E, Ripatti S, Albanes D, Virtamo J. Educational differences in lung cancer mortality in male smokers. Int J Epidemiol 2001; 30:264–7. [DOI] [PubMed] [Google Scholar]
- 8.Diez Roux AV. Investigating neighborhood and area effects on health. Am J Public Health 2001; 91:1783–9. [DOI] [PMC free article] [PubMed] [Google Scholar]
- 9.Hilmers A, Hilmers DC, Dave J. Neighborhood disparities in access to healthy foods and their effects on environmental justice. Am J Public Health 2012; 102:1644–54. [DOI] [PMC free article] [PubMed] [Google Scholar]
- 10.Everett BG, Rehkopf DH, Rogers RG. The Nonlinear Relationship between Education and Mortality: An Examination of Cohort, Race/Ethnic, and Gender Differences. Popul Res Policy Rev 2013; 32:10. [DOI] [PMC free article] [PubMed] [Google Scholar]
- 11.Christine PJ, Auchincloss AH, Bertoni AG, Carnethon MR, Sanchez BN, Moore K, et al. Longitudinal Associations Between Neighborhood Physical and Social Environments and Incident Type 2 Diabetes Mellitus: The Multi-Ethnic Study of Atherosclerosis (MESA). JAMA Intern Med 2015;. [DOI] [PMC free article] [PubMed] [Google Scholar]
- 12.Davey Smith G, Hart C, Hole D, MacKinnon P, Gillis C, Watt G, et al. Education and occupational social class: which is the more important indicator of mortality risk?. J Epidemiol Community Health 1998; 52:153–60. [DOI] [PMC free article] [PubMed] [Google Scholar]
- 13.Conti G, Heckman J, Urzua S. The Education-Health Gradient. Am Econ Rev 2010; 100:234–8. [DOI] [PMC free article] [PubMed] [Google Scholar]
- 14.Baker DP, Leon J, Smith Greenaway EG, Collins J, Movit M. The education effect on population health: a reassessment. Popul Dev Rev 2011;37:307–32. [DOI] [PMC free article] [PubMed] [Google Scholar]
- 15.Krieger N, Chen JT, Waterman PD, Rehkopf DH, Subramanian SV. Painting a truer picture of US socioeconomic and racial/ethnic health inequalities: the Public Health Disparities Geocoding Project. Am J Public Health 2005; 95:312–23. [DOI] [PMC free article] [PubMed] [Google Scholar]
- 16.Deyo RA, Cherkin DC, Ciol MA. Adapting a clinical comorbidity index for use with ICD-9-CM administrative databases. J Clin Epidemiol 1992; 45:613–9. [DOI] [PubMed] [Google Scholar]
- 17.Mancuso CA, Sculco TP, Wickiewicz TL, Jones EC, Robbins L, Warren RF, et al. Patients’ expectations of knee surgery. J Bone Joint Surg Am 2001; 83:1005–12. [DOI] [PubMed] [Google Scholar]
- 18.Mancuso CA, Salvati EA, Johanson NA, Peterson MG, Charlson ME. Patients’ expectations and satisfaction with total hip arthroplasty. J Arthroplasty 1997; 12:387–96. [DOI] [PubMed] [Google Scholar]
- 19.Bellamy N Outcome measurement in osteoarthritis clinical trials. J Rheumatol Suppl 1995; 43:49–51. [PubMed] [Google Scholar]
- 20.Bellamy N Instruments to assess osteoarthritis--current status and future needs. Ann Rheum Dis 1995; 54:692–3. [DOI] [PMC free article] [PubMed] [Google Scholar]
- 21.Wells G, Anderson J, Beaton D, Bellamy N, Boers M, Bombardier C, et al. Minimal clinically important difference module: summary, recommendations, and research agenda. J Rheumatol 2001; 28:452–4. [PubMed] [Google Scholar]
- 22.Krieger N, Chen JT, Waterman PD, Rehkopf DH, Subramanian SV. Race/ethnicity, gender, and monitoring socioeconomic gradients in health: a comparison of area-based socioeconomic measures--the public health disparities geocoding project. Am J Public Health 2003;93:1655–71. [DOI] [PMC free article] [PubMed] [Google Scholar]
- 23.Chen JT, Rehkopf DH, Waterman PD, Subramanian SV, Coull BA, Cohen B, et al. Mapping and measuring social disparities in premature mortality: the impact of census tract poverty within and across Boston neighborhoods, 1999–2001. J Urban Health 2006; 83:1063–84. [DOI] [PMC free article] [PubMed] [Google Scholar]
- 24.Jiang Y, Sanchez-Santos MT, Judge AD, Murray DW, Arden NK. Predictors of Patient-Reported Pain and Functional Outcomes Over 10 Years After Primary Total Knee Arthroplasty: A Prospective Cohort Study. J Arthroplasty 2017; 32:92,100 [DOI] [PMC free article] [PubMed] [Google Scholar]
- 25.Judge A, Arden NK, Cooper C, Kassim Javaid M, Carr AJ, Field RE, et al. Predictors of outcomes of total knee replacement surgery. Rheumatology (Oxford) 2012; 51:1804–13. [DOI] [PubMed] [Google Scholar]
- 26.Davis ET, Lingard EA, Schemitsch EH, Waddell JP. Effects of socioeconomic status on patients’ outcome after total knee arthroplasty. Int J Qual Health Care 2008; 20:40–6. [DOI] [PubMed] [Google Scholar]
- 27.Feldman CH, Dong Y, Katz JN, Donnell-Fink LA, Losina E. Association between socioeconomic status and pain, function and pain catastrophizing at presentation for total knee arthroplasty. BMC Musculoskelet Disord 2015; 16: 015–0475 [DOI] [PMC free article] [PubMed] [Google Scholar]
- 28.Lungu E, Vendittoli PA, Desmeules F. Preoperative Determinants of Patient-reported Pain and Physical Function Levels Following Total Knee Arthroplasty: A Systematic Review. Open Orthop J 2016; 10:213–31. [DOI] [PMC free article] [PubMed] [Google Scholar]
- 29.Rehkopf DH, Dow WH, Rosero-Bixby L. Differences in the association of cardiovascular risk factors with education: a comparison of Costa Rica (CRELES) and the USA (NHANES). J Epidemiol Community Health 2010; 64:821–8. [DOI] [PMC free article] [PubMed] [Google Scholar]
- 30.Suarez-Almazor ME, Souchek J, Kelly PA, O’Malley K, Byrne M, Richardson M, et al. Ethnic variation in knee replacement: patient preferences or uninformed disparity?. Arch Intern Med 2005; 165:1117–24. [DOI] [PubMed] [Google Scholar]
- 31.Curtis CE. Ethnic differences in medical procedure discussions. J Clin Epidemiol 2007; 60:593. [DOI] [PMC free article] [PubMed] [Google Scholar]
- 32.Sorlie PD, Johnson NJ. Validity of education information on the death certificate. Epidemiology 1996; 7:437–9. [DOI] [PubMed] [Google Scholar]
- 33.Singh JA, Lewallen DG. Time trends in the characteristics of patients undergoing primary total knee arthroplasty. Arthritis Care Res (Hoboken) 2014; 66:897–906. [DOI] [PMC free article] [PubMed] [Google Scholar]
- 34.Kim J, Lonner JH, Nelson CL, Lotke PA. Response bias: effect on outcomes evaluation by mail surveys after total knee arthroplasty. J Bone Joint Surg Am 2004; 86:15–21. [PubMed] [Google Scholar]
Associated Data
This section collects any data citations, data availability statements, or supplementary materials included in this article.